PROTECTED SOURCE SCRIPT
تم تحديثه Candles

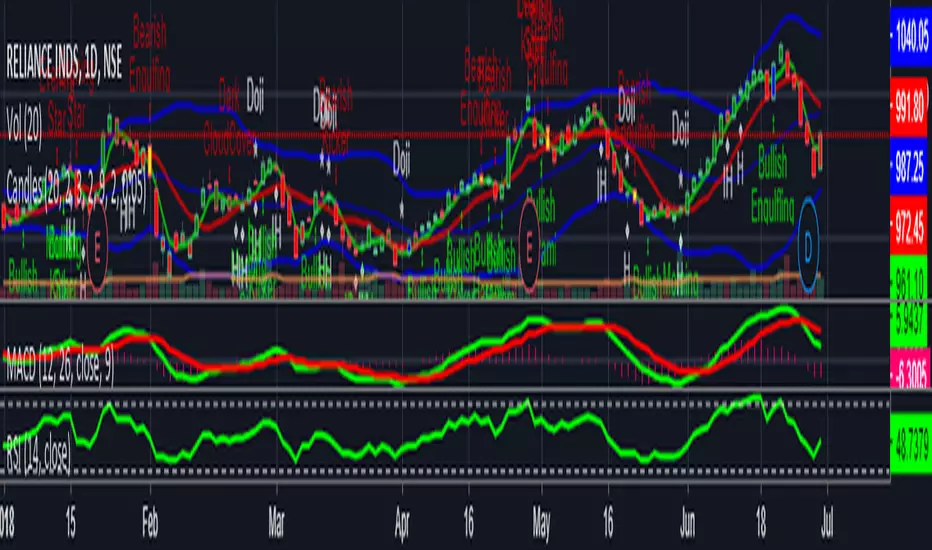
The default script has: Bolinger Bands, Moving Average and Doji , Bearish Harami, Bullish Harami, Bearish Engulfing , Bullish Engulfing , Piercing Line, Bullish Belt, Bullish Kicker, and Bearish Kicker. The Piercing Line, Bullish Belt, and the Kickers will usually show up better in the daily charts.
Please note if moving average SMA (green line) crosses above SMA (red line) is uptrend , stock price will move up gradually. If suppose moving average SMA (green line) crosses below SMA(red line) is downtrend, stock price will move down. Also please validate with MACD & RSI for reference will get more clarity.
Please note if moving average SMA (green line) crosses above SMA (red line) is uptrend , stock price will move up gradually. If suppose moving average SMA (green line) crosses below SMA(red line) is downtrend, stock price will move down. Also please validate with MACD & RSI for reference will get more clarity.
ملاحظات الأخبار
Ichamoku Cloud indicator addedملاحظات الأخبار
#Update with Support and ResistanceSupport--> Orange Colour
Resistance--> Aqua Colour
ملاحظات الأخبار
#update with support and resistance colourssupport in yellow colour
resistance in aqua colour
نص برمجي محمي
تم نشر هذا النص البرمجي كمصدر مغلق. ومع ذلك، يمكنك استخدامه بحرية ودون أي قيود - تعرف على المزيد هنا.
إخلاء المسؤولية
لا يُقصد بالمعلومات والمنشورات أن تكون، أو تشكل، أي نصيحة مالية أو استثمارية أو تجارية أو أنواع أخرى من النصائح أو التوصيات المقدمة أو المعتمدة من TradingView. اقرأ المزيد في شروط الاستخدام.