OPEN-SOURCE SCRIPT
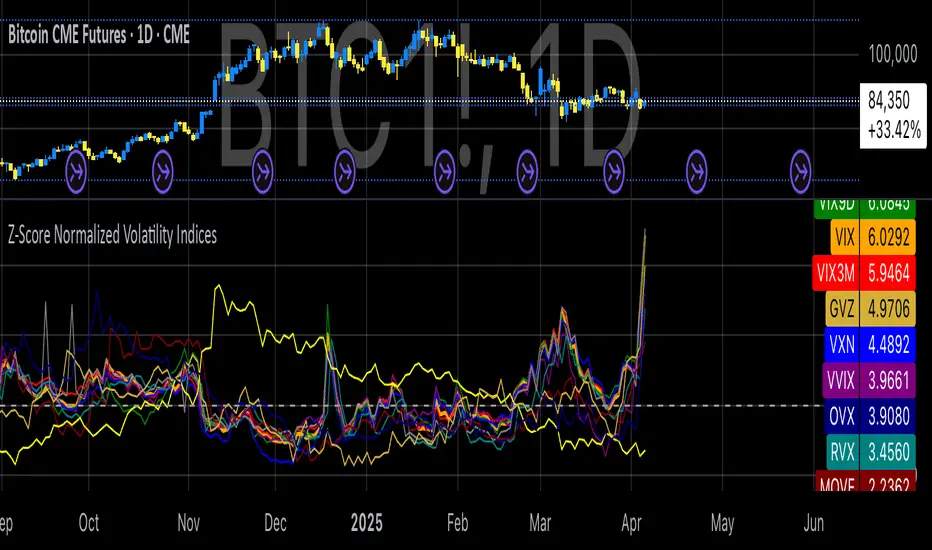
Z-Score Normalized Volatility Indices
Volatility is one of the most important measures in financial markets, reflecting the extent of variation in asset prices over time. It is commonly viewed as a risk indicator, with higher volatility signifying greater uncertainty and potential for price swings, which can affect investment decisions. Understanding volatility and its dynamics is crucial for risk management and forecasting in both traditional and alternative asset classes.
Z-Score Normalization in Volatility Analysis
The Z-score is a statistical tool that quantifies how many standard deviations a given data point is from the mean of the dataset. It is calculated as:
Z = \frac{X - \mu}{\sigma}
Where X is the value of the data point, \mu is the mean of the dataset, and \sigma is the standard deviation of the dataset. In the context of volatility indices, the Z-score allows for the normalization of these values, enabling their comparison regardless of the original scale. This is particularly useful when analyzing volatility across multiple assets or asset classes.
This script utilizes the Z-score to normalize various volatility indices:
1. VIX (CBOE Volatility Index): A widely used indicator that measures the implied volatility of S&P 500 options. It is considered a barometer of market fear and uncertainty (Whaley, 2000).
2. VIX3M: Represents the 3-month implied volatility of the S&P 500 options, providing insight into medium-term volatility expectations.
3. VIX9D: The implied volatility for a 9-day S&P 500 options contract, which reflects short-term volatility expectations.
4. VVIX: The volatility of the VIX itself, which measures the uncertainty in the expectations of future volatility.
5. VXN: The Nasdaq-100 volatility index, representing implied volatility in the Nasdaq-100 options.
6. RVX: The Russell 2000 volatility index, tracking the implied volatility of options on the Russell 2000 Index.
7. VXD: Volatility for the Dow Jones Industrial Average.
8. MOVE: The implied volatility index for U.S. Treasury bonds, offering insight into expectations for interest rate volatility.
9. BVIX: Volatility of Bitcoin options, a useful indicator for understanding the risk in the cryptocurrency market.
10. GVZ: Volatility index for gold futures, reflecting the risk perception of gold prices.
11. OVX: Measures implied volatility for crude oil futures.
Volatility Clustering and Z-Score
The concept of volatility clustering—where high volatility tends to be followed by more high volatility—is well documented in financial literature. This phenomenon is fundamental in volatility modeling and highlights the persistence of periods of heightened market uncertainty (Bollerslev, 1986).
Moreover, studies by Andersen et al. (2012) explore how implied volatility indices, like the VIX, serve as predictors for future realized volatility, underlining the relationship between expected volatility and actual market behavior. The Z-score normalization process helps in making volatility data comparable across different asset classes, enabling more effective decision-making in volatility-based strategies.
Applications in Trading and Risk Management
By using Z-score normalization, traders can more easily assess deviations from the mean in volatility, helping to identify periods when volatility is unusually high or low. This can be used to adjust risk exposure or to implement volatility-based trading strategies, such as mean reversion strategies. Research suggests that volatility mean-reversion is a reliable pattern that can be exploited for profit (Christensen & Prabhala, 1998).
References:
• Andersen, T. G., Bollerslev, T., Diebold, F. X., & Vega, C. (2012). Realized volatility and correlation dynamics: A long-run approach. Journal of Financial Economics, 104(3), 385-406.
• Bollerslev, T. (1986). Generalized autoregressive conditional heteroskedasticity. Journal of Econometrics, 31(3), 307-327.
• Christensen, B. J., & Prabhala, N. R. (1998). The relation between implied and realized volatility. Journal of Financial Economics, 50(2), 125-150.
• Whaley, R. E. (2000). Derivatives on market volatility and the VIX index. Journal of Derivatives, 8(1), 71-84.
نص برمجي مفتوح المصدر
بروح TradingView الحقيقية، قام مبتكر هذا النص البرمجي بجعله مفتوح المصدر، بحيث يمكن للمتداولين مراجعة وظائفه والتحقق منها. شكرا للمؤلف! بينما يمكنك استخدامه مجانًا، تذكر أن إعادة نشر الكود يخضع لقواعد الموقع الخاصة بنا.
Where others speculate, we systematize.
edgetools.org
edgetools.org
إخلاء المسؤولية
لا يُقصد بالمعلومات والمنشورات أن تكون، أو تشكل، أي نصيحة مالية أو استثمارية أو تجارية أو أنواع أخرى من النصائح أو التوصيات المقدمة أو المعتمدة من TradingView. اقرأ المزيد في شروط الاستخدام.