OPEN-SOURCE SCRIPT
Position calculator
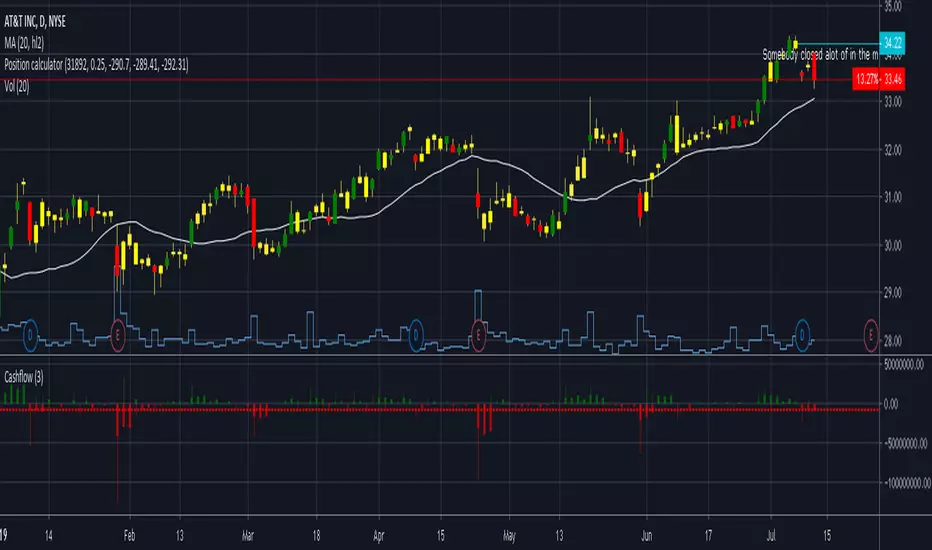
This position calculator can be used to see if the potential trade is a good one. Enter the values as inputs and the output will be listed next to the settings of the indicator. Nearest support/resistance is meant to be your price target. I have found running this analysis prior to a trade to be helpful. This will output number of shares to buy/sell based on your risk percent and then also give a potential profit factor. I wish the outputs in Tradingview were cleaner but this works for now. Let me know if you have any questions or suggestions. Happy trading!
نص برمجي مفتوح المصدر
بروح TradingView الحقيقية، قام مبتكر هذا النص البرمجي بجعله مفتوح المصدر، بحيث يمكن للمتداولين مراجعة وظائفه والتحقق منها. شكرا للمؤلف! بينما يمكنك استخدامه مجانًا، تذكر أن إعادة نشر الكود يخضع لقواعد الموقع الخاصة بنا.
إخلاء المسؤولية
لا يُقصد بالمعلومات والمنشورات أن تكون، أو تشكل، أي نصيحة مالية أو استثمارية أو تجارية أو أنواع أخرى من النصائح أو التوصيات المقدمة أو المعتمدة من TradingView. اقرأ المزيد في شروط الاستخدام.