OPEN-SOURCE SCRIPT
Average Range Convergence Divergence
Hi there,
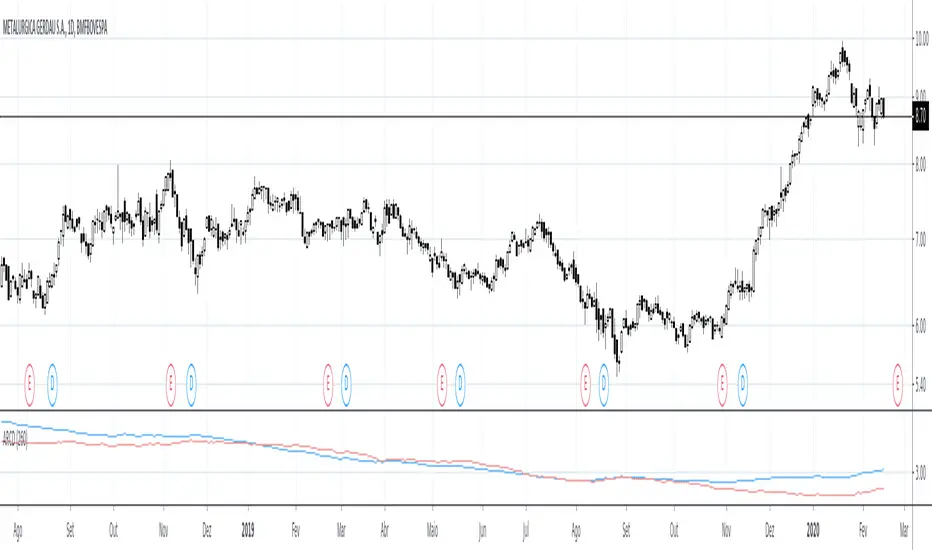
It's a script that plot the ATR (Average True Range) and ADR (Average Day Range) together and do an histogram of it. The histogram is the difference from ATR to ADR, I believe that it shows the average GAP in the asset. So I can easily found the offset to use when defining my stop.
PT
Esse script desenha o ATR (no profit True Range) e o ADR (media da diferença entre máximas e minimas) junto da diferença entre essas médias em formato de histograma. O gap médio de um ativo é mostrado no histograma.
نص برمجي مفتوح المصدر
بروح TradingView الحقيقية، قام مبتكر هذا النص البرمجي بجعله مفتوح المصدر، بحيث يمكن للمتداولين مراجعة وظائفه والتحقق منها. شكرا للمؤلف! بينما يمكنك استخدامه مجانًا، تذكر أن إعادة نشر الكود يخضع لقواعد الموقع الخاصة بنا.
إخلاء المسؤولية
لا يُقصد بالمعلومات والمنشورات أن تكون، أو تشكل، أي نصيحة مالية أو استثمارية أو تجارية أو أنواع أخرى من النصائح أو التوصيات المقدمة أو المعتمدة من TradingView. اقرأ المزيد في شروط الاستخدام.