OPEN-SOURCE SCRIPT
تم تحديثه Crypto/Stable Mcap Ratio Normalized
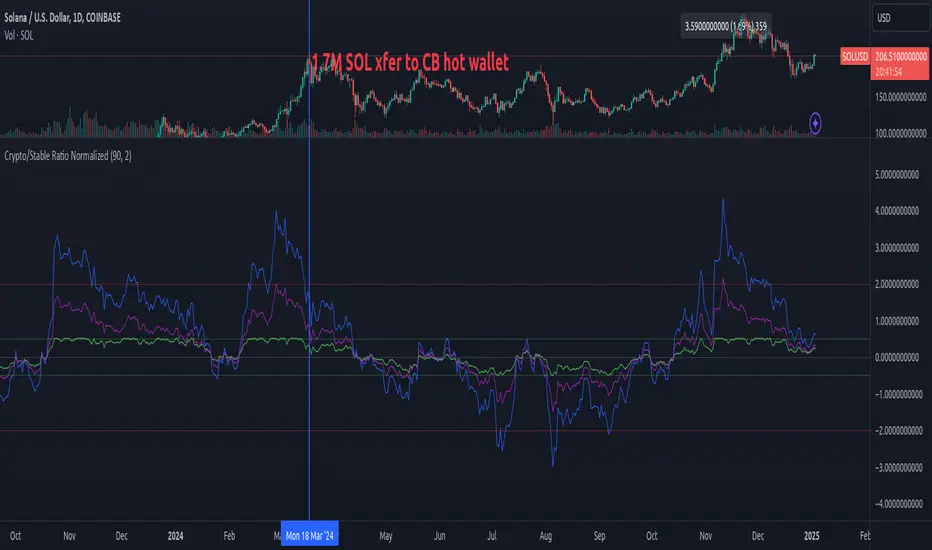
Create a normalized ratio of total crypto market cap to stablecoin supply (USDT + USDC + DAI). Idea is to create a reference point for the total market cap's position, relative to total "dollars" in the crypto ecosystem. It's an imperfect metric, but potentially helpful. V0.1.
This script provides four different normalization methods:
Z-Score Normalization:
Min-Max Normalization:
Percent of All-Time Range:
Bollinger Band Position:
Features:
This script provides four different normalization methods:
Z-Score Normalization:
- Shows how many standard deviations the ratio is from its mean
- Good for identifying extreme values
- Mean-reverting properties
Min-Max Normalization:
- Scales values between 0 and 1
- Good for relative position within recent range
- More sensitive to recent changes
Percent of All-Time Range:
- Shows where current ratio is relative to all-time highs/lows
- Good for historical context
- Less sensitive to recent changes
Bollinger Band Position:
- Similar to z-score but with adjustable sensitivity
- Good for trading signals
- Can be tuned via standard deviation multiplier
Features:
- Adjustable lookback period
- Reference bands for overbought/oversold levels
- Built-in alerts for extreme values
- Color-coded plots for easy visualization
ملاحظات الأخبار
Create a normalized ratio of total crypto market cap to stablecoin supply (USDT + USDC + DAI). Idea is to create a reference point for the total market cap's position, relative to total "dollars" in the crypto ecosystem. It's an imperfect metric, but potentially helpful. V0.1.This script provides four different normalization methods:
Z-Score Normalization:
- Shows how many standard deviations the ratio is from its mean
- Good for identifying extreme values
- Mean-reverting properties
Min-Max Normalization:
- Scales values between 0 and 1
- Good for relative position within recent range
- More sensitive to recent changes
Percent of All-Time Range:
- Shows where current ratio is relative to all-time highs/lows
- Good for historical context
- Less sensitive to recent changes
Bollinger Band Position:
- Similar to z-score but with adjustable sensitivity
- Good for trading signals
- Can be tuned via standard deviation multiplier
Features:
- Adjustable lookback period
- Reference bands for overbought/oversold levels
- Built-in alerts for extreme values
- Color-coded plots for easy visualization
نص برمجي مفتوح المصدر
بروح TradingView الحقيقية، قام مبتكر هذا النص البرمجي بجعله مفتوح المصدر، بحيث يمكن للمتداولين مراجعة وظائفه والتحقق منها. شكرا للمؤلف! بينما يمكنك استخدامه مجانًا، تذكر أن إعادة نشر الكود يخضع لقواعد الموقع الخاصة بنا.
إخلاء المسؤولية
لا يُقصد بالمعلومات والمنشورات أن تكون، أو تشكل، أي نصيحة مالية أو استثمارية أو تجارية أو أنواع أخرى من النصائح أو التوصيات المقدمة أو المعتمدة من TradingView. اقرأ المزيد في شروط الاستخدام.