OPEN-SOURCE SCRIPT
تم تحديثه Futures Correlation Visualizer

OVERVIEW
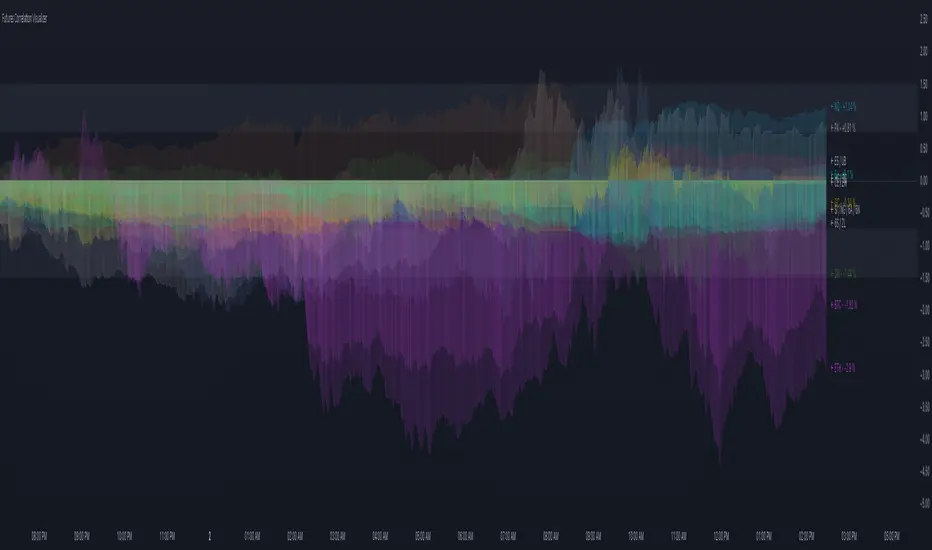
This indicator plots the normalized price changes of commonly traded futures. Visualizing data in this way makes studying and understanding market participation and sentiment easier.
Note:
Only 20 symbols can be plotted. The "request" functions are limited to 40 calls, 1 timeframe counts as a call, and 2 timeframes are used per symbol. Normalized values are derived by dividing the charts timeframe by 1D data. A runtime error will occur when more than 20 symbols are enabled. This limitation is unavoidable.
INPUTS
You can configure:
- Colors and color scheme
- Symbols to plot (most common futures)
- Norm. source (todays open / yesterdays close)
- Measurement type (%, ‱, Δ)
- Label, zone, and zero options
ملاحظات الأخبار
- Added link to indicator page the top of the code.
- Updated chart
ملاحظات الأخبار
- Minor code changes.
- Added "Smooth" option for color transitions.
- Converted to Pine Script v6
ملاحظات الأخبار
- Updated script to align with Pine Script changes: Pine Script recently updated when loop boundaries were checked. Previously, the boundary was established before iterating. Now, the boundary is evaluated on each iteration.
ملاحظات الأخبار
- Improved logic to be more reliable after partial trading days.
نص برمجي مفتوح المصدر
بروح TradingView الحقيقية، قام مبتكر هذا النص البرمجي بجعله مفتوح المصدر، بحيث يمكن للمتداولين مراجعة وظائفه والتحقق منها. شكرا للمؤلف! بينما يمكنك استخدامه مجانًا، تذكر أن إعادة نشر الكود يخضع لقواعد الموقع الخاصة بنا.
Discord: discord.gg/bPAPhwUeud
Website: liquid-trader.com
Website: liquid-trader.com
إخلاء المسؤولية
لا يُقصد بالمعلومات والمنشورات أن تكون، أو تشكل، أي نصيحة مالية أو استثمارية أو تجارية أو أنواع أخرى من النصائح أو التوصيات المقدمة أو المعتمدة من TradingView. اقرأ المزيد في شروط الاستخدام.