OPEN-SOURCE SCRIPT
تم تحديثه Adaptive LSMA Regression Oscillator
Overview:
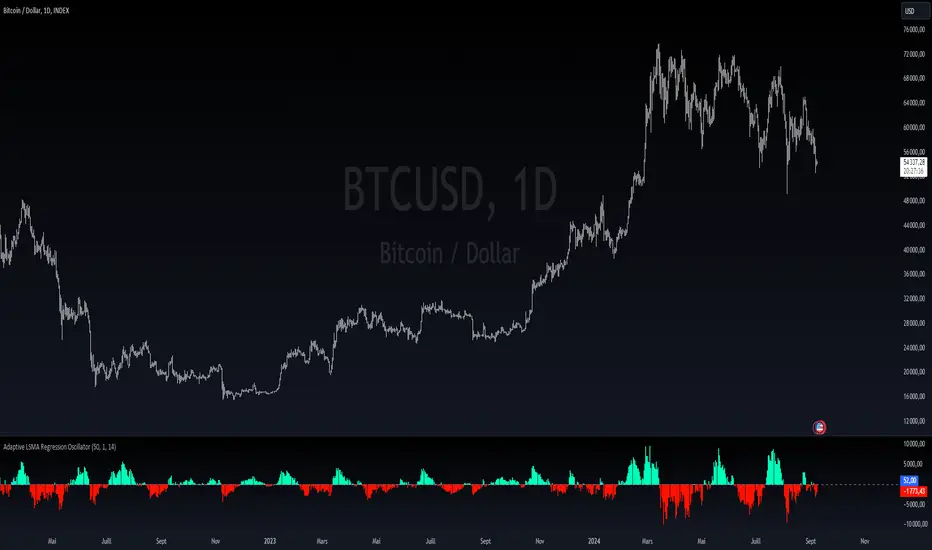
The Adaptive LSMA Regression Oscillator is an open-source technical analysis tool designed to reflect market price deviations from an adaptive least squares moving average (LSMA). The adaptive length of the LSMA changes dynamically based on the volatility of the market, making the indicator responsive to different market conditions.
Key Features:
Adaptive Length Adjustment: The base length of the LSMA is adjusted based on market volatility, measured by the Average True Range (ATR). The more volatile the market, the longer the adaptive length, and vice versa.
Oscillator: The indicator calculates the difference between the closing price and the adaptive LSMA. This difference is plotted as a histogram, showing whether prices are above or below the LSMA.
Color-Coded Histogram:
Positive values (where price is above the LSMA) are colored green.
Negative values (where price is below the LSMA) are colored red.
Debugging Information: The adaptive length is plotted for transparency, allowing users to see how the length changes based on the multiplier and ATR.
How It Works:
Inputs:
Base Length: This defines the starting length of the LSMA. It is adjusted based on market conditions.
Multiplier: A customizable multiplier is used to control how much the adaptive length responds to changes in volatility.
ATR Period: This determines the lookback period for the Average True Range calculation, a measure of market volatility.
Dynamic Adjustment:
The length of the LSMA is dynamically adjusted by multiplying the base length by a factor derived from ATR and the average close price.
This helps the indicator adapt to different market conditions, staying shorter during low volatility and longer during high volatility.
Example Use Cases:
Trend Analysis: By observing the oscillator, traders can see when prices deviate from a dynamically adjusted LSMA. This can be used to evaluate potential trend direction or changes in market behavior.
Volatility-Responsive Indicator: The adaptive length ensures that the indicator responds appropriately in both high and low volatility environments.
ملاحظات الأخبار
added the watermark in the code ملاحظات الأخبار
added watermark in code نص برمجي مفتوح المصدر
بروح TradingView الحقيقية، قام مبتكر هذا النص البرمجي بجعله مفتوح المصدر، بحيث يمكن للمتداولين مراجعة وظائفه والتحقق منها. شكرا للمؤلف! بينما يمكنك استخدامه مجانًا، تذكر أن إعادة نشر الكود يخضع لقواعد الموقع الخاصة بنا.
🚀 Elevate your edge with institutional-grade indicators & full trading systems.
🔗 Access tools: linktr.ee/0xKazo
🔗 Access tools: linktr.ee/0xKazo
إخلاء المسؤولية
لا يُقصد بالمعلومات والمنشورات أن تكون، أو تشكل، أي نصيحة مالية أو استثمارية أو تجارية أو أنواع أخرى من النصائح أو التوصيات المقدمة أو المعتمدة من TradingView. اقرأ المزيد في شروط الاستخدام.
نص برمجي مفتوح المصدر
بروح TradingView الحقيقية، قام مبتكر هذا النص البرمجي بجعله مفتوح المصدر، بحيث يمكن للمتداولين مراجعة وظائفه والتحقق منها. شكرا للمؤلف! بينما يمكنك استخدامه مجانًا، تذكر أن إعادة نشر الكود يخضع لقواعد الموقع الخاصة بنا.
🚀 Elevate your edge with institutional-grade indicators & full trading systems.
🔗 Access tools: linktr.ee/0xKazo
🔗 Access tools: linktr.ee/0xKazo
إخلاء المسؤولية
لا يُقصد بالمعلومات والمنشورات أن تكون، أو تشكل، أي نصيحة مالية أو استثمارية أو تجارية أو أنواع أخرى من النصائح أو التوصيات المقدمة أو المعتمدة من TradingView. اقرأ المزيد في شروط الاستخدام.