OPEN-SOURCE SCRIPT
تم تحديثه MTF Previous Open/Close/Range

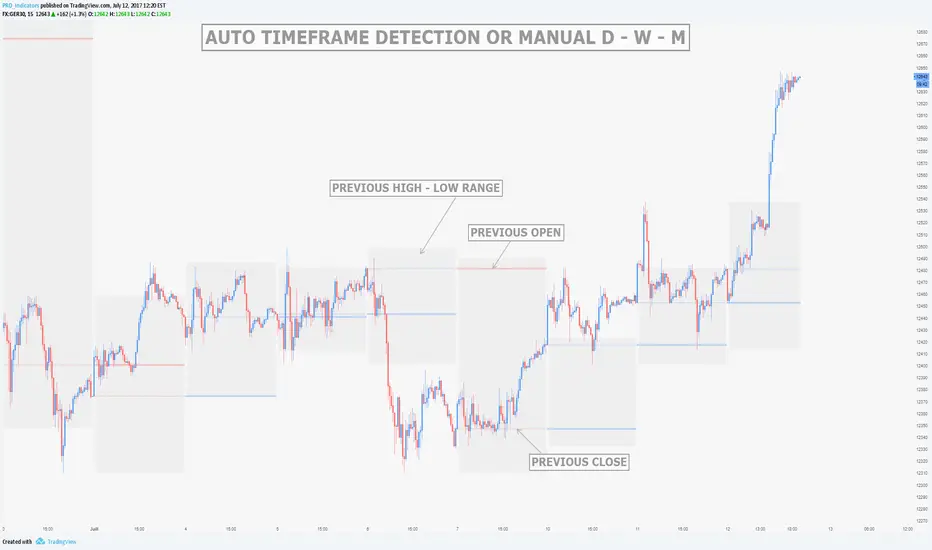
This indicator will simply plot on your chart the Daily/Weekly/Monthly previous candle levels.
The "Auto" mode will allow automatic adjustment of timeframe displayed according to your chart.
Otherwise you can select manually.
Indicator plots the open/close and colors the high-low range area in the background.
Hope this simple indicator will help you !
You can check my indicators via my TradingView's Profile : @PRO_Indicators
ملاحظات الأخبار
Added support for quarters and year timeframes. Added the optional plot of the 61% extension line (this extension generally acts like a support/resistance)
ملاحظات الأخبار
Added more timeframe options and a gap highlighting (can be desactivated)نص برمجي مفتوح المصدر
بروح TradingView الحقيقية، قام مبتكر هذا النص البرمجي بجعله مفتوح المصدر، بحيث يمكن للمتداولين مراجعة وظائفه والتحقق منها. شكرا للمؤلف! بينما يمكنك استخدامه مجانًا، تذكر أن إعادة نشر الكود يخضع لقواعد الموقع الخاصة بنا.
To learn more about the PRO Strategy and request a trial for the indicators:
Website : pro-indicators.com
Discord : discord.gg/2mHQbEmb9P
Website : pro-indicators.com
Discord : discord.gg/2mHQbEmb9P
إخلاء المسؤولية
لا يُقصد بالمعلومات والمنشورات أن تكون، أو تشكل، أي نصيحة مالية أو استثمارية أو تجارية أو أنواع أخرى من النصائح أو التوصيات المقدمة أو المعتمدة من TradingView. اقرأ المزيد في شروط الاستخدام.
نص برمجي مفتوح المصدر
بروح TradingView الحقيقية، قام مبتكر هذا النص البرمجي بجعله مفتوح المصدر، بحيث يمكن للمتداولين مراجعة وظائفه والتحقق منها. شكرا للمؤلف! بينما يمكنك استخدامه مجانًا، تذكر أن إعادة نشر الكود يخضع لقواعد الموقع الخاصة بنا.
To learn more about the PRO Strategy and request a trial for the indicators:
Website : pro-indicators.com
Discord : discord.gg/2mHQbEmb9P
Website : pro-indicators.com
Discord : discord.gg/2mHQbEmb9P
إخلاء المسؤولية
لا يُقصد بالمعلومات والمنشورات أن تكون، أو تشكل، أي نصيحة مالية أو استثمارية أو تجارية أو أنواع أخرى من النصائح أو التوصيات المقدمة أو المعتمدة من TradingView. اقرأ المزيد في شروط الاستخدام.