OPEN-SOURCE SCRIPT
Drawing tool
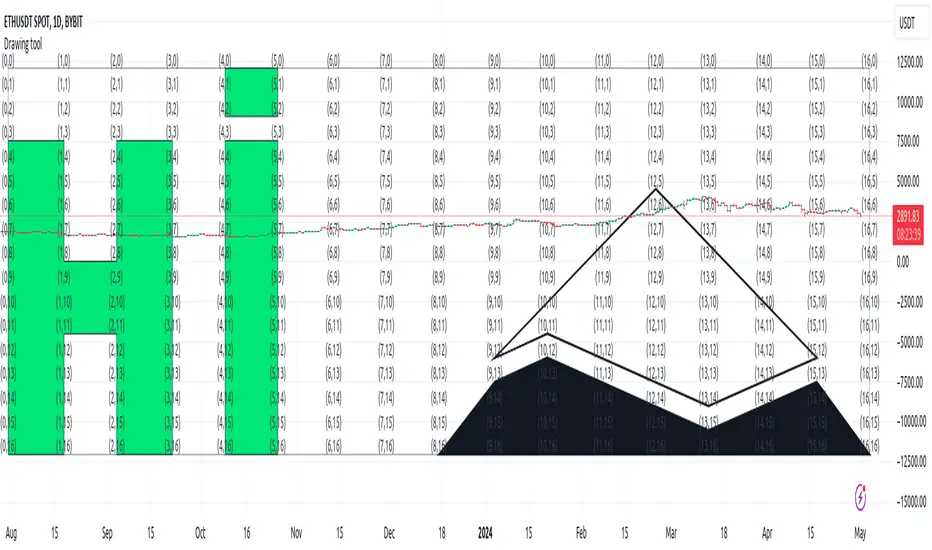
This indicator is a simple drawing tool without changing the code!
You need:
1. activate the display of coordinates (Show coordinate input)
You will see a 17 by 17 table with indexes of intersection points, in the format: (x,y)
2. activate the Enable custom drawing input
3. enter the sequence of points that you want to connect into the Coordinate for drawing input in the format: (x,y);(x,y)....
4. select line color and fill color
5. if necessary, activate Curved and Closed
In addition, you can look at some examples
نص برمجي مفتوح المصدر
بروح TradingView الحقيقية، قام مبتكر هذا النص البرمجي بجعله مفتوح المصدر، بحيث يمكن للمتداولين مراجعة وظائفه والتحقق منها. شكرا للمؤلف! بينما يمكنك استخدامه مجانًا، تذكر أن إعادة نشر الكود يخضع لقواعد الموقع الخاصة بنا.
إخلاء المسؤولية
لا يُقصد بالمعلومات والمنشورات أن تكون، أو تشكل، أي نصيحة مالية أو استثمارية أو تجارية أو أنواع أخرى من النصائح أو التوصيات المقدمة أو المعتمدة من TradingView. اقرأ المزيد في شروط الاستخدام.