PROTECTED SOURCE SCRIPT
[DEM] Donchian Cloud
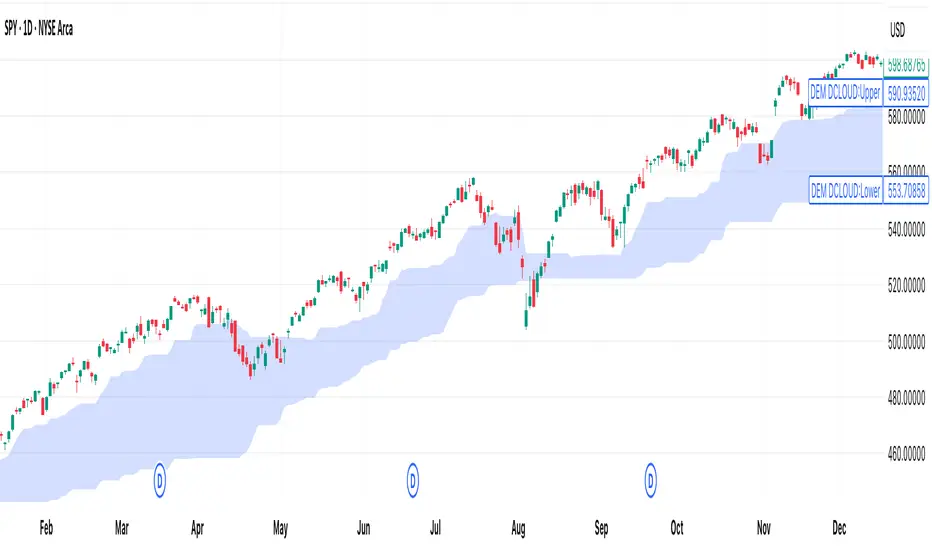
[DEM] Donchian Cloud is designed to create a visual cloud overlay on the price chart using two Donchian Channel midlines of different periods (26 and 117 bars) to identify trend direction and potential support/resistance zones. The indicator calculates the average of the highest high and lowest low for each period, plots these as nearly transparent blue lines, and fills the area between them with a color-coded cloud that changes from blue to red when the longer-period midline (117) crosses above the shorter-period midline (26), indicating a potential bearish shift in the longer-term trend. This cloud system helps traders visualize the relationship between short-term and long-term price equilibrium levels, with the cloud color providing a quick reference for overall trend bias and the cloud boundaries offering dynamic support and resistance levels.
نص برمجي محمي
تم نشر هذا النص البرمجي كمصدر مغلق. ومع ذلك، يمكنك استخدامه بحرية ودون أي قيود - تعرف على المزيد هنا.
إخلاء المسؤولية
لا يُقصد بالمعلومات والمنشورات أن تكون، أو تشكل، أي نصيحة مالية أو استثمارية أو تجارية أو أنواع أخرى من النصائح أو التوصيات المقدمة أو المعتمدة من TradingView. اقرأ المزيد في شروط الاستخدام.