OPEN-SOURCE SCRIPT
تم تحديثه 1A Monthly P&L Table - Using Library
1A Monthly P&L Table: Track Your Performance Month-by-Month
Overview:
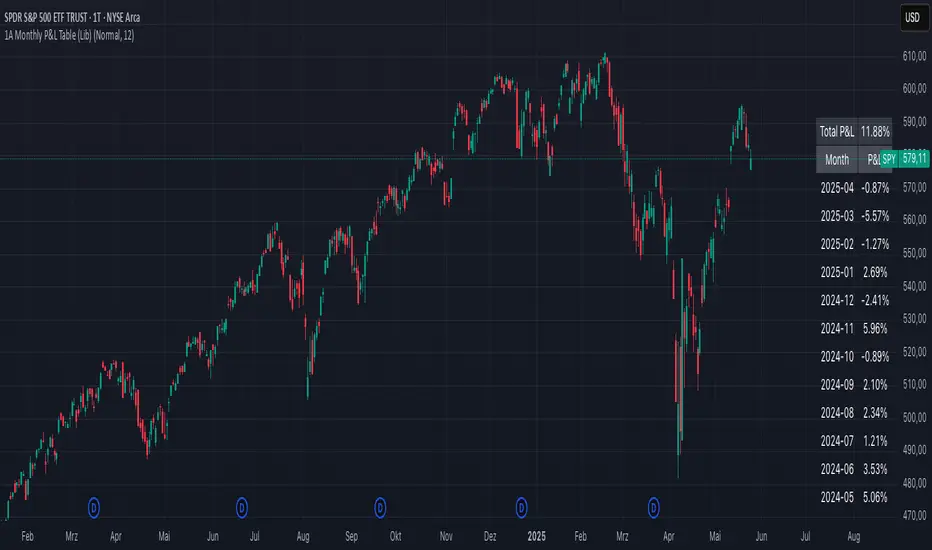
The 1A Monthly P&L Table is a straightforward yet powerful indicator designed to give you an immediate overview of your asset's (or strategy's) percentage performance on a monthly basis. Displayed conveniently in the bottom-right corner of your chart, this tool helps you quickly assess historical gains and losses, making it easier to analyze trends in performance over time.
Key Features:
How It Works:
The indicator calculates the percentage change from the close of the previous month to the close of the current month. For the very first month displayed, it calculates the P&L from the opening price of the chart's first bar to the close of that month. This data is then neatly organized into a table, updated on the last bar of the day or session.
Ideal For:
Settings:
Overview:
The 1A Monthly P&L Table is a straightforward yet powerful indicator designed to give you an immediate overview of your asset's (or strategy's) percentage performance on a monthly basis. Displayed conveniently in the bottom-right corner of your chart, this tool helps you quickly assess historical gains and losses, making it easier to analyze trends in performance over time.
Key Features:
- [] Monthly Performance at a Glance: Clearly see the percentage change for each past month.
[] Cumulative P&L: A running total of the displayed monthly P&L is provided, giving you a quick sum of performance over the selected period.
[] Customizable Display:[] Months to Display: Choose how many past months you want to see in the table (from 1 to 60 months).
[] Text Size: Adjust the text size (Tiny, Small, Normal, Large, Huge) to fit your viewing preferences.
[] Text Color: Customize the color of the text for better visibility against your chart background. - Intraday & Daily Compatibility: The table is optimized to display on daily and intraday timeframes, ensuring it's relevant for various trading styles. (Note: For very long-term analysis on weekly/monthly charts, you might consider other tools, as this focuses on granular monthly P&L.)
How It Works:
The indicator calculates the percentage change from the close of the previous month to the close of the current month. For the very first month displayed, it calculates the P&L from the opening price of the chart's first bar to the close of that month. This data is then neatly organized into a table, updated on the last bar of the day or session.
Ideal For:
- [] Traders and investors who want a quick, visual summary of monthly performance.
[] Analyzing seasonal trends or consistent periods of profitability/drawdown. - Supplementing backtesting results with a clear month-by-month breakdown.
Settings:
- [] Text Color: Changes the color of all text within the table.
[] Text Size: Controls the font size of the table content. - Months to Display: Determines the number of recent months included in the table.
ملاحظات الأخبار
1A Monthly P&L Table: Track Security Performance Month-by-MonthOverview:
The 1A Monthly P&L Table is a straightforward yet powerful indicator / table designed to give you an immediate overview of the chart securities percentage performance on a monthly basis. Displayed conveniently in the bottom-right corner of your chart, this tool helps you quickly assess historical gains and losses, making it easier to analyze trends in performance over time.
Key Features:
- Monthly Performance at a Glance: Clearly see the percentage change for each past month.
- Cumulative P&L: A running total of the displayed monthly P&L is provided, giving you a quick sum of performance over the selected period.
[] Customizable Display:Months to Display: Choose how many past months you want to see in the table (from 1 to 36 months).
Text Size: Adjust the text size (Tiny, Small, Normal, Large, Huge) to fit your viewing preferences.
[] Text Color: Customize the color of the text for better visibility against your chart background. - Intraday & Daily Compatibility: The table is optimized to display on daily and intraday timeframes, ensuring it's relevant for various trading styles. (Note: For very long-term analysis on weekly/monthly charts, you might consider other tools, as this focuses on granular monthly P&L.)
How It Works:
The indicator calculates the percentage change from the close of the previous month to the close of the current month. For the very first month displayed, it calculates the P&L from the opening price of the chart's first bar to the close of that month. This data is then neatly organized into a table, updated on the last bar of the day or session.
Ideal For:
- Traders and investors who want a quick, visual summary of monthly performance.
- Analyzing seasonal trends or consistent periods of profitability.
Settings:
- Text Color: Changes the color of all text within the table.
- Text Size: Controls the font size of the table content.
- Months to Display: Determines the number of recent months included in the table.
نص برمجي مفتوح المصدر
بروح TradingView الحقيقية، قام مبتكر هذا النص البرمجي بجعله مفتوح المصدر، بحيث يمكن للمتداولين مراجعة وظائفه والتحقق منها. شكرا للمؤلف! بينما يمكنك استخدامه مجانًا، تذكر أن إعادة نشر الكود يخضع لقواعد الموقع الخاصة بنا.
إخلاء المسؤولية
لا يُقصد بالمعلومات والمنشورات أن تكون، أو تشكل، أي نصيحة مالية أو استثمارية أو تجارية أو أنواع أخرى من النصائح أو التوصيات المقدمة أو المعتمدة من TradingView. اقرأ المزيد في شروط الاستخدام.