OPEN-SOURCE SCRIPT
Climax Detector (Buy & Sell)
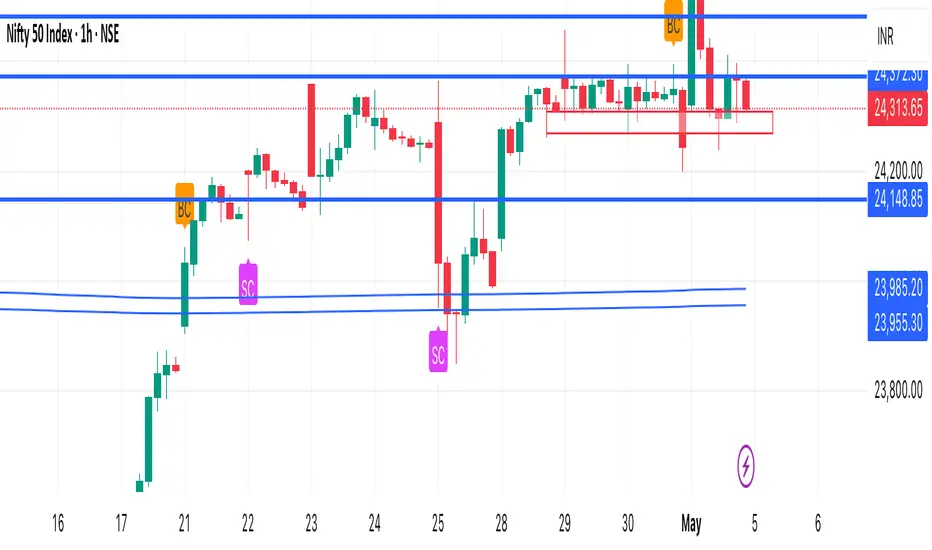
This indicator identifies potential Buying Climax (BC) and Selling Climax (SC) events based on volume spikes relative to historical averages.
• Buying Climax (BC):
• Detected when a green candle forms with volume significantly higher than the average (default: 2×).
• Often signals the end of an uptrend or distribution phase.
• Selling Climax (SC):
• Detected when a red candle forms with very high volume (default: 2× average).
• Often occurs at the end of a downtrend, suggesting panic selling and potential accumulation.
How it works:
• Calculates a moving average of volume over a user-defined period (default: 20 candles)
• Flags a climax when current volume exceeds the defined multiplier (default: 2.0×)
• Marks:
• BC with an orange triangle above the bar
• SC with a fuchsia triangle below the bar
Customizable Settings:
• Volume spike sensitivity
• Lookback period for average volume
Use Cases:
• Spot possible trend exhaustion
• Confirm Wyckoff phases
• Combine with support/resistance for reversal entries
Disclaimer: This tool is designed to assist in identifying high-probability exhaustion zones but should be used alongside other confirmations or strategies.
نص برمجي مفتوح المصدر
بروح TradingView الحقيقية، قام مبتكر هذا النص البرمجي بجعله مفتوح المصدر، بحيث يمكن للمتداولين مراجعة وظائفه والتحقق منها. شكرا للمؤلف! بينما يمكنك استخدامه مجانًا، تذكر أن إعادة نشر الكود يخضع لقواعد الموقع الخاصة بنا.
إخلاء المسؤولية
لا يُقصد بالمعلومات والمنشورات أن تكون، أو تشكل، أي نصيحة مالية أو استثمارية أو تجارية أو أنواع أخرى من النصائح أو التوصيات المقدمة أو المعتمدة من TradingView. اقرأ المزيد في شروط الاستخدام.