RicardoSantos

[RS]RSI Mirrors V2

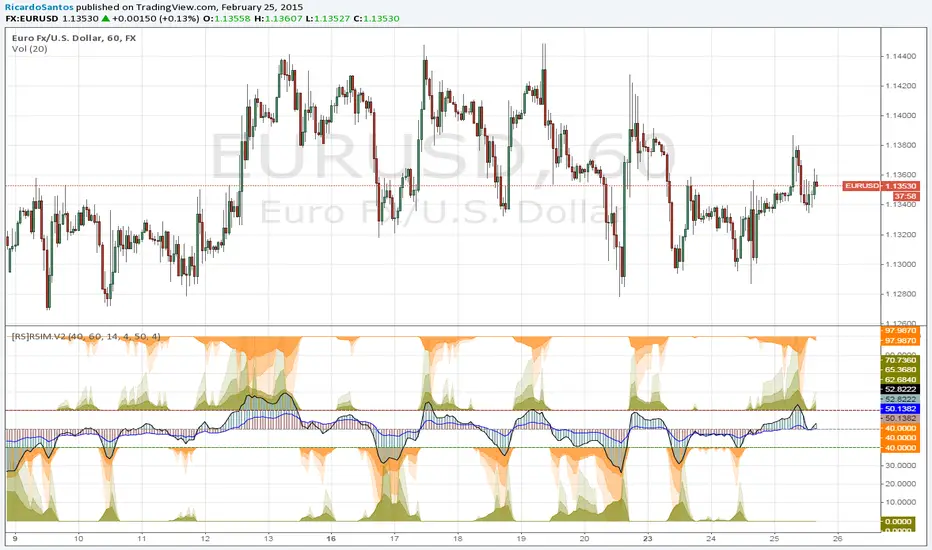
EXPERIMENTAL: Updated version with smoothing options for the rsi's.
نص برمجي مفتوح المصدر

قام مؤلف هذا النص البرمجي بنشره وجعله مفتوح المصدر، بحيث يمكن للمتداولين فهمه والتحقق منه، وهو الأمر الذي يدخل ضمن قيم TradingView. تحياتنا للمؤلف! يمكنك استخدامه مجانًا، ولكن إعادة استخدام هذا الكود في منشور تحكمه قواعد الموقع. يمكنك جعله مفضلاً لاستخدامه على الرسم البياني.

إخلاء المسؤولية

لا يُقصد بالمعلومات والمنشورات أن تكون، أو تشكل، أي نصيحة مالية أو استثمارية أو تجارية أو أنواع أخرى من النصائح أو التوصيات المقدمة أو المعتمدة من TradingView. اقرأ المزيد في شروط الاستخدام.

هل تريد استخدام هذا النص البرمجي على الرسم البياني؟
study(title="[RS]RSI Mirrors V2", shorttitle="[RS]RSIM.V2", overlay=false)

buylimit = input(40)
selllimit = input(60)

source = close

rsi1 = sma(rsi(source, input(14, title="Fast RSI Length")), input(4, title="Fast RSI MA Smooth"))
rsi2 = sma(rsi(source, input(50, title="Slow RSI Length")), input(4, title="Slow RSI MA Smooth"))
//  ||---
excess = rsi2-rsi1
posexcess = excess > 0 ? buylimit-excess : buylimit
negexcess = excess < 0 ? selllimit-excess : selllimit

posexcess1 = excess > 0 ? rising(excess, 1) ? buylimit-excess*2 : buylimit-excess*0.75 : buylimit
negexcess1 = excess < 0 ? falling(excess, 1) ? selllimit-excess*2 : selllimit-excess*0.75 : selllimit
posexcess2 = excess > 0 ? rising(excess, 1) ? buylimit-excess*4 : buylimit-excess*0.75 : buylimit
negexcess2 = excess < 0 ? falling(excess, 1) ? selllimit-excess*4 : selllimit-excess*0.75 : selllimit

posfilter = posexcess < 0 ? 0 : posexcess
posfilter1 = posexcess1 < 0 ? 0 : posexcess1
posfilter2 = posexcess2 < 0 ? 0 : posexcess2
negfilter = negexcess > 100 ? 100 : negexcess
negfilter1 = negexcess1 > 100 ? 100 : negexcess1
negfilter2 = negexcess2 > 100 ? 100 : negexcess2

plot(posfilter, style=area, color=orange, transp=55, histbase=buylimit)
plot(negfilter, style=area, color=olive, transp=55, histbase=selllimit)
plot(posfilter1, style=area, color=orange, transp=70, histbase=buylimit)
plot(negfilter1, style=area, color=olive, transp=70, histbase=selllimit)
plot(posfilter2, style=area, color=orange, transp=85, histbase=buylimit)
plot(negfilter2, style=area, color=olive, transp=85, histbase=selllimit)
//  ||---   Mirroring
posmirror = excess > 0 ? rising(excess, 1) ? 0+excess*0.75 : 0+excess*1 : 0
posmirror1 = excess > 0 ? rising(excess, 1) ? 0+excess*0.75 : 0+excess*2 : 0
posmirror2 = excess > 0 ? rising(excess, 1) ? 0+excess*0.75 : 0+excess*4 : 0
negmirror = excess < 0 ? falling(excess, 1) ? 100+excess*0.75 : 100+excess : 100
negmirror1 = excess < 0 ? falling(excess, 1) ? 100+excess*0.75 : 100+excess*2 : 100
negmirror2 = excess < 0 ? falling(excess, 1) ? 100+excess*0.75 : 100+excess*4 : 100

posmfilter = posmirror > buylimit ? buylimit : posmirror
posmfilter1 = posmirror1 > buylimit ? buylimit : posmirror1
posmfilter2 = posmirror2 > buylimit ? buylimit : posmirror2
negmfilter = negmirror < selllimit ? selllimit : negmirror
negmfilter1 = negmirror1 < selllimit ? selllimit : negmirror1
negmfilter2 = negmirror2 < selllimit ? selllimit : negmirror2

plot(posmfilter, style=area, color=olive, transp=55, histbase=0)
plot(negmfilter, style=area, color=orange, transp=55, histbase=100)
plot(posmfilter1, style=area, color=olive, transp=70, histbase=0)
plot(negmfilter1, style=area, color=orange, transp=70, histbase=100)
plot(posmfilter2, style=area, color=olive, transp=85, histbase=0)
plot(negmfilter2, style=area, color=orange, transp=85, histbase=100)

//  ||---   Outputs
//  ||---   This need to be last to show on top.
plot(rsi1, color=#98b8be, style=histogram, linewidth=2, histbase=50)
plot(rsi2, color=#be9e98, style=histogram, linewidth=2, histbase=50)

plot(rsi1, color=black, style=line, linewidth=1)
plot(rsi2, color=blue, style=line, linewidth=1)

hline(buylimit, color=green)
hline(selllimit, color=maroon)
hline(50)