OPEN-SOURCE SCRIPT
Moving average of 1-period Percent Change
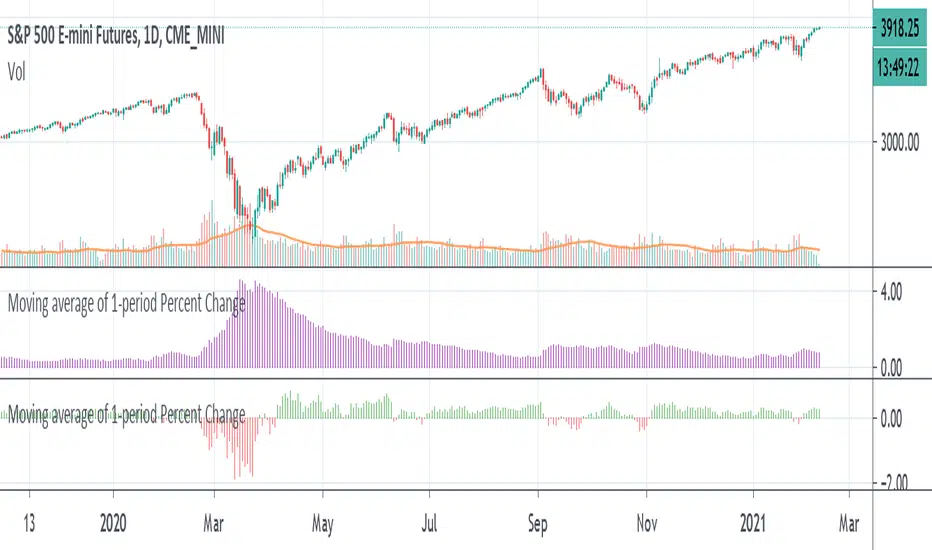
Another way of finding the average range of the bars using 1 period percentage change of the price and taking an average of them. It's given in percentages and the absolute value of the average can be shown when the option is turned on, or the average including the up and down bars can be shown. Perhaps an alternative way of looking at volatility or range of the bars. If you prefer a line version over histogram, just simply change the style under the settings of the indicator.
نص برمجي مفتوح المصدر
بروح TradingView الحقيقية، قام مبتكر هذا النص البرمجي بجعله مفتوح المصدر، بحيث يمكن للمتداولين مراجعة وظائفه والتحقق منها. شكرا للمؤلف! بينما يمكنك استخدامه مجانًا، تذكر أن إعادة نشر الكود يخضع لقواعد الموقع الخاصة بنا.
إخلاء المسؤولية
لا يُقصد بالمعلومات والمنشورات أن تكون، أو تشكل، أي نصيحة مالية أو استثمارية أو تجارية أو أنواع أخرى من النصائح أو التوصيات المقدمة أو المعتمدة من TradingView. اقرأ المزيد في شروط الاستخدام.