OPEN-SOURCE SCRIPT
تم تحديثه Awesome Oscillator with Divergence
Simple Awesome Oscillator with Divergences
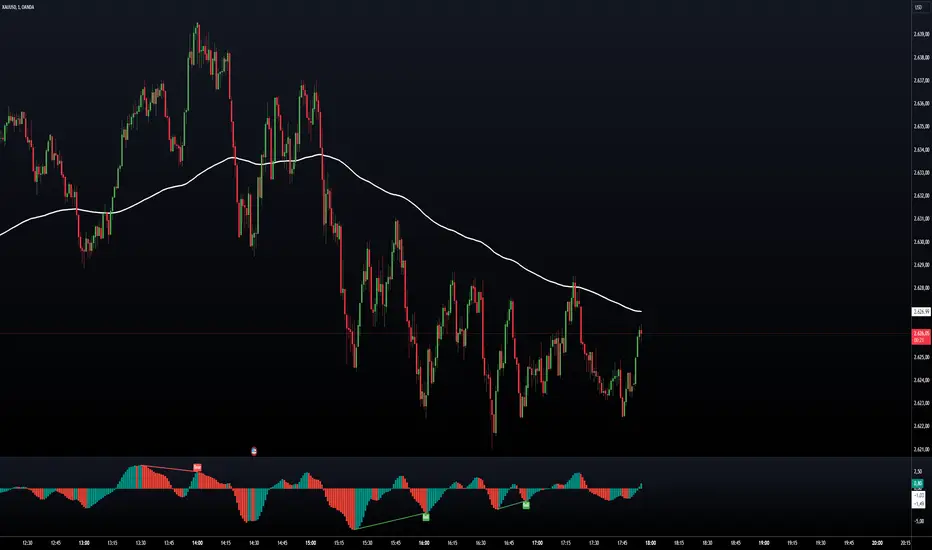
This TradingView script combines the classic Awesome Oscillator (AO) with divergence detection. It plots AO as a histogram, highlighting changes in momentum. Divergences are identified based on pivot highs and lows, signaling potential trend reversals:
- Bullish Divergence: Price makes lower lows, AO makes higher lows.
- Bearish Divergence: Price makes higher highs, AO makes lower highs.
Visual signals (arrows) and alerts ensure clear identification, making it ideal for traders focusing on momentum and trend reversals.
ملاحظات الأخبار
Now the indicator has:Customizable inputs for:
- AO periods (Fast/Slow)
- Choice between Ema and SMA for the calculation of the AO
- Lookback for pivot (right/left)
- Minimum range/maximum for divergence
- Activation/deactivation of any type of divergence (regular/hidden, bullish/bearyish)
- Hidden divergences (Hidden Bullish and Hidden Bearish) with label and dedicated colors
- Alert Condition for each type of divergence
How to use new inputs
- You can choose whether to use Ema (faster) or SMA (slower) for the AO.
- You can activate/deactivate the display of any type of divergence.
- You can adjust the lookback and range parameters directly from the input panel of the indicator.
What changes compared to before
The indicator is now much more flexible and powerful, identical as logic to that "for ideas", but with modern syntax and the possibility to choose between SMA/Ema.
You can adapt the sensitivity and type of signals according to your operational preferences.
ملاحظات الأخبار
Update: The indicator has been downgraded to version 5 because with TradingView's display.pane feature the indicator is inaccurate and was missing important divergences.نص برمجي مفتوح المصدر
بروح TradingView الحقيقية، قام مبتكر هذا النص البرمجي بجعله مفتوح المصدر، بحيث يمكن للمتداولين مراجعة وظائفه والتحقق منها. شكرا للمؤلف! بينما يمكنك استخدامه مجانًا، تذكر أن إعادة نشر الكود يخضع لقواعد الموقع الخاصة بنا.
إخلاء المسؤولية
لا يُقصد بالمعلومات والمنشورات أن تكون، أو تشكل، أي نصيحة مالية أو استثمارية أو تجارية أو أنواع أخرى من النصائح أو التوصيات المقدمة أو المعتمدة من TradingView. اقرأ المزيد في شروط الاستخدام.
نص برمجي مفتوح المصدر
بروح TradingView الحقيقية، قام مبتكر هذا النص البرمجي بجعله مفتوح المصدر، بحيث يمكن للمتداولين مراجعة وظائفه والتحقق منها. شكرا للمؤلف! بينما يمكنك استخدامه مجانًا، تذكر أن إعادة نشر الكود يخضع لقواعد الموقع الخاصة بنا.
إخلاء المسؤولية
لا يُقصد بالمعلومات والمنشورات أن تكون، أو تشكل، أي نصيحة مالية أو استثمارية أو تجارية أو أنواع أخرى من النصائح أو التوصيات المقدمة أو المعتمدة من TradingView. اقرأ المزيد في شروط الاستخدام.