OPEN-SOURCE SCRIPT
تم تحديثه Diagonal Support and Resistance Trend Lines
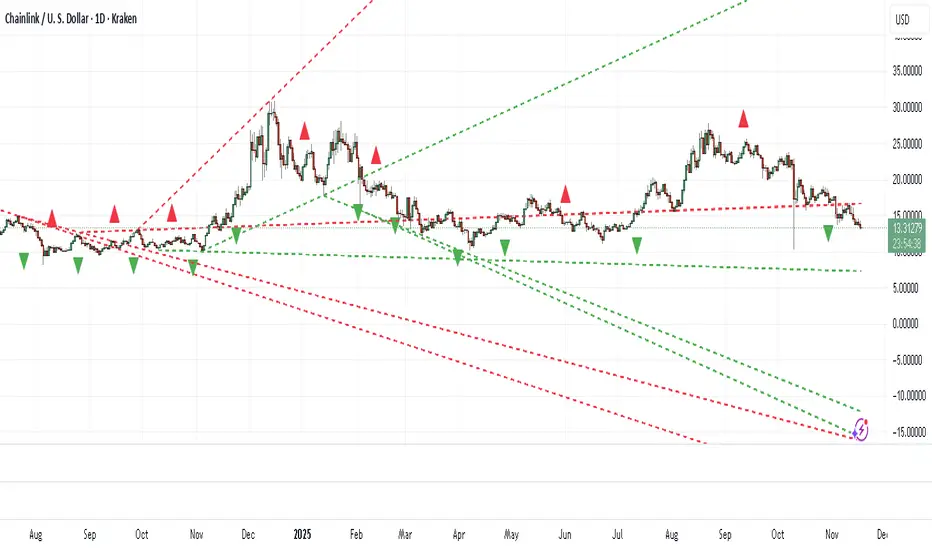
A simple indicator to plot trend lines.
1. Adjust the "Pivot Lookback" (default: 20) to control pivot sensitivity. Larger values detect more significant pivots.
2. Adjust the "Max Trend Lines" (default: 4) to control how many support/resistance lines are drawn.
The indicator will plot:
1. Red dashed lines for resistance (based on pivot highs).
2. Green dashed lines for support (based on pivot lows).
3. Small red triangles above bars for pivot highs and green triangles below bars for pivot lows.
ملاحظات الأخبار
Updated to v6 and added option to display dotted, dash, or solid lines.ملاحظات الأخبار
Editملاحظات الأخبار
You can now set the thickness of trend line.نص برمجي مفتوح المصدر
بروح TradingView الحقيقية، قام مبتكر هذا النص البرمجي بجعله مفتوح المصدر، بحيث يمكن للمتداولين مراجعة وظائفه والتحقق منها. شكرا للمؤلف! بينما يمكنك استخدامه مجانًا، تذكر أن إعادة نشر الكود يخضع لقواعد الموقع الخاصة بنا.
إخلاء المسؤولية
لا يُقصد بالمعلومات والمنشورات أن تكون، أو تشكل، أي نصيحة مالية أو استثمارية أو تجارية أو أنواع أخرى من النصائح أو التوصيات المقدمة أو المعتمدة من TradingView. اقرأ المزيد في شروط الاستخدام.
نص برمجي مفتوح المصدر
بروح TradingView الحقيقية، قام مبتكر هذا النص البرمجي بجعله مفتوح المصدر، بحيث يمكن للمتداولين مراجعة وظائفه والتحقق منها. شكرا للمؤلف! بينما يمكنك استخدامه مجانًا، تذكر أن إعادة نشر الكود يخضع لقواعد الموقع الخاصة بنا.
إخلاء المسؤولية
لا يُقصد بالمعلومات والمنشورات أن تكون، أو تشكل، أي نصيحة مالية أو استثمارية أو تجارية أو أنواع أخرى من النصائح أو التوصيات المقدمة أو المعتمدة من TradingView. اقرأ المزيد في شروط الاستخدام.