PROTECTED SOURCE SCRIPT
Volatility Rank Dashboard
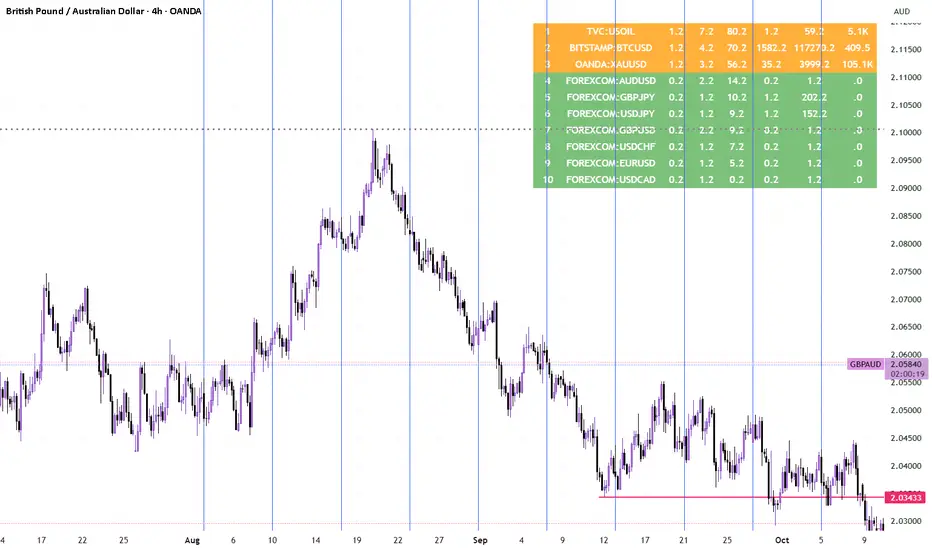
A dynamic multi-symbol dashboard that ranks assets live by their normalized volatility across multiple dimensions.
How it works:
The script scans up to 40 symbols (per TradingView request limits), calculating for each:
ATR% – average true range as a percentage of price (true volatility)
BB Width% – Bollinger Band width as relative spread (market compression/expansion)
Volume or Notional – filters or weights activity by liquidity
A composite volatility score is computed using adjustable weights (ATR%, BB%, Volume).
Symbols are ranked in real time on a color-coded table, highlighting the most volatile and active markets.
Extra features:
Session filter (London, New York, or custom trading hours)
Alerts for ATR% / BB% threshold cross or when a new #1 appears
Automatic 40-request safety management
Adaptive color heat map for instant visual comparison
Use it to quickly identify which assets are moving, liquid, and worth your attention — across any asset class or timeframe.
نص برمجي محمي
تم نشر هذا النص البرمجي كمصدر مغلق. ومع ذلك، يمكنك استخدامه بحرية ودون أي قيود - تعرف على المزيد هنا.
إخلاء المسؤولية
لا يُقصد بالمعلومات والمنشورات أن تكون، أو تشكل، أي نصيحة مالية أو استثمارية أو تجارية أو أنواع أخرى من النصائح أو التوصيات المقدمة أو المعتمدة من TradingView. اقرأ المزيد في شروط الاستخدام.