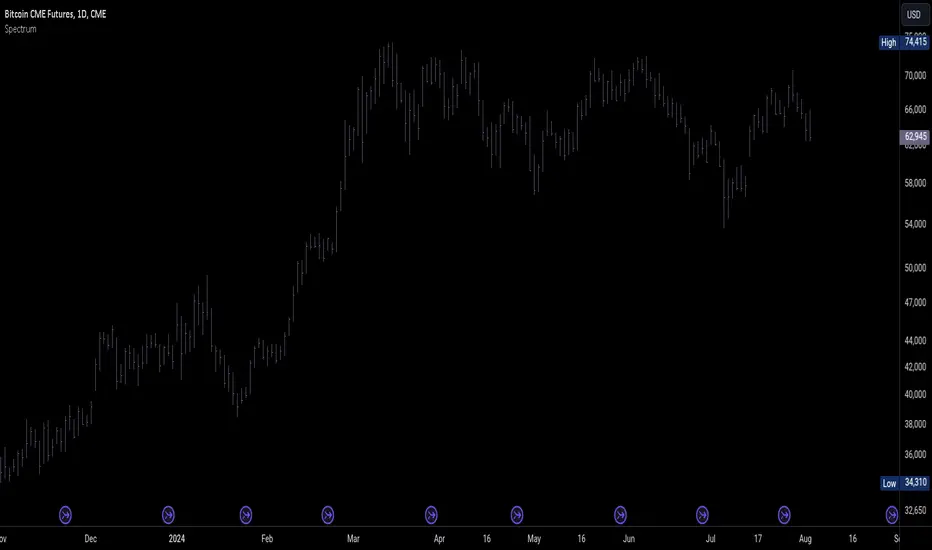
SpectrumLibrary "Spectrum"
This library includes spectrum analysis tools such as the Fast Fourier Transform (FFT).
method toComplex(data, polar)
Creates an array of complex type objects from a float type array.
Namespace types: array
Parameters:
data (array) : The float type array of input data.
polar (bool) : Initialization coordinates; the default is false (cartesian).
Returns: The complex type array of converted data.
method sAdd(data, value, end, start, step)
Performs scalar addition of a given float type array and a simple float value.
Namespace types: array
Parameters:
data (array) : The float type array of input data.
value (float) : The simple float type value to be added.
end (int) : The last index of the input array (exclusive) on which the operation is performed.
start (int) : The first index of the input array (inclusive) on which the operation is performed; the default value is 0.
step (int) : The step by which the function iterates over the input data array between the specified boundaries; the default value is 1.
Returns: The modified input array.
method sMult(data, value, end, start, step)
Performs scalar multiplication of a given float type array and a simple float value.
Namespace types: array
Parameters:
data (array) : The float type array of input data.
value (float) : The simple float type value to be added.
end (int) : The last index of the input array (exclusive) on which the operation is performed.
start (int) : The first index of the input array (inclusive) on which the operation is performed; the default value is 0.
step (int) : The step by which the function iterates over the input data array between the specified boundaries; the default value is 1.
Returns: The modified input array.
method eMult(data, data02, end, start, step)
Performs elementwise multiplication of two given complex type arrays.
Namespace types: array
Parameters:
data (array type from RezzaHmt/Complex/1) : the first complex type array of input data.
data02 (array type from RezzaHmt/Complex/1) : The second complex type array of input data.
end (int) : The last index of the input arrays (exclusive) on which the operation is performed.
start (int) : The first index of the input arrays (inclusive) on which the operation is performed; the default value is 0.
step (int) : The step by which the function iterates over the input data array between the specified boundaries; the default value is 1.
Returns: The modified first input array.
method eCon(data, end, start, step)
Performs elementwise conjugation on a given complex type array.
Namespace types: array
Parameters:
data (array type from RezzaHmt/Complex/1) : The complex type array of input data.
end (int) : The last index of the input array (exclusive) on which the operation is performed.
start (int) : The first index of the input array (inclusive) on which the operation is performed; the default value is 0.
step (int) : The step by which the function iterates over the input data array between the specified boundaries; the default value is 1.
Returns: The modified input array.
method zeros(length)
Creates a complex type array of zeros.
Namespace types: series int, simple int, input int, const int
Parameters:
length (int) : The size of array to be created.
method bitReverse(data)
Rearranges a complex type array based on the bit-reverse permutations of its size after zero-padding.
Namespace types: array
Parameters:
data (array type from RezzaHmt/Complex/1) : The complex type array of input data.
Returns: The modified input array.
method R2FFT(data, inverse)
Calculates Fourier Transform of a time series using Cooley-Tukey Radix-2 Decimation in Time FFT algorithm, wikipedia.org
Namespace types: array
Parameters:
data (array type from RezzaHmt/Complex/1) : The complex type array of input data.
inverse (int) : Set to -1 for FFT and to 1 for iFFT.
Returns: The modified input array containing the FFT result.
method LBFFT(data, inverse)
Calculates Fourier Transform of a time series using Leo Bluestein's FFT algorithm, wikipedia.org This function is nearly 4 times slower than the R2FFT function in practice.
Namespace types: array
Parameters:
data (array type from RezzaHmt/Complex/1) : The complex type array of input data.
inverse (int) : Set to -1 for FFT and to 1 for iFFT.
Returns: The modified input array containing the FFT result.
method DFT(data, inverse)
This is the original DFT algorithm. It is not suggested to be used regularly.
Namespace types: array
Parameters:
data (array type from RezzaHmt/Complex/1) : The complex type array of input data.
inverse (int) : Set to -1 for DFT and to 1 for iDFT.
Returns: The complex type array of DFT result.
Arrays
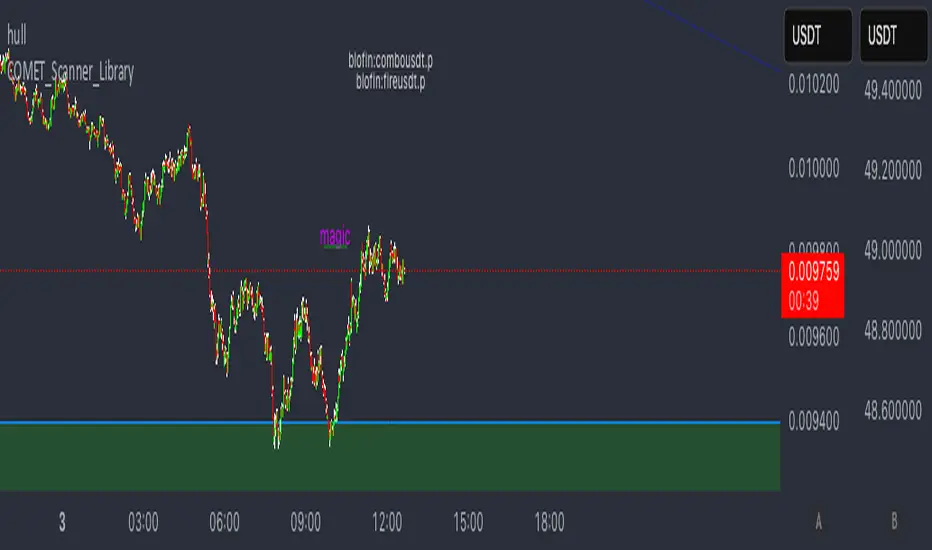
COMET_Scanner_Library_FINALLibrary "COMET_Scanner_Library"
- A Trader's Edge (ATE)_Library was created to assist in constructing COM Scanners
TickerIDs(_string)
TickerIDs: You must form this single tickerID input string exactly as described in the scripts info panel (little gray 'i' that
is circled at the end of the settings in the settings/input panel that you can hover your cursor over this 'i' to read the
details of that particular input). IF the string is formed correctly then it will break up this single string parameter into
a total of 40 separate strings which will be all of the tickerIDs that the script is using in your COM Scanner.
Parameters:
_string (simple string) : (string)
A maximum of 40 Tickers (ALL joined as 1 string for the input parameter) that is formulated EXACTLY as described
within the tooltips of the TickerID inputs in my COM Scanner scripts:
assets = input.text_area(tIDs, title="TickerIDs (MUST READ TOOLTIP)", group=g2, tooltip="Accepts 40 TICKERID's
for each copy of the script on the chart. *** MUST FORMAT THIS WAY *** Each FULL tickerID
(ie 'Exchange:ticker') must be separated by A SINGLE BLANK SPACE for correct formatting. The blank space tells
the script where to break off the ticker to assign it to a variable to be used later in the script. So this input
will be a single string constructed from up to 40 tickerID's with a space between each tickerID
(ie. 'BINANCE:BTCUSDT BINANCE:SXPUSDT BINANCE:XRPUSDT').", display=display.none)
Returns: Returns 40 output variables in the tuple (ie. between the ' ') with the separated TickerIDs,
Locations(_firstLocation)
Locations: This function is used when there's a desire to print an assets ALERT LABELS. A set Location on the scale is assigned to each asset.
This is created so that if a lot of alerts are triggered, they will stay relatively visible and not overlap each other.
If you set your '_firstLocation' parameter as 1, since there are a max of 40 assets that can be scanned, the 1st asset's location
is assigned the value in the '_firstLocation' parameter, the 2nd asset's location is the (1st asset's location+1)...and so on.
Parameters:
_firstLocation (simple int) : (simple int)
Optional (starts at 1 if no parameter added).
Location that you want the first asset to print its label if is triggered to do so.
ie. loc2=loc1+1, loc3=loc2+1, etc.
Returns: Returns 40 variables for the locations for alert labels
LabelSize(_barCnt, _lblSzRfrnce)
INVALID TICKERIDs: This is to add a table in the middle right of your chart that prints all the TickerID's that were either not formulated
correctly in the '_source' input or that is not a valid symbol and should be changed.
LABEL SIZES: This function sizes your Alert Trigger Labels according to the amount of Printed Bars the chart has printed within
a set time period, while also keeping in mind the smallest relative reference size you input in the 'lblSzRfrnceInput'
parameter of this function. A HIGHER % of Printed Bars(aka...more trades occurring for that asset on the exchange),
the LARGER the Name Label will print, potentially showing you the better opportunities on the exchange to avoid
exchange manipulation liquidations.
*** SHOULD NOT be used as size of labels that are your asset Name Labels next to each asset's Line Plot...
if your COM Scanner includes these as you want these to be the same size for every asset so the larger ones dont cover the
smaller ones if the plots are all close to each other ***
Parameters:
_barCnt (float) : (float)
Get the 1st variable('barCnt') from the Security function's tuple and input it as this functions 1st input
parameter which will directly affect the size of the 2nd output variable ('alertTrigLabel') that is also outputted by this function.
_lblSzRfrnce (string) : (string)
Optional (if parameter not included, it defaults to size.small). This will be the size of the variable outputted
by this function named 'assetNameLabel' BUT also affects the size of the output variable 'alertTrigLabel' as it uses this parameter's size
as the smallest size for 'alertTrigLabel' then uses the '_barCnt' parameter to determine the next sizes up depending on the "_barCnt" value.
Returns: ( )
Returns 2 variables:
1st output variable ('AssetNameLabel') is assigned to the size of the 'lblSzRfrnceInput' parameter.
2nd output variable('alertTrigLabel') can be of variying sizes depending on the 'barCnt' parameter...BUT the smallest
size possible for the 2nd output variable ('alertTrigLabel') will be the size set in the 'lblSzRfrnceInput' parameter.
InvalidTickerIDs(_close, _securityTickerid, _invalidArray, _tablePosition, _stackVertical)
Parameters:
_close (float)
_securityTickerid (string)
_invalidArray (array)
_tablePosition (simple string)
_stackVertical (simple bool)
PrintedBarCount(_time, _barCntLength, _barCntPercentMin)
The Printed BarCount Filter looks back a User Defined amount of minutes and calculates the % of bars that have printed
out of the TOTAL amount of bars that COULD HAVE been printed within the same amount of time.
Parameters:
_time (int) : (int)
The time associated with the chart of the particular asset that is being screened at that point.
_barCntLength (int) : (int)
The amount of time (IN MINUTES) that you want the logic to look back at to calculate the % of bars that have actually
printed in the span of time you input into this parameter.
_barCntPercentMin (int) : (int)
The minimum % of Printed Bars of the asset being screened has to be GREATER than the value set in this parameter
for the output variable 'bc_gtg' to be true.
Returns: ( )
Returns 2 outputs:
1st is the % of Printed Bars that have printed within the within the span of time you input in the '_barCntLength' parameter.
2nd is true/false according to if the Printed BarCount % is above the threshold that you input into the '_barCntPercentMin' parameter.
COM_Scanner_LibraryLibrary "COM_Scanner_Library"
- A Trader's Edge (ATE)_Library was created to assist in constructing COM Scanners
TickerIDs(_string)
TickerIDs: You must form this single tickerID input string exactly as described in the scripts info panel (little gray 'i' that
is circled at the end of the settings in the settings/input panel that you can hover your cursor over this 'i' to read the
details of that particular input). IF the string is formed correctly then it will break up this single string parameter into
a total of 40 separate strings which will be all of the tickerIDs that the script is using in your COM Scanner.
Parameters:
_string (simple string) : (string)
A maximum of 40 Tickers (ALL joined as 1 string for the input parameter) that is formulated EXACTLY as described
within the tooltips of the TickerID inputs in my COM Scanner scripts:
assets = input.text_area(tIDs, title="TickerIDs (MUST READ TOOLTIP)", group=g2, tooltip="Accepts 40 TICKERID's
for each copy of the script on the chart. *** MUST FORMAT THIS WAY *** Each FULL tickerID
(ie 'Exchange:ticker') must be separated by A SINGLE BLANK SPACE for correct formatting. The blank space tells
the script where to break off the ticker to assign it to a variable to be used later in the script. So this input
will be a single string constructed from up to 40 tickerID's with a space between each tickerID
(ie. 'BINANCE:BTCUSDT BINANCE:SXPUSDT BINANCE:XRPUSDT').", display=display.none)
Returns: Returns 40 output variables in the tuple (ie. between the ' ') with the separated TickerIDs,
Locations(_firstLocation)
Locations: This function is used when there's a desire to print an assets ALERT LABELS. A set Location on the scale is assigned to each asset.
This is created so that if a lot of alerts are triggered, they will stay relatively visible and not overlap each other.
If you set your '_firstLocation' parameter as 1, since there are a max of 40 assets that can be scanned, the 1st asset's location
is assigned the value in the '_firstLocation' parameter, the 2nd asset's location is the (1st asset's location+1)...and so on.
Parameters:
_firstLocation (simple int) : (simple int)
Optional (starts at 1 if no parameter added).
Location that you want the first asset to print its label if is triggered to do so.
ie. loc2=loc1+1, loc3=loc2+1, etc.
Returns: Returns 40 variables for the locations for alert labels
LabelSize(_barCnt, _lblSzRfrnce)
INVALID TICKERIDs: This is to add a table in the middle right of your chart that prints all the TickerID's that were either not formulated
correctly in the '_source' input or that is not a valid symbol and should be changed.
LABEL SIZES: This function sizes your Alert Trigger Labels according to the amount of Printed Bars the chart has printed within
a set time period, while also keeping in mind the smallest relative reference size you input in the 'lblSzRfrnceInput'
parameter of this function. A HIGHER % of Printed Bars(aka...more trades occurring for that asset on the exchange),
the LARGER the Name Label will print, potentially showing you the better opportunities on the exchange to avoid
exchange manipulation liquidations.
*** SHOULD NOT be used as size of labels that are your asset Name Labels next to each asset's Line Plot...
if your COM Scanner includes these as you want these to be the same size for every asset so the larger ones dont cover the
smaller ones if the plots are all close to each other ***
Parameters:
_barCnt (float) : (float)
Get the 1st variable('barCnt') from the Security function's tuple and input it as this functions 1st input
parameter which will directly affect the size of the 2nd output variable ('alertTrigLabel') that is also outputted by this function.
_lblSzRfrnce (string) : (string)
Optional (if parameter not included, it defaults to size.small). This will be the size of the variable outputted
by this function named 'assetNameLabel' BUT also affects the size of the output variable 'alertTrigLabel' as it uses this parameter's size
as the smallest size for 'alertTrigLabel' then uses the '_barCnt' parameter to determine the next sizes up depending on the "_barCnt" value.
Returns: ( )
Returns 2 variables:
1st output variable ('AssetNameLabel') is assigned to the size of the 'lblSzRfrnceInput' parameter.
2nd output variable('alertTrigLabel') can be of variying sizes depending on the 'barCnt' parameter...BUT the smallest
size possible for the 2nd output variable ('alertTrigLabel') will be the size set in the 'lblSzRfrnceInput' parameter.
InvalidTickerIDs(_close, _securityTickerid, _invalidArray, _tablePosition, _stackVertical)
Parameters:
_close (float)
_securityTickerid (string)
_invalidArray (array)
_tablePosition (simple string)
_stackVertical (simple bool)
PrintedBarCount(_time, _barCntLength, _barCntPercentMin)
The Printed BarCount Filter looks back a User Defined amount of minutes and calculates the % of bars that have printed
out of the TOTAL amount of bars that COULD HAVE been printed within the same amount of time.
Parameters:
_time (int) : (int)
The time associated with the chart of the particular asset that is being screened at that point.
_barCntLength (int) : (int)
The amount of time (IN MINUTES) that you want the logic to look back at to calculate the % of bars that have actually
printed in the span of time you input into this parameter.
_barCntPercentMin (int) : (int)
The minimum % of Printed Bars of the asset being screened has to be GREATER than the value set in this parameter
for the output variable 'bc_gtg' to be true.
Returns: ( )
Returns 2 outputs:
1st is the % of Printed Bars that have printed within the within the span of time you input in the '_barCntLength' parameter.
2nd is true/false according to if the Printed BarCount % is above the threshold that you input into the '_barCntPercentMin' parameter.

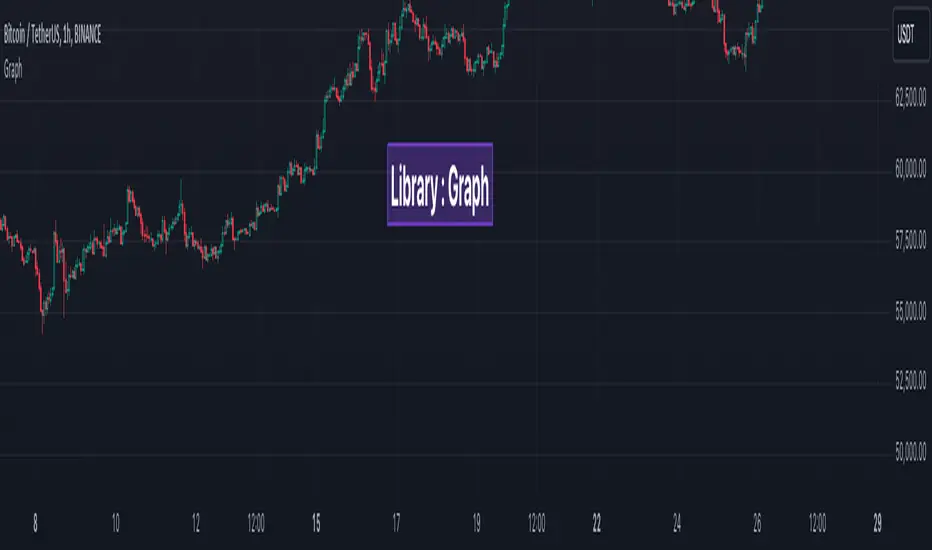
GraphLibrary "Graph"
Library to collect data and draw scatterplot and heatmap as graph
method init(this)
Initialise Quadrant Data
Namespace types: Quadrant
Parameters:
this (Quadrant) : Quadrant object that needs to be initialised
Returns: current Quadrant object
method init(this)
Initialise Graph Data
Namespace types: Graph
Parameters:
this (Graph) : Graph object that needs to be initialised with 4 Quadrants
Returns: current Graph object
method add(this, data)
Add coordinates to graph
Namespace types: Graph
Parameters:
this (Graph) : Graph object
data (Coordinate) : Coordinates containing x, y data
Returns: current Graph object
method calculate(this)
Calculation required for plotting the graph
Namespace types: Graph
Parameters:
this (Graph) : Graph object
Returns: current Graph object
method paint(this)
Draw graph
Namespace types: Graph
Parameters:
this (Graph) : Graph object
Returns: current Graph object
Coordinate
Coordinates of sample data
Fields:
xValue (series float) : x value of the sample data
yValue (series float) : y value of the sample data
Quadrant
Data belonging to particular quadrant
Fields:
coordinates (array) : Coordinates present in given quadrant
GraphProperties
Properties of Graph that needs to be drawn
Fields:
rows (series int) : Number of rows (y values) in each quadrant
columns (series int) : number of columns (x values) in each quadrant
graphtype (series GraphType) : Type of graph - scatterplot or heatmap
plotColor (series color) : color of plots or heatmap
plotSize (series string) : size of cells in the table
plotchar (series string) : Character to be printed for display of scatterplot
outliers (series int) : Excude the outlier percent of data from calculating the min and max
position (series string) : Table position
bgColor (series color) : graph background color
PlotRange
Range of a plot in terms of x and y values and the number of data points that fall within the Range
Fields:
minX (series float) : min range of X value
maxX (series float) : max range of X value
minY (series float) : min range of Y value
maxY (series float) : max range of Y value
count (series int) : number of samples in the range
Graph
Graph data and properties
Fields:
properties (GraphProperties) : Graph Properties object associated
quadrants (array) : Array containing 4 quadrant data
plotRanges (matrix) : range and count for each cell
xArray (array) : array of x values
yArray (array) : arrray of y values
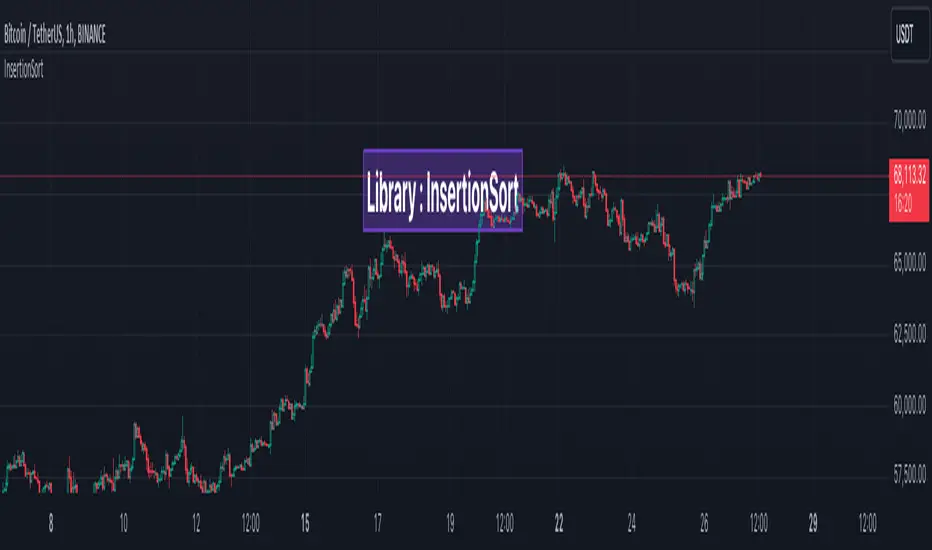
InsertionSortLibrary "InsertionSort"
Library of sorting algorithm for binary insertion sort and related methods
method binary_insertion_sort(sortedArray, item, order)
binary insertion sort - inserts item into sorted array while maintaining sort order
Namespace types: array
Parameters:
sortedArray (array) : array which is assumed to be sorted in the requested order
item (float) : float|int item which needs to be inserted into sorted array
order (series ORDER) : Sort order - positive number means ascending order whereas negative number represents descending order
Returns: int index at which the item is inserted into sorted array
method binary_insertion_sort(sortedArray, item, order)
Namespace types: array
Parameters:
sortedArray (array)
item (int)
order (series ORDER)
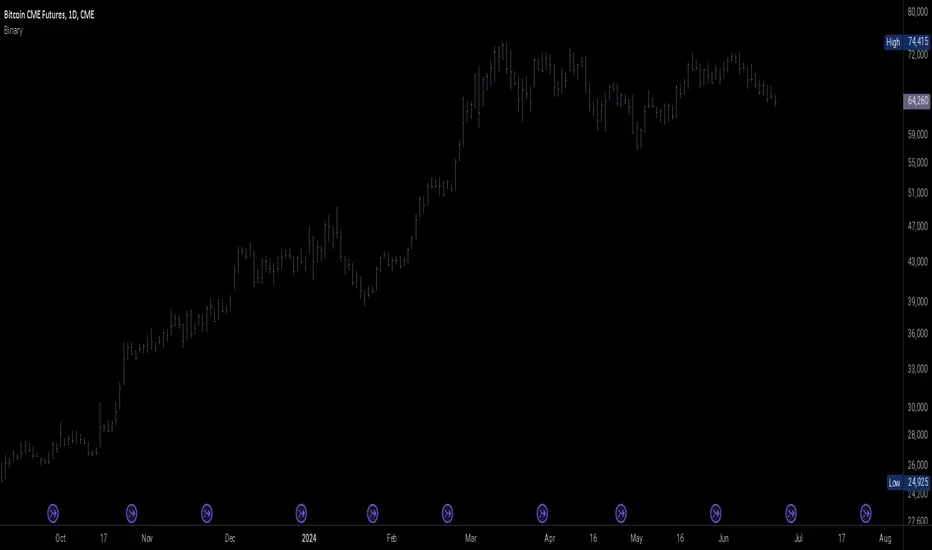
BinaryLibrary "Binary"
This library includes functions to convert between decimal and binary numeral formats, and logical and arithmetic operations on binary numbers.
method toBin(value)
Converts the provided boolean value into binary integers (0 or 1).
Namespace types: series bool, simple bool, input bool, const bool
Parameters:
value (bool) : The boolean value to be converted.
Returns: The converted value in binary integers.
method dec2bin(value, iBits, fBits)
Converts a decimal number into its binary representation.
Namespace types: series float, simple float, input float, const float
Parameters:
value (float) : The decimal number to be converted.
iBits (int) : The number of binary digits allocated for the integer part.
fBits (int) : The number of binary digits allocated for the fractional part.
Returns: An array containing the binary digits for the integer part at the rightmost positions and the digits for the fractional part at the leftmost positions. The array indexes correspond to the bit positions.
method bin2dec(value, iBits, fBits)
Converts a binary number into its decimal representation.
Namespace types: array
Parameters:
value (array) : The binary number to be converted.
iBits (int) : The number of binary digits allocated for the integer part.
fBits (int) : The number of binary digits allocated for the fractional part.
Returns: The converted value in decimal format.
method lgcAnd(a, b)
Bitwise logical AND of two binary numbers. The result of ANDing two binary digits is 1 only if both digits are 1, otherwise, 0.
Namespace types: array
Parameters:
a (array) : First binary number.
b (array) : Second binary number.
Returns: An array containing the logical AND of the inputs.
method lgcOr(a, b)
Bitwise logical OR of two binary numbers. The result of ORing two binary digits is 0 only if both digits are 0, otherwise, 1.
Namespace types: array
Parameters:
a (array) : First binary number.
b (array) : Second binary number.
Returns: An array containing the logical OR of the inputs.
method lgcXor(a, b)
Bitwise logical XOR of two binary numbers. The result of XORing two binary digits is 1 only if ONE of the digits is 1, otherwise, 0.
Namespace types: array
Parameters:
a (array) : First binary number.
b (array) : Second binary number.
Returns: An array containing the logical XOR of the inputs.
method lgcNand(a, b)
Bitwise logical NAND of two binary numbers. The result of NANDing two binary digits is 0 only if both digits are 1, otherwise, 1.
Namespace types: array
Parameters:
a (array) : First binary number.
b (array) : Second binary number.
Returns: An array containing the logical NAND of the inputs.
method lgcNor(a, b)
Bitwise logical NOR of two binary numbers. The result of NORing two binary digits is 1 only if both digits are 0, otherwise, 0.
Namespace types: array
Parameters:
a (array) : First binary number.
b (array) : Second binary number.
Returns: An array containing the logical NOR of the inputs.
method lgcNot(a)
Bitwise logical NOT of a binary number. The result of NOTing a binary digit is 0 if the digit is 1, or vice versa.
Namespace types: array
Parameters:
a (array) : A binary number.
Returns: An array containing the logical NOT of the input.
method lgc2sC(a)
2's complement of a binary number. The 2's complement of a binary number N with n digits is defined as 2^(n) - N.
Namespace types: array
Parameters:
a (array) : A binary number.
Returns: An array containing the 2's complement of the input.
method shift(value, direction, newBit)
Shifts a binary number in the specified direction by one position.
Namespace types: array
Parameters:
value (array)
direction (int) : The direction of the shift operation.
newBit (int) : The bit to be inserted into the unoccupied slot.
Returns: A tuple of the shifted binary number and the serial output of the shift operation.
method multiShift(value, direction, newBits)
Shifts a binary number in the specified direction by multiple positions.
Namespace types: array
Parameters:
value (array)
direction (int) : The direction of the shift operation.
newBits (array)
Returns: A tuple of the shifted binary number and the serial output of the shift operation.
method crclrShift(value, direction, count)
Circularly shifts a binary number in the specified direction by multiple positions. Each ejected bit is inserted from the opposite side.
Namespace types: array
Parameters:
value (array)
direction (int) : The direction of the shift operation.
count (int) : The number of positions to be shifted by.
Returns: The shifted binary number.
method arithmeticShift(value, direction, count)
Performs arithmetic shift on a binary number in the specified direction by multiple positions. Every new bit is 0 if the shift is leftward, otherwise, it equals the sign bit.
Namespace types: array
Parameters:
value (array)
direction (int) : The direction of the shift operation.
count (int) : The number of positions to be shifted by.
Returns: The shifted binary number.
method add(a, b, carry)
Performs arithmetic addition on two binary numbers.
Namespace types: array
Parameters:
a (array) : First binary number.
b (array) : Second binary number.
carry (int) : The input carry of the operation.
Returns: The result of the arithmetic addition of the inputs.
method sub(a, b, carry)
Performs arithmetic subtraction on two binary numbers.
Namespace types: array
Parameters:
a (array) : First binary number.
b (array) : Second binary number. The number to be subtracted.
carry (int) : The input carry of the operation.
Returns: The result of the arithmetic subtraction of the input b from the input a.
TradingUtilsLibrary "TradingUtils"
Utility library for common trading functions
calcVariation(price, threshold)
Calculates variation of a price based on a threshold
Parameters:
price (float) : (float) The price to be varied
threshold (float) : (float) The threshold for the variation
Returns: (float) The varied price
sendAlert(action, symbol, orderType, quantity, message)
Sends an alert message in JSON format
Parameters:
action (string) : (string) The action to be taken (e.g., "BUY", "SELL")
symbol (string) : (string) The trading symbol (e.g., "BTCUSDT")
orderType (string) : (string) The order type (e.g., "MARKET")
quantity (float) : (float) The quantity of the order
message (string) : (string) The message to be included in the alert
updateLine(condition, index, price, lineColor)
Updates or creates a line on the chart
Parameters:
condition (bool) : (bool) Condition to check if the line should be updated or created
index (int) : (int) The current bar index
price (float) : (float) The price value for the line
lineColor (color) : (color) The color of the line
Returns: (line) The updated or newly created line

JohtiLiquidityThis libraray will be provide the liquity points that's will be help to find exact point people going to take trades and it will the most important area

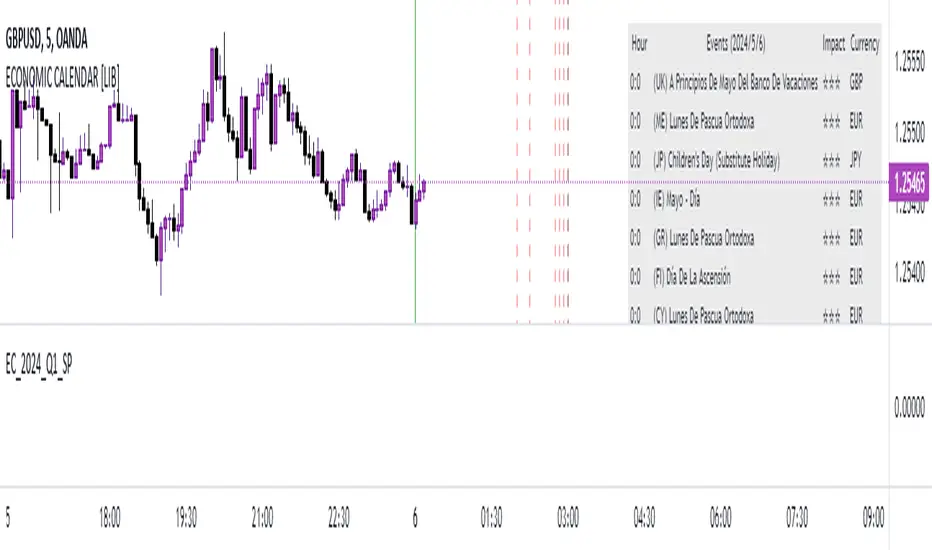
EC_2025_Q4_ENLibrary "EC_2025_Q4_EN"
output2025()
Returns the list of events during the period.
Returns: array: (week1,week2, ... week_n)
week_n= ;;; ...
Where: is expressed as date + characteristics: YYYY,MM,DD,hh,mm,ss,x,y,z
x impact in numbers
y event name in numbers
z currency in numbers
name2025()
Returns the list of event names during the period.
Returns: array: (week1,week2, ... week_n)
week_n= ;; ...
Where: is expressed as: index, name
index: related to event name y
name event: event name related to y text
impact2025()
Returns the list of impact names during the period.
Returns: array: (week1,week2, ... week_n)
week_n= ;; ...
Where: is expressed as: index, impact
index: related to impact name x
impact: impact name related to x text
currency2025()
Returns the list of currencies during the period.
Returns: array: (week1,week2, ... week_n)
week_n= ;; ...
Where: is expressed as: index, currency
index: related to currency name z
currency: currency name related to z text

EC_2025_Q3_ENLibrary "EC_2025_Q3_EN"
output2025()
Returns the list of events during the period.
Returns: array: (week1,week2, ... week_n)
week_n= ;;; ...
Where: is expressed as date + characteristics: YYYY,MM,DD,hh,mm,ss,x,y,z
x impact in numbers
y event name in numbers
z currency in numbers
name2025()
Returns the list of event names during the period.
Returns: array: (week1,week2, ... week_n)
week_n= ;; ...
Where: is expressed as: index, name
index: related to event name y
name event: event name related to y text
impact2025()
Returns the list of impact names during the period.
Returns: array: (week1,week2, ... week_n)
week_n= ;; ...
Where: is expressed as: index, impact
index: related to impact name x
impact: impact name related to x text
currency2025()
Returns the list of currencies during the period.
Returns: array: (week1,week2, ... week_n)
week_n= ;; ...
Where: is expressed as: index, currency
index: related to currency name z
currency: currency name related to z text

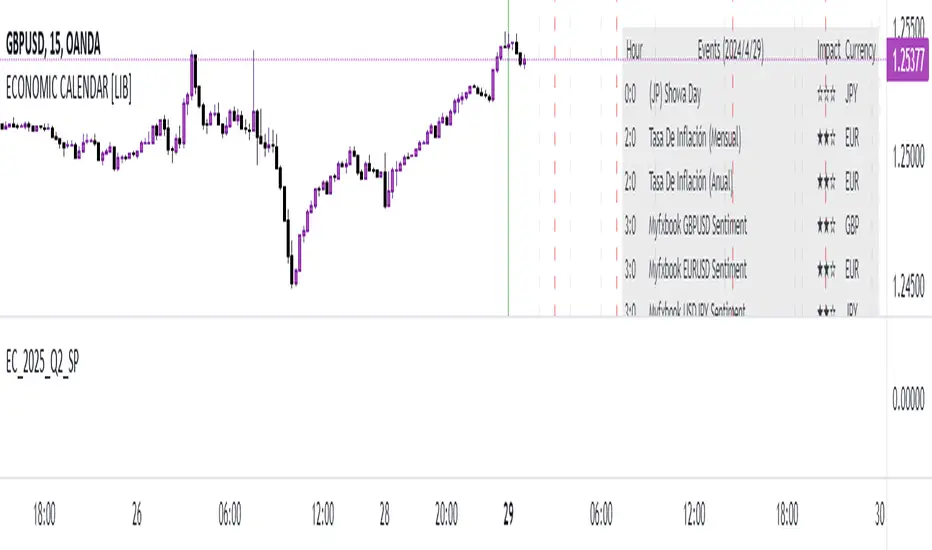
EC_2025_Q2_ENLibrary "EC_2025_Q2_EN"
output2025()
Returns the list of events during the period.
Returns: array: (week1,week2, ... week_n)
week_n= ;;; ...
Where: is expressed as date + characteristics: YYYY,MM,DD,hh,mm,ss,x,y,z
x impact in numbers
y event name in numbers
z currency in numbers
name2025()
Returns the list of event names during the period.
Returns: array: (week1,week2, ... week_n)
week_n= ;; ...
Where: is expressed as: index, name
index: related to event name y
name event: event name related to y text
impact2025()
Returns the list of impact names during the period.
Returns: array: (week1,week2, ... week_n)
week_n= ;; ...
Where: is expressed as: index, impact
index: related to impact name x
impact: impact name related to x text
currency2025()
Returns the list of currencies during the period.
Returns: array: (week1,week2, ... week_n)
week_n= ;; ...
Where: is expressed as: index, currency
index: related to currency name z
currency: currency name related to z text

EC_2025_Q1_ENLibrary "EC_2025_Q1_EN"
output2025()
Returns the list of events during the period.
Returns: array: (week1,week2, ... week_n)
week_n= ;;; ...
Where: is expressed as date + characteristics: YYYY,MM,DD,hh,mm,ss,x,y,z
x impact in numbers
y event name in numbers
z currency in numbers
name2025()
Returns the list of event names during the period.
Returns: array: (week1,week2, ... week_n)
week_n= ;; ...
Where: is expressed as: index, name
index: related to event name y
name event: event name related to y text
impact2025()
Returns the list of impact names during the period.
Returns: array: (week1,week2, ... week_n)
week_n= ;; ...
Where: is expressed as: index, impact
index: related to impact name x
impact: impact name related to x text
currency2025()
Returns the list of currencies during the period.
Returns: array: (week1,week2, ... week_n)
week_n= ;; ...
Where: is expressed as: index, currency
index: related to currency name z
currency: currency name related to z text

EC_2025_Q4_SPLibrary "EC_2025_Q4_SP"
output2025()
Returns the list of events during the period.
Returns: array: (week1,week2, ... week_n)
week_n= ;;; ...
Where: is expressed as date + characteristics: YYYY,MM,DD,hh,mm,ss,x,y,z
x impact in numbers
y event name in numbers
z currency in numbers
name2025()
Returns the list of event names during the period.
Returns: array: (week1,week2, ... week_n)
week_n= ;; ...
Where: is expressed as: index, name
index: related to event name y
name event: event name related to y text
impact2025()
Returns the list of impact names during the period.
Returns: array: (week1,week2, ... week_n)
week_n= ;; ...
Where: is expressed as: index, impact
index: related to impact name x
impact: impact name related to x text
currency2025()
Returns the list of currencies during the period.
Returns: array: (week1,week2, ... week_n)
week_n= ;; ...
Where: is expressed as: index, currency
index: related to currency name z
currency: currency name related to z text

EC_2025_Q3_SPLibrary "EC_2025_Q3_SP"
output2025()
Returns the list of events during the period.
Returns: array: (week1,week2, ... week_n)
week_n= ;;; ...
Where: is expressed as date + characteristics: YYYY,MM,DD,hh,mm,ss,x,y,z
x impact in numbers
y event name in numbers
z currency in numbers
name2025()
Returns the list of event names during the period.
Returns: array: (week1,week2, ... week_n)
week_n= ;; ...
Where: is expressed as: index, name
index: related to event name y
name event: event name related to y text
impact2025()
Returns the list of impact names during the period.
Returns: array: (week1,week2, ... week_n)
week_n= ;; ...
Where: is expressed as: index, impact
index: related to impact name x
impact: impact name related to x text
currency2025()
Returns the list of currencies during the period.
Returns: array: (week1,week2, ... week_n)
week_n= ;; ...
Where: is expressed as: index, currency
index: related to currency name z
currency: currency name related to z text

EC_2025_Q2_SPLibrary "EC_2025_Q2_SP"
output2025()
Returns the list of events during the period.
Returns: array: (week1,week2, ... week_n)
week_n= ;;; ...
Where: is expressed as date + characteristics: YYYY,MM,DD,hh,mm,ss,x,y,z
x impact in numbers
y event name in numbers
z currency in numbers
name2025()
Returns the list of event names during the period.
Returns: array: (week1,week2, ... week_n)
week_n= ;; ...
Where: is expressed as: index, name
index: related to event name y
name event: event name related to y text
impact2025()
Returns the list of impact names during the period.
Returns: array: (week1,week2, ... week_n)
week_n= ;; ...
Where: is expressed as: index, impact
index: related to impact name x
impact: impact name related to x text
currency2025()
Returns the list of currencies during the period.
Returns: array: (week1,week2, ... week_n)
week_n= ;; ...
Where: is expressed as: index, currency
index: related to currency name z
currency: currency name related to z text
EC_2025_Q1_SPLibrary "EC_2025_Q1_SP"
output2025()
Returns the list of events during the period.
Returns: array: (week1,week2, ... week_n)
week_n= ;;; ...
Where: is expressed as date + characteristics: YYYY,MM,DD,hh,mm,ss,x,y,z
x impact in numbers
y event name in numbers
z currency in numbers
name2025()
Returns the list of event names during the period.
Returns: array: (week1,week2, ... week_n)
week_n= ;; ...
Where: is expressed as: index, name
index: related to event name y
name event: event name related to y text
impact2025()
Returns the list of impact names during the period.
Returns: array: (week1,week2, ... week_n)
week_n= ;; ...
Where: is expressed as: index, impact
index: related to impact name x
impact: impact name related to x text
currency2025()
Returns the list of currencies during the period.
Returns: array: (week1,week2, ... week_n)
week_n= ;; ...
Where: is expressed as: index, currency
index: related to currency name z
currency: currency name related to z text

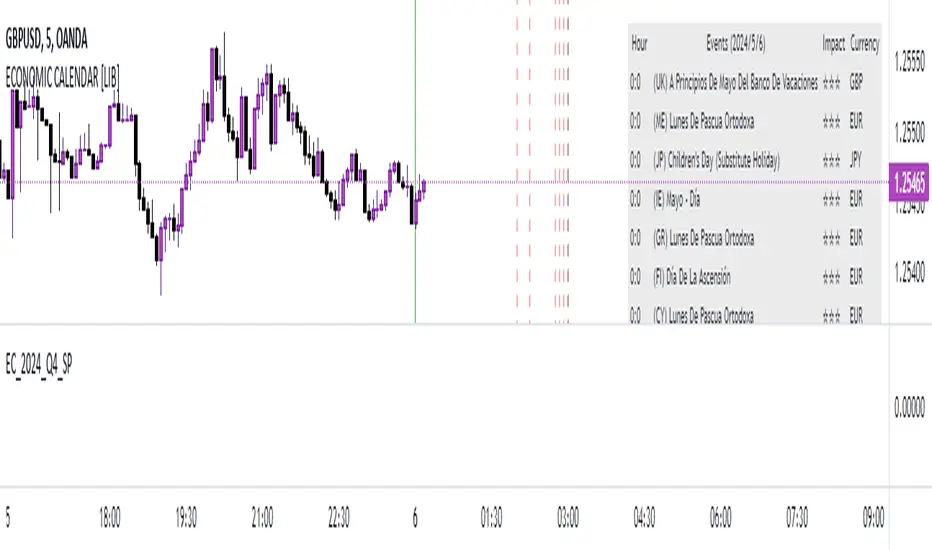
EC_2024_Q4_SPLibrary "EC_2024_Q4_SP"
output2024()
Returns the list of events during the period.
Returns: array: (week1,week2, ... week_n)
week_n= ;;; ...
Where: is expressed as date + characteristics: YYYY,MM,DD,hh,mm,ss,x,y,z
x impact in numbers
y event name in numbers
z currency in numbers
name2024()
Returns the list of event names during the period.
Returns: array: (week1,week2, ... week_n)
week_n= ;; ...
Where: is expressed as: index, name
index: related to event name y
name event: event name related to y text
impact2024()
Returns the list of impact names during the period.
Returns: array: (week1,week2, ... week_n)
week_n= ;; ...
Where: is expressed as: index, impact
index: related to impact name x
impact: impact name related to x text
currency2024()
Returns the list of currencies during the period.
Returns: array: (week1,week2, ... week_n)
week_n= ;; ...
Where: is expressed as: index, currency
index: related to currency name z
currency: currency name related to z text
EC_2024_Q3_SPLibrary "EC_2024_Q3_SP"
output2024()
Returns the list of events during the period.
Returns: array: (week1,week2, ... week_n)
week_n= ;;; ...
Where: is expressed as date + characteristics: YYYY,MM,DD,hh,mm,ss,x,y,z
x impact in numbers
y event name in numbers
z currency in numbers
name2024()
Returns the list of event names during the period.
Returns: array: (week1,week2, ... week_n)
week_n= ;; ...
Where: is expressed as: index, name
index: related to event name y
name event: event name related to y text
impact2024()
Returns the list of impact names during the period.
Returns: array: (week1,week2, ... week_n)
week_n= ;; ...
Where: is expressed as: index, impact
index: related to impact name x
impact: impact name related to x text
currency2024()
Returns the list of currencies during the period.
Returns: array: (week1,week2, ... week_n)
week_n= ;; ...
Where: is expressed as: index, currency
index: related to currency name z
currency: currency name related to z text

EC_2024_Q4_ENLibrary "EC_2024_Q4_EN"
output2024()
Returns the list of events during the period.
Returns: array: (week1,week2, ... week_n)
week_n= ;;; ...
Where: is expressed as date + characteristics: YYYY,MM,DD,hh,mm,ss,x,y,z
x impact in numbers
y event name in numbers
z currency in numbers
name2024()
Returns the list of event names during the period.
Returns: array: (week1,week2, ... week_n)
week_n= ;; ...
Where: is expressed as: index, name
index: related to event name y
name event: event name related to y text
impact2024()
Returns the list of impact names during the period.
Returns: array: (week1,week2, ... week_n)
week_n= ;; ...
Where: is expressed as: index, impact
index: related to impact name x
impact: impact name related to x text
currency2024()
Returns the list of currencies during the period.
Returns: array: (week1,week2, ... week_n)
week_n= ;; ...
Where: is expressed as: index, currency
index: related to currency name z
currency: currency name related to z text

EC_2024_Q3_ENLibrary "EC_2024_Q3_EN"
output2024()
Returns the list of events during the period.
Returns: array: (week1,week2, ... week_n)
week_n= ;;; ...
Where: is expressed as date + characteristics: YYYY,MM,DD,hh,mm,ss,x,y,z
x impact in numbers
y event name in numbers
z currency in numbers
name2024()
Returns the list of event names during the period.
Returns: array: (week1,week2, ... week_n)
week_n= ;; ...
Where: is expressed as: index, name
index: related to event name y
name event: event name related to y text
impact2024()
Returns the list of impact names during the period.
Returns: array: (week1,week2, ... week_n)
week_n= ;; ...
Where: is expressed as: index, impact
index: related to impact name x
impact: impact name related to x text
currency2024()
Returns the list of currencies during the period.
Returns: array: (week1,week2, ... week_n)
week_n= ;; ...
Where: is expressed as: index, currency
index: related to currency name z
currency: currency name related to z text

EC_2024_Q2_ENLibrary "EC_2024_Q2_EN"
output2024()
Returns the list of events during the period.
Returns: array: (week1,week2, ... week_n)
week_n= ;;; ...
Where: is expressed as date + characteristics: YYYY,MM,DD,hh,mm,ss,x,y,z
x impact in numbers
y event name in numbers
z currency in numbers
name2024()
Returns the list of event names during the period.
Returns: array: (week1,week2, ... week_n)
week_n= ;; ...
Where: is expressed as: index, name
index: related to event name y
name event: event name related to y text
impact2024()
Returns the list of impact names during the period.
Returns: array: (week1,week2, ... week_n)
week_n= ;; ...
Where: is expressed as: index, impact
index: related to impact name x
impact: impact name related to x text
currency2024()
Returns the list of currencies during the period.
Returns: array: (week1,week2, ... week_n)
week_n= ;; ...
Where: is expressed as: index, currency
index: related to currency name z
currency: currency name related to z text

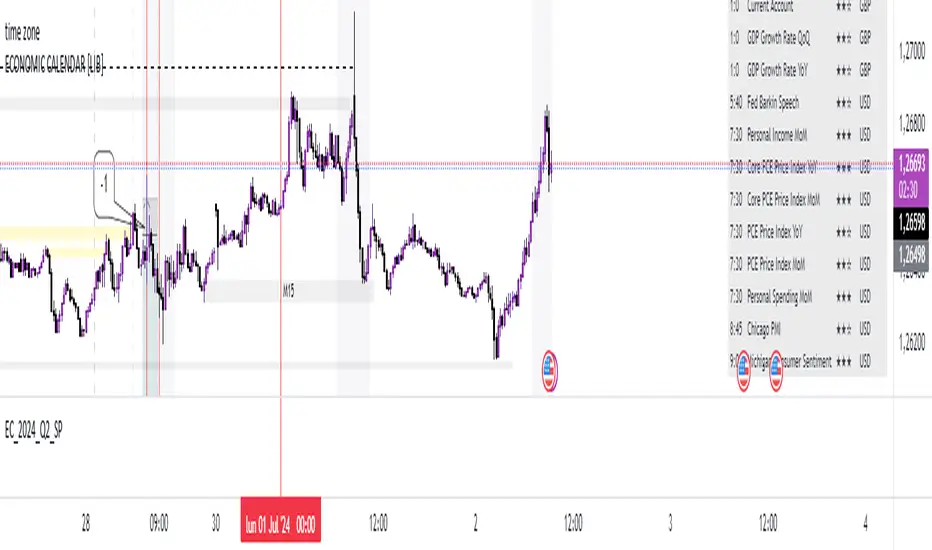
EC_2024_Q2_SPLibrary "EC_2024_Q2_SP"
output2024()
Returns the list of events during the period.
Returns: array: (week1,week2, ... week_n)
week_n= ;;; ...
Where: is expressed as date + characteristics: YYYY,MM,DD,hh,mm,ss,x,y,z
x impact in numbers
y event name in numbers
z currency in numbers
name2024()
Returns the list of event names during the period.
Returns: array: (week1,week2, ... week_n)
week_n= ;; ...
Where: is expressed as: index, name
index: related to event name y
name event: event name related to y text
impact2024()
Returns the list of impact names during the period.
Returns: array: (week1,week2, ... week_n)
week_n= ;; ...
Where: is expressed as: index, impact
index: related to impact name x
impact: impact name related to x text
currency2024()
Returns the list of currencies during the period.
Returns: array: (week1,week2, ... week_n)
week_n= ;; ...
Where: is expressed as: index, currency
index: related to currency name z
currency: currency name related to z text
EC_2024_Q1_SPLibrary "EC_2024_Q1_SP"
output2024()
Returns the list of events during the period.
Returns: array: (week1,week2, ... week_n)
week_n= ;;; ...
Where: is expressed as date + characteristics: YYYY,MM,DD,hh,mm,ss,x,y,z
x impact in numbers
y event name in numbers
z currency in numbers
name2024()
Returns the list of event names during the period.
Returns: array: (week1,week2, ... week_n)
week_n= ;; ...
Where: is expressed as: index, name
index: related to event name y
name event: event name related to y text
impact2024()
Returns the list of impact names during the period.
Returns: array: (week1,week2, ... week_n)
week_n= ;; ...
Where: is expressed as: index, impact
index: related to impact name x
impact: impact name related to x text
currency2024()
Returns the list of currencies during the period.
Returns: array: (week1,week2, ... week_n)
week_n= ;; ...
Where: is expressed as: index, currency
index: related to currency name z
currency: currency name related to z text