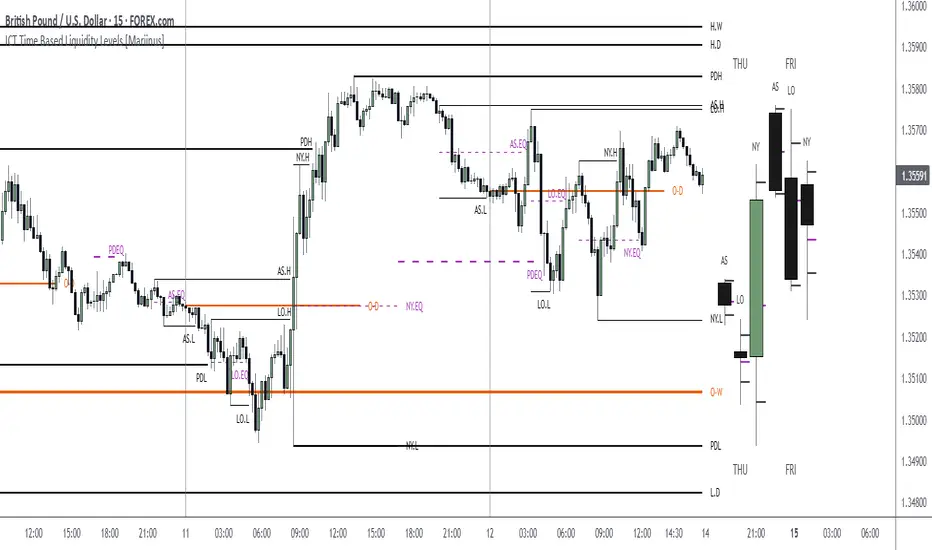
ICT Time Based Liquidity Levels [Mariinus]Indicator Overview – Inspired by ICT Concepts
This indicator helps you spot where liquidity rests and where major price moves are likely to begin or end — giving you clarity for both entries and exits.
Inspired by the teachings of the Inner Circle Trader (ICT), this tool builds on his philosophies and principles that have reshaped how traders view price action. One of the most powerful lessons that stuck with me personally is his quote:
"Time & Price, where it is Time first and then Price”
Another fundamental concept that underpins this tool is the idea that:
"Price is constantly moving in cycles from Premium to Equilibrium, from Equilibrium to Discount from Discount back to Premium."
With these core ideas in mind, this indicator was developed to help traders who are already using an ICT-based framework and focus on Kill Zones and by this on Time Based Liquidity.
In addition to plotting Session Highs and Lows on your chart, the ICT Time Based Liquidity Levels indicator also includes derived levels that provide deeper market insight. These include the Equilibrium of the full Session Range (High to Low) as well as the Equilibrium of the Wicks – offering a more nuanced view of price balance and potential turning points, in line with ICT’s core concepts.
To make sure your chart is not cluttered with lines, you can select which levels to show – and more importantly – you can plot Session Candles next to your Chart. Unlike standard time-based candles (e.g. 4H candles), these are “true” Session Candles that reflect the actual OHLC of trading Sessions, making it easier and clearer to see how Sessions interact with each other.
Next to Intraday Highs and Lows, the indicator will also plot Daily and Weekly Liquidity Pools above and below the Market, giving you insights to where Price is most likely heading towards.
You can set Alerts that trigger whenever one of these key levels is tagged, so you stay focused without staring at the screen all day.
⚠️ Important Disclaimer:
This is not a standalone trading plan.
This is not a buy or sell signal generator.
Instead, this tool is designed to support traders who follow ICT principles by helping them identify higher-probability PD Arrays – the key levels where setups are more likely to occur. If your trading plan includes looking for specific PD Arrays and structural frameworks taught by ICT, then this indicator is a visual aid to refine and focus your attention on the areas where your framework has a higher probability of playing out.
⚙️ Explanation of the Settings
You can combine up to 6 Sessions to monitor their respective levels while operating on a lower timeframe. You can define the timings and a long and short naming of those Sessions.
In the Days Section you can Set a lookback period to control how far back you want to calculate levels. Next to that you can select which Daily and or Weekly Levels you want to have shown on your Charts together with choosing their coloring, style and width.
In the Candles Section you can define how the Session Candles will look like which are plotted next to your Chart. When you have multiple Days of Session Candles it can come in handy to mirror image the Candles which will plot the Candles from right to left instead of the default left to right. In addition you can control how far the distance is between the Candles and your chart, the distance between Candles and Days and the thickness of those Candles. Next you can show or hide the Equilibrium of the total Session Range and the Equilibrium of the Wicks.
In the Lines Section you can specify which Session Levels you want to see on your Chart together with choosing their coloring, style and width.
In the Labels Section you can specify which Labels you want to show and how you want to show them.
In the Openings Section you can specify to show the Midnight Open and or Weekly Open. In addition you can add a divider to be able to distinguish between multiple Days or Weeks.
In the Alert Section you can specify for which Sessions you want to get notified when Key Levels are tagged. After setting this up, you need to set an alert via the Tradingview Alert function to really activate the Alert Function. Be aware that when you change your Alert setup, you need to setup the Tradingview Alert function again.
💡 Example Use Cases
These examples are for educational purposes only. This tool is not financial advice and should always be used in conjunction with your own trading plan—whether it involves Fair Value Gaps, Order Blocks, or a custom combination of ICT-based elements.
Asianrange
Kairos AR EdgeEN
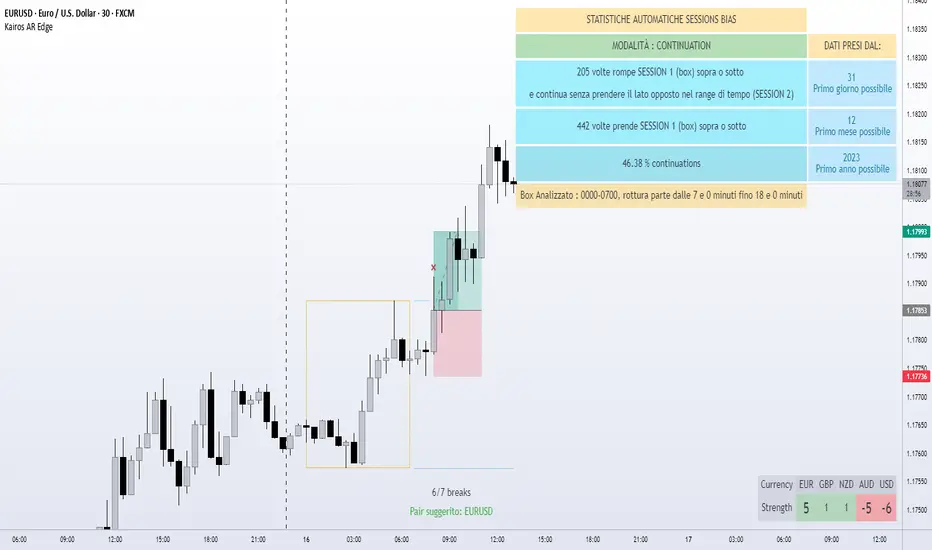
Kairos AR Edge is a closed-source (invite-only) Forex indicator providing statistical analysis of Asian session box breakouts and relative currency strength across 28 major pairs. Unlike standard breakout or trend-following tools, it consolidates breakout behavior into a single overview, helping traders quickly identify directional bias and strong/weak currencies. This aggregation provides unique insight not easily obtained from separate pair analysis.
Important Clarification:
Reversal and Continuation percentages are calculated for the pair on which the indicator is applied , showing how often a breakout returns (Reversal) or continues (Continuation) within the selected session window.
The Currency Strength Table is independent of these percentages. It scores each currency from -7 to +7 based on participation in Asian box breakouts across all 28 pairs, providing a relative strength overview regardless of the active pair.
The -7/+7 scale is derived from historical breakout occurrences and provides a quick reference for currency strength ranking
Indicator operates on two levels:
Session Bias Statistics: Builds an Asian session box for the active pair and analyzes breakout behavior. Users can select:
Reversal Mode : Percentage of breakouts that return to the opposite side within the selected timeframe
Continuation Mode : Percentage of breakouts that continue in the same direction within the timeframe
Currency Strength Table: Aggregates breakout behavior across all 28 pairs to provide a relative currency strength score (-7 to +7)
Visual Tools: Optional pivot-based bullish/bearish triggers and automatic session box visualization provide additional informational support.
Main Features:
Customizable Asian session box (start/end times and timezone)
Reversal or Continuation statistical mode
Automatic update of high/low levels
Currency Strength Table (-7 to +7)
Statistical table with historical breakout percentages
Optional visual triggers (pivot-based patterns)
Light/Dark theme support
Originality and Value:
Consolidates 28 pairs into a single view for immediate identification of market bias
Provides statistical insight into breakout behavior, not just trend-following or generic breakout alerts
Offers a quick-reference Currency Strength Table to identify strong/weak currencies without tracking multiple pairs individually
Important Notes:
Statistics are based on historical data only – no guarantee of future results
Educational and informational purposes only; not financial or trading advice
Closed-source indicator with invite-only access. Access requests can be made by contacting the author or following the link in the Author’s Instructions field
IT
Kairos AR Edge è un indicatore closed-source (invite-only) che fornisce analisi statistica sulle rotture del box della sessione asiatica e forza relativa delle valute su 28 coppie principali. A differenza dei normali strumenti di breakout o trend-following, consolida il comportamento dei breakout in un’unica panoramica, aiutando i trader a identificare rapidamente bias direzionali e valute forti/deboli. Questa aggregazione offre insight unici non facilmente ottenibili analizzando coppie singole.
Chiarimento importante:
Le percentuali di Reversal e Continuation si riferiscono solo alla coppia su cui l’indicatore è applicato , calcolando quante volte una rottura ritorna (Reversal) o continua (Continuation) entro la finestra di sessione selezionata.
La Tabella di Forza Valute è indipendente da queste percentuali. Assegna a ciascuna valuta un punteggio da -7 a +7 in base alla partecipazione ai breakout del box asiatico su tutte le 28 coppie, fornendo un quadro della forza relativa indipendentemente dalla coppia attiva.
Il punteggio -7/+7 deriva dai breakout storici e fornisce un riferimento rapido per la forza delle valute.
Lo script opera su due livelli:
Statistiche Bias di Sessione: Costruisce il box della sessione asiatica per la coppia attiva e analizza i breakout. Modalità selezionabili:
Reversal : Percentuale di breakout che tornano verso il lato opposto entro la finestra temporale
Continuation : Percentuale di breakout che proseguono nella stessa direzione entro la finestra
Tabella di Forza Valute: Aggrega il comportamento dei breakout su tutte le 28 coppie, assegnando un punteggio da -7 a +7 per ciascuna valuta in base alla sua forza relativa
Strumenti Visivi: Box della sessione asiatica aggiornato automaticamente e trigger opzionali basati su pattern pivot, fornendo supporto informativo aggiuntivo.
Funzionalità principali:
Box della sessione asiatica personalizzabile (orari e timezone)
Modalità statistica: Reversal o Continuation
Aggiornamento automatico dei livelli high/low
Tabella di Forza Valute (-7 a +7)
Tabella statistica con percentuali di rottura storiche
Trigger visivi opzionali (pattern pivot)
Supporto tema chiaro/scuro
Originalità e Valore:
Consolida 28 coppie in un’unica panoramica per identificare immediatamente bias di mercato
Fornisce insight statistico sui breakout, non solo trend-following o alert generici
Tabella di Forza Valute rapida per identificare valute forti/deboli senza controllare molteplici coppie
Nota importante:
Le statistiche si basano solo su dati storici – nessuna garanzia di risultati futuri
Strumento educativo e informativo; non costituisce consiglio finanziario o di trading
Indicatore closed-source con accesso su invito. Le richieste di accesso possono essere fatte contattando l’autore o seguendo il link nelle istruzioni dell’autore
Forex Kill Zones - SMC IndicatorsWhat are Kill Zones?
Kill Zones are specific Time Windows of opportunity during the Session that have the potential for the highest volatility and where looking for trading opportunities is ideal.
The Forex Kill Zone Indicator is specifically designed for the Forex Market. What differentiates this script from other Kill Zones scripts is that this script is based on NY Midnight as the basis for the start of the day.
This is not the usual below-average Kill Zone indicator because this indicator does not only show the 3 main Kill Zones or Sessions, but it also offers extra Kill Zones that are called "Asian Range (AR)", "Central Bank Dealing Range (CBDR)", and "FLOUT".
Another key differentiator of this indicator's functionality is that it shows the highs and lows of each Kill zone allowing SMC traders to monitor Time-Based Liquidity above the highs and lows of each trading session.
Another added benefit of this indicator is the Standard Deviations features for the AR, CBDR, and FLOUT that we added. The Standard Deviations act as key levels where there is a high probability of price reacting when in confluence with 1H or higher key levels (PD Arrays). The Standard Deviations are not pivot levels but are ranges above and below the Kill Zones that rely on TIME and PRICE in their calculations.
Finally, we have also incorporated a Notification function to remind the trader of the start of the trading Kill Zones to not miss out on potential trade opportunities.
Key Functionalities
1) Universal Time Reference:
Every day starts at 00:00 NY Midnight, irrespective of the trader's local time, Instead of the Standard GMT Midnight. This allows all Kill Zones to be in line with the New York start of the day at Midnight, as thought by ICT.
Weekend Highlighter
This feature highlights time from Sunday Market Open at 5 PM NY Time to 00:00 NY Midnight.
It's useful for identifying the non-trading or the low volatility periods when trading should be avoided.
Features Breakdown
Lookback Period
Defaulted to 60 trading days, aligning with “IPDA Data Ranges”, which is ideal for backtesting.
Adjustable for trading, and it's recommended to keep it at 20 trading days to focus on most recent data only.
24-hour Daily Intervals
The 24-hour intervals are not the same as the usual daily candle. Instead, the start of each trading day is anchored to the 00:00 NY Midnight.
Highlights "Days of the Week" labels, "Weekend" Trading Time, and the daily high-low ranges based on the start of trading day mark being at 00:00 NY Midnight.
London Kill Zone (Green)
Starts from 01:00 NY Time to 05:00 NY Time.
London closes at 12:00 NY Time.
Highlight the high and low of the London Kill Zone to Identify Time-Based Liquidity above and below the London Kill Zone Range.
Marks the London Close Session to mark the end of London End of the trading day, where volatility drops.
Highlights the time when there is the highest volatility during the London Session Kill Zone.
New York Kill Zone (Blue)
Starts from 07:00 NY time to 10:00 NY Time.
Marks The CME Open at 08:30 (the opening of the Bond Market).
Highlight the high and low of the New York Kill Zone to Identify Time-Based Liquidity above and below the NY Kill Zone Range.
Highlights the time when there is the highest volatility during the New York Session.
The Central Bank Dealing Range or "CBDR" (Orange)
Starts From 14:00 NY Time to 20:00 NY Time.
Highlight the high and low of the CBDR Kill Zone to Identify Time-Based Liquidity above and below the CBDR Kill Zone Range.
Also, there is an added ability to add the CBDR Standard Deviations above and below the CBDR.
Can also extend the CBDR Standard Deviations key levels until the end of the next day's London Kill Zone.
What are the CBDR Standard Deviations?
The Standard Deviations are extensions of the CBDR above and below the CBDR original range. It takes the high and low of the range and adds the range above and below the original range by x times.
The CCBDR Standard Deviations are NOT pivot levels. They are used as points of reference where we could expect the price to react when in confluence with higher timeframe reference points.
The idea behind them is that if the price is Bearish, the price could rally to +1 CBDR Standard Deviation below dropping lower. As shown in the image below on Thursday, the two vertical lines before the start of Thursday mark the CBDR Kill Zone, then the price rallied to +1 CBDR SDv and then dropped.
Asian Range "AR" Kill Zone
Starts from 20:00 NY Time to 00:00 NY Time.
Highlight the high and low of the AR Kill Zone to Identify Time-Based Liquidity above and below the AR Kill Zone Range.
Also, there is an added ability to add the AR Standard Deviations above and below the AR.
This KillZone should be primarily used when CBDR exceeds 40 pips.
Similar to the CBDR, the AR Standard Deviations also can be used as points of reference where we could expect the price to react when in confluence with higher timeframe reference points.
The AR Standard Deviations can also be extended until the end of the next day's London Kill Zone.
FLOUT Range
It Combines AR and CBDR, spanning from 14:00 NY Time to 00:00 NY Time.
The FLOUT should only be used when both AR and CBDR have small ranges of less than 10 pips combined.
Highlight the high and low of the FLOUT Kill Zone to Identify Time-Based Liquidity above and below the FLOUT Kill Zone Range.
The FLOUT Standard Deviations also can be used as points of reference where we could expect the price to react when in confluence with higher timeframe reference points.
The Flout Standard Deviations can be extended until the end of the next day London Kill Zone.
Bonus Features
Daily & Weekly Open Price Levels
The Open Price levels draw a horizontal line from the start of the trading day at 00:00 NY midnight, and it extends it towards the end of the trading day.
This is useful for understanding where the price is relative to the daily candle.
When Bullish, the trader should look for setups at or below the daily or weekly open price.
When Bearish, the trader should look for setups at or above the daily or weekly open price.
Whether to choose the Daily or Weekly open price depends on the trader's trading style. If the trader is day trading or scaling, then it's more appropriate to choose the Daily Open Price.
However, Day Traders can also use the Weekly candle to align with the Weekly Candle's expected range direction.
On the other hand, if the trader is a Swing Trader and wants to capitalise on the weekly candle's trend, then it's more appropriate to choose the Weekly Open Price.
However, Swing Traders can also use the Daily Open Price when looking to take a trade to time better entries with a high risk-to-reward ratio.
Notifications
The trader can also receive alerts as a reminder at the start of the desired session to not miss out on the start of the trading session.

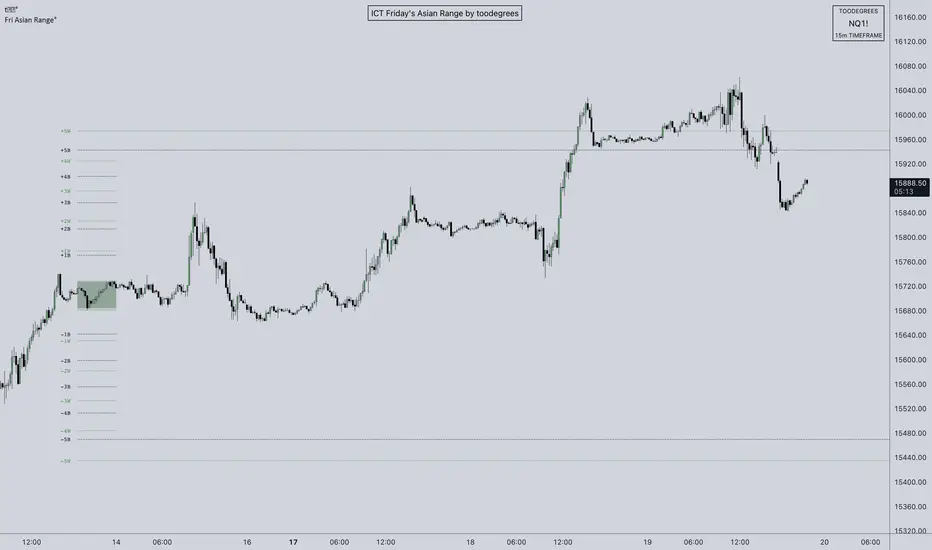
ICT Friday's Asian Range°This concept was engineered and taught by the Inner Circle Trader .
The goal of this script is to outline a potential draw on liquidity for the next trading week. It gives a parameter for ICT PD Arrays to be located above and below the marketplace and should be used in conjunction with the higher Timeframe Arrays as defined by ICT.
If there is a higher Timeframe array with a standard deviation confluence of the Friday Asian Range it is considered high probability for price to reach up/down to that level, and present a potential retracement or reversal.
The Asian Range is defined as the window of Time between 7PM to Midnight New York Time. In this case we will be only using the Friday's Asian Range which will take place on Thursday between these Times.
We have two ranges: a Body range made of the highest and lowest candle bodies, and a Wick range made by the highest and lowest candle wicks.
ICT teaches that we only want to apply this concept to the 5minute and 15minute chart.
THIS SCRIPT WILL NOT WORK ON ANY OTHER TIMEFRAME OUT OF THE BOX
Framework:
Visualization:
Example:
Daily Profile (Nephew_Sam_)From getting several requests to combine many of my indicators into one, this indicator plots everything you need for a Daily Profile.
1. Session = Current session + Daily dividers + day of the week
2. Open Lines = Plot the open of the day, midnight, week and month
3. Asian Range = Plots the asian range with an option for midpoint and extending lines
4. Previous OHLC = Plot the previous day/week/month OHLC
EVERY line/label/color/size/style is fully customizable in this indicator.
Important to adjust your timezone to get the correct data

ICT Killzone [Forex Edition]This indicator show in different way the bank session teached by ICT in his channel (Asian Range, London Open, New York Open, London Close).
The user have the opportunity to change the visualization from a beacon to a box, and is possible to show the amount of pips of box range with the "info" check.
If something isn't clear comment below and I will answer as soon as possible.

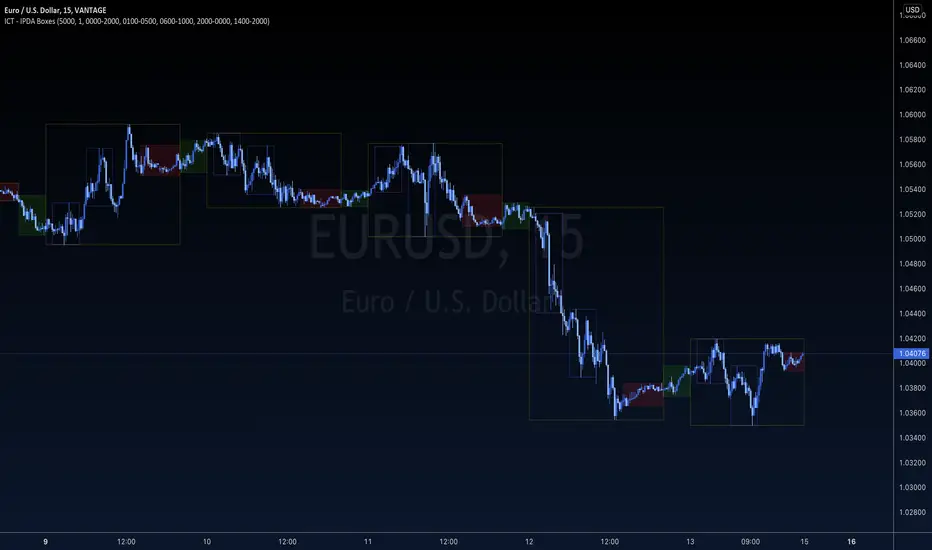
ICT - IPDA BoxesICT - IPDA Boxes indicator encapsulate important (TRUE DAY) time zones based on ICT concepts.
Standard settings will plot True Day, CBDR, Asian Range, London and NY Open Kill-Zones. It is designed to keep a minimalistic and clean look for your charts using TradingView's Dark theme, but you can adjust any specific line or background color transparency of your choice. If you want to add other session (like NY close for example), just paste again the indicator to your chart and set the correct session duration and colors of your preference. You can log, study, backtest and use it for your analysis if you are familiar with ICT concepts.
Check indicator time lines and adjust session times for your own TradingView's personal settings it before using.
ANY fault, bug or mismatch in this script is only mine and I will be glad to correct it if you let me know.
The ownership of all this concepts belongs to ICT - Michael Huddleston and it is published with his permission.
KVKZKVKZ = KV'S KILLZONES
This Indicator, break the charts into session: ASIAN, LONDON, NEW YORK.
-The 1st two vertical lines (red) indicates the ASIAN RANGE
-The 2nd two vertical lines (red & green) indicates the LONDON session
-The 3rd two vertical lines (green & blue) indicates the NEW YORK session
-The will be no trading in between the two red vertical lines
-A fake move is expected to happen in between the 2nd red vertical line and green line, this fake move is known as the JUDAS SWING by ICT, you can YouTube Judas Swing and check out his concepts
-There are two automatically moving horizontal lines (orange), that plots the ASIAN high and lows, these levels are expected to be manipulated in the London session, and this is called the Judas Swing
-the purple lines are known as Institution Zones, basically just levels 30pips above and below the ASIAN range
-this indicator works well with GBPUSD, EURUSD, USDCHF
-this indicator doesn’t work well with USDJPY, AUDUSD, NZDUSD
INPUTS:
HOUR 1: 17
MIN 1 : 0
HOUR 2: 0
MIN 2 : 0
HOUR 3: 6
MIN 3 : 0
HOUR 4: 12
MIN 1 : 0
THIS INDICATOR IS NOT A HOLY GRAIL, BUT IF YOU CAN READ PRICE ACTION WELL, THESE SESSIONS BREAK DOWN COULD BE VERY USEFULL.
Extras:
dot = dotted lines
dsh = dashed lines
sol = solid lines
NOTE: time has to be set to NY time.
