Luminous Volatility Flux [Pineify]```
Luminous Volatility Flux - Dynamic ATR Bands with Hull Moving Average Baseline
The Luminous Volatility Flux indicator is a sophisticated trend-following and volatility analysis tool that combines the responsiveness of the Hull Moving Average (HMA) with adaptive ATR-based bands that expand and contract based on real-time market volatility conditions. This indicator helps traders identify trend direction, volatility regimes, and potential breakout opportunities with high-probability entry signals.
Key Features
Hull Moving Average baseline for low-lag trend detection
Dynamic volatility bands that breathe with market conditions
Flux Factor system comparing short-term vs long-term ATR
Volatility-filtered breakout signals to reduce false entries
Gradient-filled zones for intuitive visual analysis
Real-time bar coloring based on trend direction
How It Works
The indicator operates on three core calculation layers:
1. Hull Moving Average Baseline
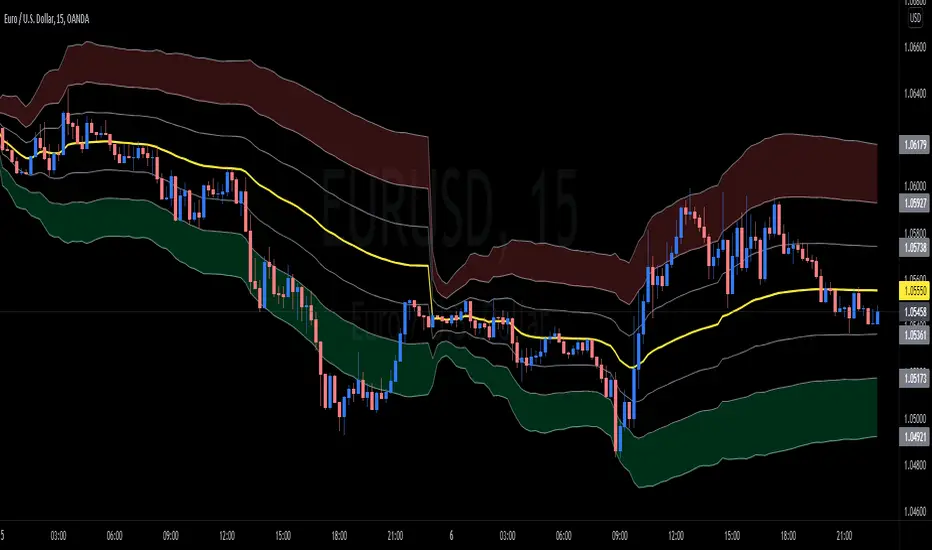
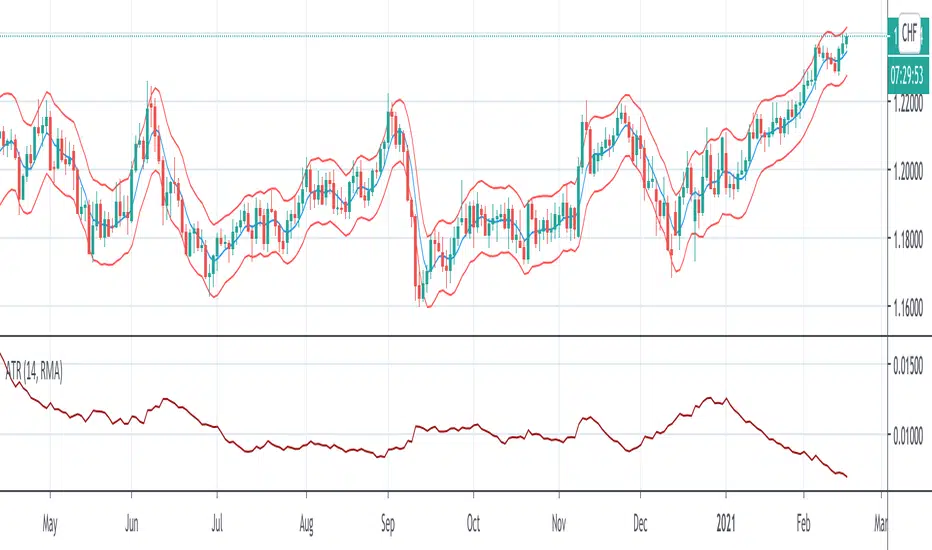
The foundation of this indicator is the Hull Moving Average, calculated using the formula: WMA(2*WMA(n/2) - WMA(n), sqrt(n)). Unlike traditional moving averages, the HMA dramatically reduces lag while maintaining smoothness. This makes it ideal for identifying trend changes earlier than conventional EMAs or SMAs. When the HMA is rising, the baseline turns green indicating bullish momentum; when falling, it turns red for bearish conditions.
2. Volatility Flux Factor
The unique aspect of this indicator is the Flux Factor calculation. It compares short-term ATR (default 14 periods) against long-term ATR (default 100 periods) to determine the current volatility regime:
Flux Factor > 1.0 = Volatility Expansion (market is more volatile than usual)
Flux Factor < 1.0 = Volatility Compression (market is in a squeeze)
This ratio creates a dynamic multiplier that causes the bands to expand during high volatility periods and contract during consolidation phases.
3. Dynamic Band Calculation
The upper and lower bands are calculated as: Baseline ± (Short ATR × Multiplier × Flux Factor). This means the bands automatically widen when volatility increases and tighten during quiet market conditions, providing context-aware support and resistance levels.
Trading Ideas and Insights
Trend Following: Trade in the direction of the baseline color. Green baseline suggests looking for long opportunities; red baseline suggests short opportunities.
Volatility Breakouts: The indicator plots "Flux" signals when price breaks above the upper band (bullish) or below the lower band (bearish) during volatility expansion phases. These signals indicate potential momentum continuation.
Mean Reversion: During compression phases (tight bands), prices often revert to the baseline. Consider taking profits near the bands and re-entering near the baseline.
Squeeze Detection: When bands are unusually tight (Flux Factor < 1), the market is coiling for a potential explosive move. Prepare for breakout trades.
How Multiple Indicators Work Together
This indicator integrates three distinct technical analysis concepts into a cohesive system:
The Hull Moving Average provides the trend direction foundation with minimal lag. The dual ATR comparison (short vs long) creates the Flux Factor that measures relative volatility. The dynamic bands combine both elements, using the HMA as the center and ATR-based deviations that scale with the Flux Factor.
The synergy works as follows: The HMA identifies the trend, the Flux Factor determines market regime (expansion vs compression), and the bands provide dynamic support/resistance levels. Breakout signals only trigger when all components align - price breaks the band AND volatility is expanding. This multi-layered approach filters out many false signals that would occur with static bands or simple moving average crossovers.
Unique Aspects
Unlike Bollinger Bands that use standard deviation, this indicator uses ATR ratio-based dynamic bands that better capture directional volatility
The Flux Factor concept is original - comparing two ATR timeframes to create a volatility regime indicator
Breakout signals are filtered by volatility expansion, reducing false signals during choppy, low-volatility conditions
Gradient fills provide instant visual feedback on the strength of the bullish or bearish zones
How to Use
Add the indicator to your chart. It works on all timeframes and instruments.
Observe the baseline color for overall trend direction (green = bullish, red = bearish).
Watch for band expansion/contraction to gauge volatility regime.
Look for "Flux" signals for potential breakout entries - these appear only during volatility expansion.
Use the gradient zones to identify potential support (lower green zone) and resistance (upper red zone) areas.
Customization
Baseline Length (default: 24) - Controls the HMA period. Lower values = more responsive but noisier; higher values = smoother but more lag.
ATR Length (default: 14) - Short-term ATR period for band calculation. Standard setting works well for most markets.
Flux Multiplier (default: 2.0) - Controls band width. Increase for wider bands (fewer signals), decrease for tighter bands (more signals).
Flux Sensitivity (default: 100) - Long-term ATR period for Flux Factor calculation. Higher values create a more stable volatility reference.
Conclusion
The Luminous Volatility Flux indicator offers traders a comprehensive view of market conditions by combining trend detection, volatility analysis, and signal generation into one elegant tool. Its adaptive nature makes it suitable for various market conditions - from trending markets where it identifies direction and momentum, to ranging markets where it highlights compression and potential breakout zones. The volatility-filtered signals help traders focus on high-probability setups while the visual gradient fills make chart analysis intuitive and efficient.
Note: This indicator is designed as a technical analysis tool. Always use proper risk management and consider multiple factors before making trading decisions. Past performance does not guarantee future results.
```
مؤشر Pine Script®