Auto Anchored VWAP by Perigraph highAuto Anchored VWAP for High points
High point threshold included
Auto


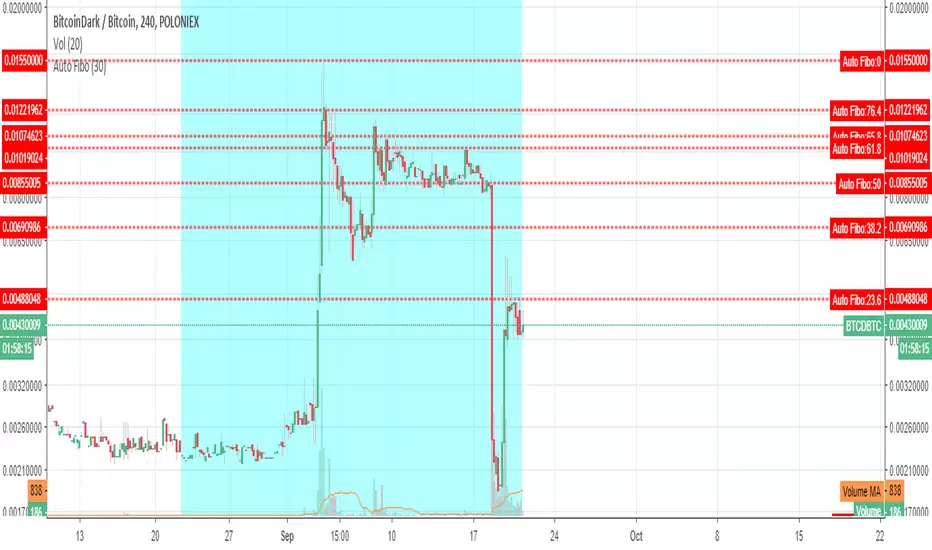
Basecamp AutoFibAutomatic Fibonacci Support and Resistance derived from the recent Average True Range.
This tool is used as a guideline for where mathematically evident support and resistances are estimated to be.
Unlike typical methods, this will adjust as candles print and the ATR expands or contracts assisting the user in ensuring realistic price targets relative to the current movement.

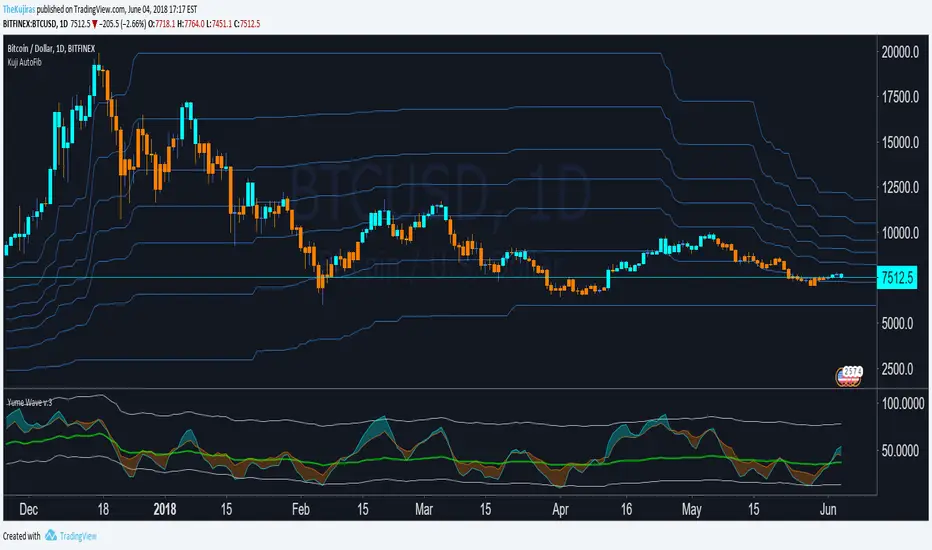
Efficient Auto LineMore Efficiency
Based on the Auto-Line code, the Efficient Auto Line aim to provide a more controlled adaptivity of the indicator. The first indicator of this sort worked this way : when the absolute difference between the price and the indicator is higher than the previous indicator +/- A pips of amplitude, the indicator will display the closing price, else its anterior value. The second indicator (Auto-Line) was adaptive and used the standard deviation instead of a constant A . This indicator will run both methodology providing both a trend strength indicator (Efficiency Ratio) parameter and two constant parameter.
Parameters
The length parameter will control the period of the efficiency ratio, a high period return lower values of the efficiency ratio. Since its an indicator in a range of (0,1) we use it to make our indicator more adaptive in trending market, this is when we need our two constant parameters, the fast/slow parameter can be any amount of pips where fast < slow , when the price is trending (efficiency ratio close to 1) the indicator will use the fast parameter, if its ranging (efficiency ratio away from 1) the indicator will use the slow parameter, then it will work like the first methodology previously explained. So the fast parameter should be equal to a small movement of pips (0.0001 or 1 pip) and the slow parameter should be equal to a number of pips you wont expect to see in a ranging market. At this point it is good to test for both parameter and see which values work better (a more automatic process is in development) .
Hope you like it !

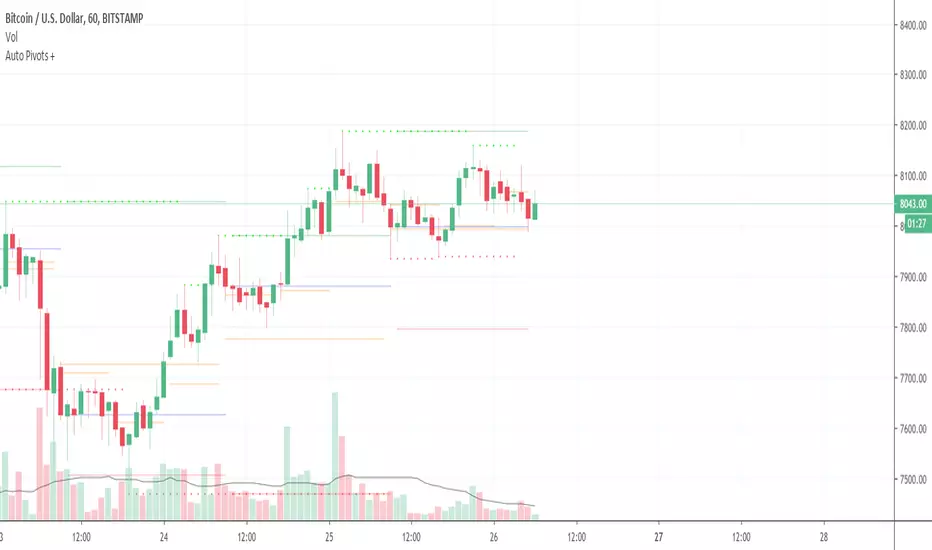
Auto Pivot PointsThis indicator plots a Pivot Point and 3 Support and Resistance lines that automatically adapt to the Timeframe
These can also be plotted against a Custom Timeframe
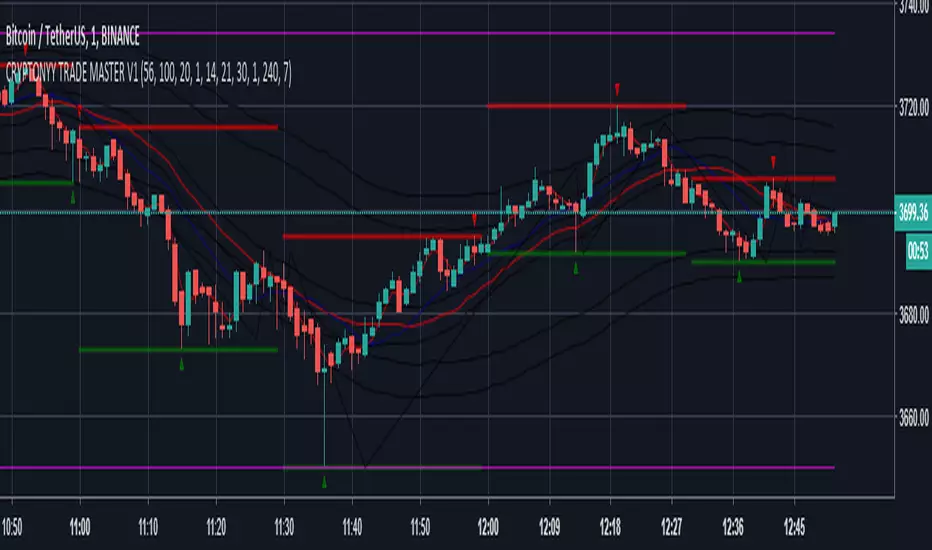
CRYPTONYY TRADE MASTER V1THIS SCRIPT IS ONLY MADE FOR BITMEX TRADERS.
IT WORKS ON 1MINUTE TIMEFRAME SMOOTHLY.
ADVANTAGES:
1. AUTO BUY/SELL SIGNALS.
2. 95% ACCURACY.
3. U WILL NEVER BE IN LOSS BECAUSE WE DEVELOPED THIS WITH OUR PERSONAL VOLATILITY INDICATOR.SO IF MARKET GOES OPPOSITE IT WILL GIVE U THE SIGNAL BEFORE YOUR LAST ENTRY PRICE.
4. DOUBLE CROSS INDICATOR.
5. MUCH VOLATILE=INCREASE THE SIGNAL ACCURACY.
6. 1MINUTE TIMEFRAME IS BEST TO TRADE WITH THIS SOFTWARE.
THOSE WHO WANT TO BUY THIS OR WANT DEMO COMMENT BELOW,I WILL MESSAGE YOU.
CRYPTONYY TRADING MACHINEThia script will automatically gives you long and short signals.
WORKS ON ALL EXCHANGE.
SUITABLE FOR BITMEX TRADING.
FOR ALTCOINS TRADING GO FOR 30MIN OR ABOVE 30MIN TIMEFRAME.
AUTOMATIC STOP LOSS TRIGGER.
MORE NEW UPDATES COMING!!!

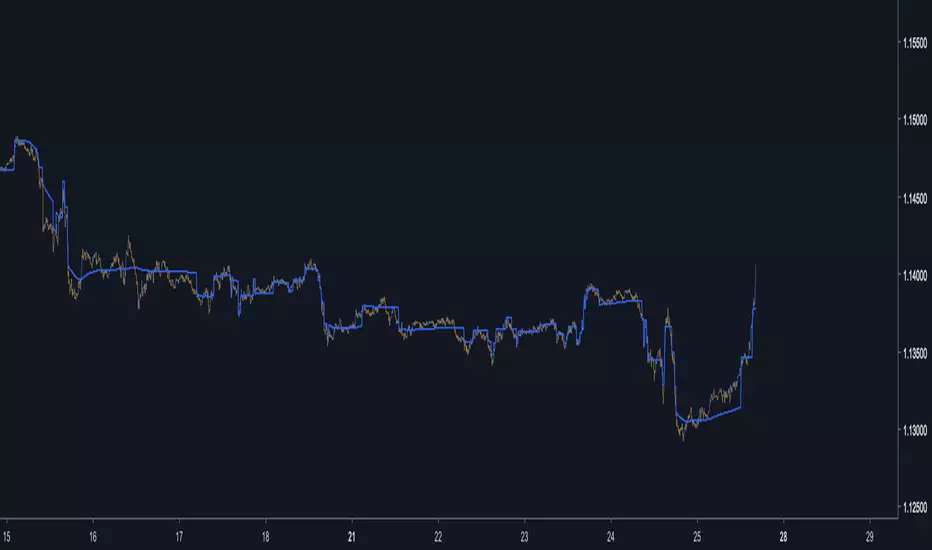
Auto-Line With DriftA variation on the Auto-Line indicator, we allow it to get closer to the price thanks to a drift , this also allow the line to be more directional .
This indicator can be used with moving averages using crosses as signals or as a band indicator by ploting a + dev as the upper band and a - dev as the lower one.
For any help or suggestions feel free to send a message :)

Missile RSI (RSI of momentum w/ Dominant Cycle length + Fisher)This is a predictive indicator that looks for explosions in momentum of the cycles in price and large shifts in Momentum (Fisher turns the Bimodal PDF into Guassian like) as statistically unlikely events, showing points to exit or reverse positions.
You can adjust the lowpass frequency cuttoff (Aka what cycles you want to remove from the calculations through the super smoother filter).
To be honest you can monkey trade the direction of the Signal if you'd like but the Divergences and Maxing of the values is whats most useful.
Let me know if you guys want me to add anything else.

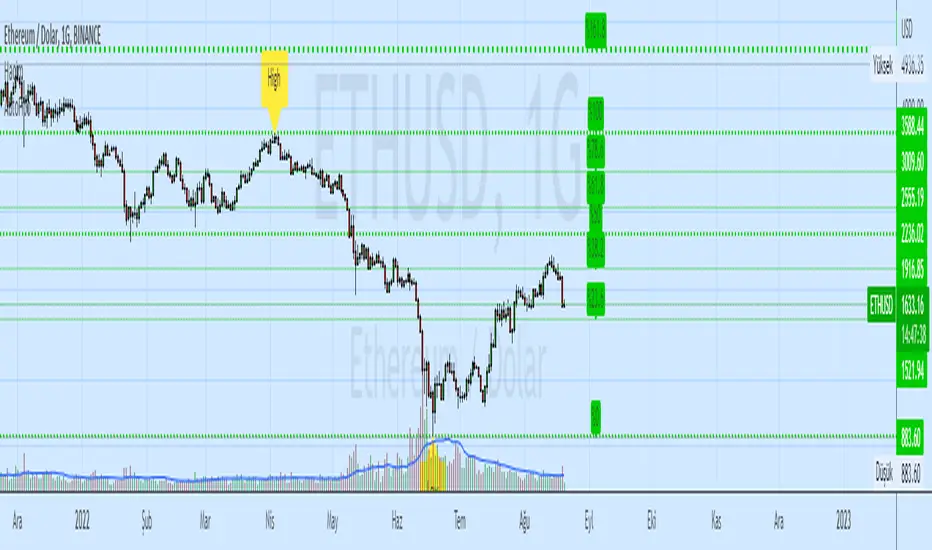
Auto Fibonacci Retracament Levels by evhar002This indicator/tool (Auto Fibo) draws Fibonacci Retracement Levels automatically on chart.
The algorithm of the Indicator Plots the extreme points and puts the retracement levels in order by itself with 100% sensitivity.
The key point is that to arrange the length of the "Days Back" to arrange the correct extreme points.
Like the other auto plotting tools, the levels can change when the time frame of the chart changes, in contrast with manually drawn Fibo levels.
In technical analysis , a Fibonacci retracement is created by taking two extreme points (usually a major peak and trough) on a stock chart and dividing the vertical distance by the key Fibonacci ratios of 23.6%, 38.2%, 50%, 61.8% and 100%.
Description copied from tr.tradingview.com and updated according to this script content.
Here's the link to a complete list of all my published indicators:
www.tradingview.com
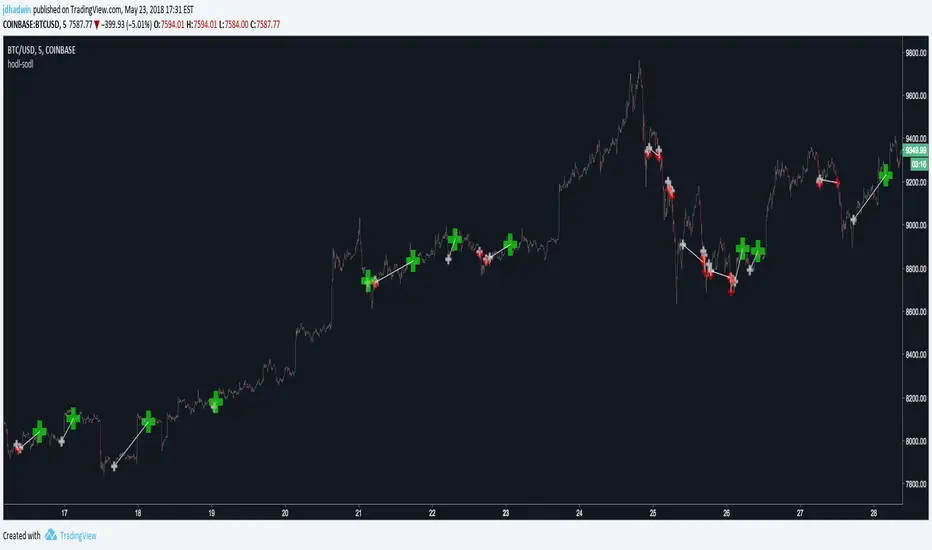
AutoView - Hodl to SodlWrite your own strategy and use Hodl to Sodl to send Alerts for when to buy & sell, and automatically plot your anticipated buys/sells to the chart. A must have for AutoView users. Requires Pine Script coding. Not compatible with "Strategy Tester" tab and "Paper Trading" tab in TradingView.
Hodl-Sodl itself is not a strategy. It is a framework for building AutoView strategies. For demonstration purposes, the image featured with this script shows an example of a very simple CCI strategy (and not a very good one), but you would presumably replace that with your own ideas. If you'd like a little help plugging in your own strategy, contact jdhadwin for custom coding.
Fibonacci Auto ModeThis script is an attempt to display Fibonacci Levels in Auto Mode.
It allows for:
Select Higher Time Frame (HTF)
Indicate How Many Bars from HTF to Use to Find Highs/Lows
Manual Mode: Overrides HTF selections
Number of Bars Back to use in Manual Mode
Show/Hide each one of the Levels
Highlight RLZ

Auto-FilterA least squares filter using the Auto line as source, practical for noise removal without higher phase shift.
Its possible to create another parameter for the auto-line length, just add a parameter Period or whatever you want.
r = round(close/round)*round
dev = stdev(close,Period)
Hope you enjoy :)
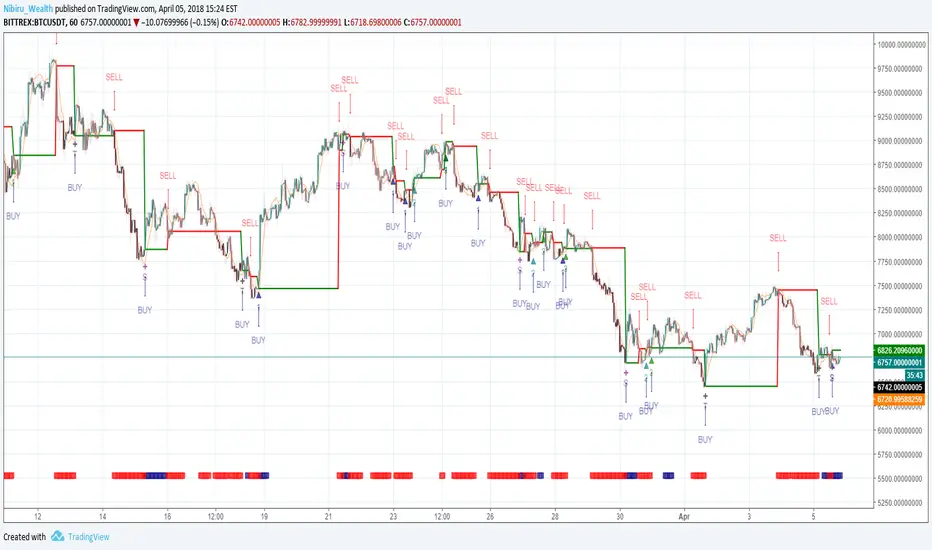
YODA TRADE ULTIMATE - BETA----- YODA TRADE ULTIMATE -----
Strategy was designed for automatic USDT pairs trading. Default setting are pre-tuned to BTCUSDT pair.
--- MAIN FEATURES ---
efortless BUY/SELL signal generator (not suitable for margin trading... yet)
automatic trending detection and candle painting accordingly
sophisticated STOP LOSS able avoid flash crashes
every option is tweakable - feel free to play with them
repainting proof (when 'open' price source is selected)
--- ADDITIONAL INFO ---
Script operates best on 1H candles (not heikin-ashi).
Alerts should be set 'once per bar' as early reaction to flash crashes and flash pumps is important.
As this is BETA - all can changed until final release. If you have any comments or requests please PM us.
--- DISCLAIMER ---
We do not offer any financial or investment advice. Investing, trading (especialy cryptocurrencies) is risky. You can loose all your money. Use on your own responsibility.
DO YOUR OWN RESEARCH!
Auto Trendline Lower Ascending Trend line No label editionThis version is for people don't like the labels shown on chart, it works the same as the original one.
There will be no label on the right side of chart.
The concept is straightforward: the trend line is formed by two adjacent troughs when the price is in a uptrend. It will save a lot of time for people who uses trendline very often.
By deploying this indicator, should the condition meet, you don't need to draw the trend lines by hand anymore. You can also consider it as a trend line reminder.
It's also very easy to use, just load it on chart and set your desired inputs.
Features:
Adjust the strength of the 2 troughs that form the trend line .
Set price difference between two troughs in two variables: amount or percentage.
Turn on/off the cross below alert.
It works on all symbols and all timeframes.
never paint

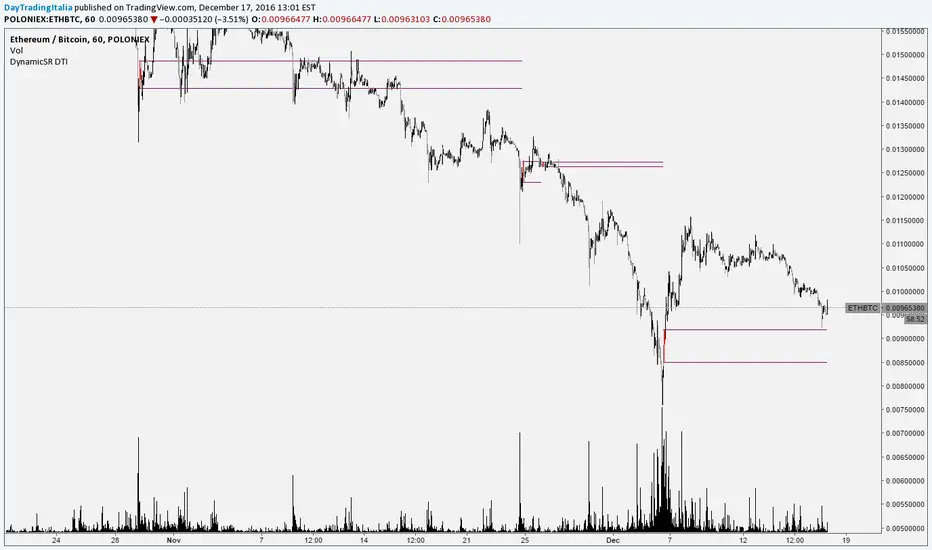
DynamicSR DTI: Auto Support and Resistance AreaThis works only on charts with real volume...if it does work
Automatic Daily Fibonacci v0.3 by JustUncleLThis update is a correction on the way the Fib Zero line is calculated. Previously it was just based on the source of the previous day, which is Ok as long as the Fiblength was set to 2. The new version calculates the Fib Zero from the average of the specified source over the Fiblength, so if Fiblength is now something other than 2 the Fibonacci Zero and other support and resistant levels should calculate correctly.

AutoFib channel by-StocksightCreates a channel off of desired periods' high and low and plots Fib levels. Automatically updates itself after every candle. Easily helps find the next entry point on any time frame.

Simple Horizontal Value and Offsets [Auto Shift]Original (Simple Horizontal Value and Offsets/SHV) Requested by @TAFA94
Description:
Simple adjustable incremented horizontal offset lines extending up and down from a Median point.
Set full value for manual Median point control, or set an incremental rounding value for auto Median adjustment.
Source and look-back period inputs for fine tuning auto adjust.
Auto adjust on by default - can be toggled off for straight manual control.
**NOTE**
All values will likely need to be changed immediately on applying this script, in order to properly fit your charts specific price/value range and/or time resolution.
Cheers!

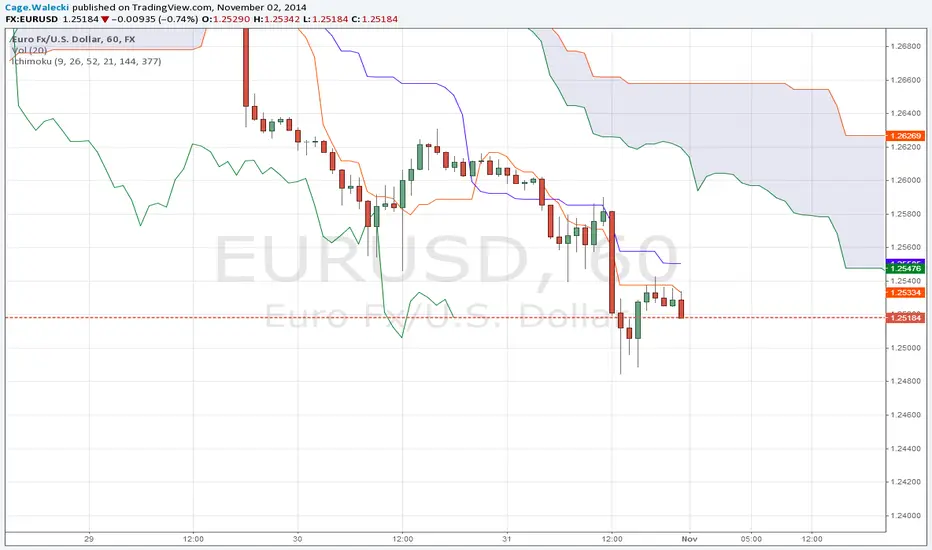
Ichimoku Cloud ALERTHi, this my new script which show you correct Ichimoku signals, when price exit cloud.
SELL SIGNAL:
- red line below blue
- green line below price
- price exit cloud bottom
- price below 3 EMA's!
BUY SIGNAL:
- red line above blue
- green line above price
- price exit cloud upper
- price above 3 EMA's!
You can change ichimoku parameters and input 3 EMA's. If u dont want use any of the EMA's then input 1 into them.