Auto Channel [SciQua]Auto Channel
Purpose
Auto Channel finds the single best parallel price channel from recent price action and keeps it updated in real time. It uses ZigZag pivots to build candidate channels, scores each candidate for quality, then plots the winner. When price closes outside the channel, the script flags a breakout and can fire alerts.
How it works
1. ZigZag pivots
The script uses TradingView’s TradingView/ZigZag/7 library to generate a stream of swing highs and lows based on a percentage reversal threshold and a leg depth. These pivots are the only points the channel logic evaluates, which keeps the search fast and focused on structure rather than noise.
2. Channel candidates
From the most recent pivots, the script forms all combinations of two swing highs and two swing lows.
It computes a slope for the high line and a slope for the low line and requires that they be nearly parallel within a user-defined tolerance.
3. Quality scoring and selection
For every valid candidate, the script checks the recent pivot segments against the trial channel and computes:
Inside ratio: fraction of tested pivots that sit fully inside the channel after applying the tolerance buffer.
Violation sum: total magnitude of the breaches for any pivots outside the channel.
Current width: distance between upper and lower lines at the current bar.
The “best” channel is chosen by:
1. highest inside ratio
2. then widest current width
3. then smallest violation sum
4. Plot and projection
The upper and lower lines are anchored to the chosen pivot pairs and extend to the left. The script also projects each line to the current bar to compute the live upper and lower channel prices. Those levels drive the breakout checks and alerts.
5. Breakouts and alerts
A breakout is detected when the bar closes above the projected upper line or closes below the projected lower line, after applying the tolerance buffer. Triangle markers highlight fresh breakouts, and you can enable alert conditions to automate notification or strategy handoff.
Inputs:
ZigZag
Price deviation for reversals (%)
Default 0.2. Larger values produce fewer, larger swings. Smaller values produce more, smaller swings.
Pivot legs
Default 2. Controls the lookback depth ZigZag uses to confirm pivots.
ZigZag Color
Visual only.
Tip: If you are not seeing a stable channel, increase the ZigZag percentage to reduce minor swings.
Channel search
Number of recent pivots to consider
Default 12. Higher values search more history and try more channel combinations. Lower values make the search faster and more reactive.
Max slope difference for parallel
Default 0.0005. Maximum allowed difference between the upper and lower line slopes. Smaller values enforce stricter parallelism.
Max price tolerance outside channel
Default 0.0. A buffer added to the channel boundaries during validation and breakout checks. Use this to ignore tiny wicks that poke the lines.
Minimum inside to outside pivots ratio for valid channel (0.00–1.00)
Default 1.00. Require that at least this fraction of checked pivots lie inside the channel. For a more permissive fit, try 0.60 to 0.85.
Styling
Upper Line Color
Lower Line Color
Breakout Above Color
Breakout Below Color
Plots and visuals
Upper channel line
Lower channel line
Triangle markers on the bar that first confirms a close outside the channel, above or below.
Lines extend left from their pivot anchors. Projection to the current bar is used internally to test for breakouts and to set alerts.
Alerts
The script defines two alert conditions:
Close Above Channel
Triggers when the bar closes above the projected upper line plus tolerance.
Close Below Channel
Triggers when the bar closes below the projected lower line minus tolerance.
Practical usage
Trend channels
In a steady trend, a high inside ratio with a moderate width often highlights the dominant channel. Consider trend entries near the lower line in an uptrend or near the upper line in a downtrend, with exits or stops beyond the opposite boundary.
Breakout trades
Combine the channel breakout alert with volume or a separate momentum filter. The tolerance input helps avoid false triggers from small wicks.
Tuning for timeframe and symbol
• Faster markets or lower timeframes usually benefit from a larger ZigZag percentage and a smaller pivot count.
• Slower markets or higher timeframes can use more pivots and a tighter slope difference to enforce cleaner geometry.
Notes and limitations
Channels are derived from ZigZag pivots. If your ZigZag settings change, the detected channel will also change.
The script plots only the single best channel at any time to keep the chart clean.
Breakout markers appear on confirmed bars. For historical bars, markers appear only where a breakout would have been confirmed at that time.
Lines extend left from their anchors. The script projects the lines internally to the current bar for checks and alerts.
License and attribution
License
Creative Commons Attribution-NonCommercial 4.0 International (CC BY-NC 4.0).
Open source for educational and personal use only. Commercial use requires written permission.
Attribution
© 2025 SciQua — Joshua Danford
Libraries
Uses TradingView/ZigZag/7.
Changelog
v1.0
Initial release. Automatic parallel channel detection from ZigZag pivots, quality scoring, live plotting, and close-based breakout alerts.
FAQ
Why do I not see any channel sometimes?
There may not be a valid pair of highs and lows that pass the slope, inside ratio, and tolerance checks. Loosen the constraints by increasing Max slope difference, lowering Minimum inside ratio, or increasing the ZigZag percentage.
The channel looks too narrow or too wide?
Adjust Number of recent pivots and Minimum inside ratio. A higher inside ratio tends to favor cleaner, sometimes wider channels. A lower ratio may admit narrower, more reactive channels.
How can I reduce false breakout alerts?
Increase Max price tolerance outside channel to ignore small wicks. Add a volume or momentum confirmation in your personal alert workflow.
Thank you for using Auto Channel . Feedback and improvements are welcome.
Autodraw

Nen Star Harmonic Pattern [TradingFinder] NenStar Reversal Auto🔵 Introduction
The Nen-Star Harmonic Pattern is an advanced reversal pattern in technical analysis, designed to identify market trend changes and predict key price reversal points. This pattern is defined by a combination of Fibonacci ratios and critical concepts such as Potential Reversal Zones (PRZ), market structure, and corrective waves.
The key points of this pattern include X, A, B, C, and D, and it appears in both bullish and bearish forms. In its bullish form, the pattern resembles the letter M, while in its bearish form, it takes the shape of W. The critical Fibonacci ratios for this pattern are 0.382 to 0.786 for the XA wave, 1.13 to 1.414 for the AB wave, and 1.272 to 2.618 for the BC wave.
The Nen-Star Harmonic Pattern is one of the most precise tools for identifying market reversals and executing reversal trades. Traders can use it to pinpoint optimal entry and exit points and benefit from high risk-to-reward ratios.
By emphasizing Fibonacci retracement levels, XABCD waves, the formation of bullish and bearish patterns, and precise trade entry points, this pattern has become a practical tool in advanced technical analysis.
Bullish Nen-Star Pattern :
Bearish Nen-Star Pattern :
🔵 How to Use
The Nen-Star Harmonic Pattern indicator allows traders to automatically identify the bullish and bearish structures of this pattern and locate optimal entry and exit points. By accurately analyzing Fibonacci ratios and determining points X, A, B, C, and D, the indicator highlights Potential Reversal Zones (PRZ) on the chart. Traders can rely on the generated signals to manage their trades with greater precision.
🟣 Bullish Nen-Star Pattern
The bullish Nen-Star pattern begins with a price increase from point X to point A, followed by a retracement to point B, which lies between 0.382 and 0.786 of the XA wave.
After this retracement, the price moves to point C, located between 1.13 and 1.414 of the AB wave. The final movement is a price decline to point D, which is between 1.272 and 2.618 of the BC wave and 1.13 to 1.272 of the XA wave.
Point D : Serves as the key Potential Reversal Zone (PRZ).
Entry : A buy trade is initiated at point D, signaling the end of the corrective movement and the beginning of a price increase.
Price Targets :
61.8% retracement of the CD wave
Point A
Point C
1.272 and 1.618 extensions of the CD wave if resistance at point C is broken
Stop Loss : Placed slightly below point D.
🟣 Bearish Nen-Star Pattern
The bearish Nen-Star pattern starts with a price decrease from point X to point A, followed by a retracement to point B, which lies between 0.382 and 0.786 of the XA wave.
After this retracement, the price moves to point C, located between 1.13 and 1.414 of the AB wave. The final movement is a price increase to point D, which is between 1.272 and 2.618 of the BC wave and 1.13 to 1.272 of the XA wave.
Point D : Serves as the key Potential Reversal Zone (PRZ).
Entry : A sell trade is initiated at point D, signaling the end of the corrective movement and the beginning of a price decline.
Price Targets :
61.8% retracement of the CD wave
Point A
Point C
1.272 and 1.618 extensions of the CD wave if support at point C is broken
Stop Loss : Placed slightly above point D.
🔵 Setting
🟣 Logical Setting
ZigZag Pivot Period : You can adjust the period so that the harmonic patterns are adjusted according to the pivot period you want. This factor is the most important parameter in pattern recognition.
Show Valid Forma t: If this parameter is on "On" mode, only patterns will be displayed that they have exact format and no noise can be seen in them. If "Off" is, the patterns displayed that maybe are noisy and do not exactly correspond to the original pattern.
Show Formation Last Pivot Confirm : if Turned on, you can see this ability of patterns when their last pivot is formed. If this feature is off, it will see the patterns as soon as they are formed. The advantage of this option being clear is less formation of fielded patterns, and it is accompanied by the latest pattern seeing and a sharp reduction in reward to risk.
Period of Formation Last Pivot : Using this parameter you can determine that the last pivot is based on Pivot period.
🟣 Genaral Setting
Show : Enter "On" to display the template and "Off" to not display the template.
Color : Enter the desired color to draw the pattern in this parameter.
LineWidth : You can enter the number 1 or numbers higher than one to adjust the thickness of the drawing lines. This number must be an integer and increases with increasing thickness.
LabelSize : You can adjust the size of the labels by using the "size.auto", "size.tiny", "size.smal", "size.normal", "size.large" or "size.huge" entries.
🟣 Alert Setting
Alert : On / Off
Message Frequency : This string parameter defines the announcement frequency. Choices include: "All" (activates the alert every time the function is called), "Once Per Bar" (activates the alert only on the first call within the bar), and "Once Per Bar Close" (the alert is activated only by a call at the last script execution of the real-time bar upon closing). The default setting is "Once per Bar".
Show Alert Time by Time Zone : The date, hour, and minute you receive in alert messages can be based on any time zone you choose. For example, if you want New York time, you should enter "UTC-4". This input is set to the time zone "UTC" by default.
🔵 Conclusion
The Nen-Star Harmonic Pattern is a highly effective analytical tool in global financial markets, playing a crucial role in identifying reversal points and market trend changes. By leveraging Fibonacci principles and price structure, this pattern enables precise analysis across various assets, including stocks, cryptocurrencies, forex, and commodities.
Traders operating in global markets can use this pattern to identify high risk-to-reward trading opportunities. Its clear entry and exit points, defined Potential Reversal Zones (PRZ), and accurate price targets make it an excellent tool for risk management and profitability enhancement.
In the global context, the Nen-Star pattern is widely used by professional analysts in both advanced and emerging markets due to its versatility in analyzing long-term and short-term charts. Beyond trend prediction, it enhances trading strategies and optimizes investment decisions.
Combining this pattern with complementary tools such as volume analysis, technical indicators, and macroeconomic conditions can provide traders with deeper market insights, helping them capitalize on global opportunities.

Auto Pivot Level Drawer [TipsChain]a pivot point is a price level that is used by traders as a possible indicator of market movement. A pivot point is calculated as an average of significant prices (high, low, close) from the performance of a market in the prior trading period. If the market in the following period trades above the pivot point it is usually evaluated as a bullish sentiment, whereas trading below the pivot point is seen as bearish .
Calculation
Several methods exist for calculating the pivot point (P) of a market. Most commonly, it is the arithmetic average of the high (H), low (L), and closing (C) prices of the market in the prior trading period:
P = (H + L + C) / 3.
Sometimes, the average also includes the previous period's or the current period's opening price (O):
P = (O + H + L + C) / 4.
In other cases, traders like to emphasize the closing price, P = (H + L + C + C) / 4, or the current periods opening price, P = (H + L + O + O) / 4.
Support and resistance levels
The first and most significant level of support (S1) and resistance (R1) is obtained by recognition of the upper and the lower halves of the prior trading range, defined by the trading above the pivot point (H − P), and below it (P − L). The first resistance on the up-side of the market is given by the lower width of prior trading added to the pivot point price and the first support on the down-side is the width of the upper part of the prior trading range below the pivot point .
R1 = P + (P − L) = 2×P − L
S1 = P − (H − P) = 2×P − H
Thus, these levels may simply be calculated by subtracting the previous low (L) and high (H) price, respectively, from twice the pivot point value:
The second set of resistance (R2) and support (S2) levels are above and below, respectively, the first set. They are simply determined from the full width of the prior trading range (H − L), added to and subtracted from the pivot point , respectively:
R2 = P + (H − L)
S2 = P − (H − L)
Commonly a third set is also calculated, again representing another higher resistance level (R3) and a yet lower support level (S3). The method of the second set is continued by doubling the range added and subtracted from the pivot point:
R3 = H + 2×(P − L) = R1 + (H − L)
S3 = L − 2×(H − P) = S1 − (H − L)
This concept is sometimes, albeit rarely, extended to a fourth set in which the tripled value of the trading range is used in the calculation.
Qualitatively, the second and higher support and resistance levels are always located symmetrically around the pivot point , whereas this is not the case for the first levels, unless the pivot point happens to divide the prior trading range exactly in half.

AB=CD Pattern_ULTRA V1 [NXT2017] Autodrawing Harmonic PatternPrivate indicator.
HI BIG PLAYERS AROUND THE WORLD,
this script allows to draw automatically lines of AB=CD Pattern . The AB=CD Pattern is part of Harmonic Pattern .
Parallel to the automatic drawing, the indicator can give signals as soon as the typically Fibonacci extension immediately reached or has been reached. This allows the indicator AB=CDPattern_ULTRA V1 to give early signals. In the default settings, the signals are displayed with a blue background on the chart.
NO REPAINT
As soon as the most points of the pattern are developed, the last point is a fix prediction without any repaints!
AB=CDPattern_ULTRA V1 is offered for sale. More information can be found below in the signature.
In the settings it is possible to change the degree of details. This is sometimes necessary because TradingView limited only 55 lines per indicator in Pinescript Version 4.
Furthermore, you can set a range how much bars back you want go from current bar for the automatic drawings. As default is setting 2000 bars back.
In extreme cases it is possible to change the settings to "lite" that the AB=CD Pattern represent waves only with 2 lines. This allows the indicator to detect far more AB=CD Pattern on the same chart.
For more great indicators everyone is invited to follow me on TradingView.
Kind regards
NXT2017

5-0 Pattern ULTRA V1 [NXT2017] Autodrawing Harmonic PatternPrivate indicator.
HI BIG PLAYERS AROUND THE WORLD,
this script allows to draw automatically lines of 5-0 Pattern . The 5-0 Pattern is part of Harmonic Pattern .
Parallel to the automatic drawing, the indicator can give signals as soon as the typically Fibonacci extension immediately reached or has been reached. This allows the indicator 5-0Pattern_ULTRA V1 to give early signals. In the default settings, the signals are displayed with a blue background on the chart.
NO REPAINT
As soon as the most points of the pattern are developed, the last point is a fix prediction without any repaints!
5-0Pattern_ULTRA V1 is offered for sale. More information can be found below in the signature.
In the settings it is possible to change the degree of details. This is sometimes necessary because TradingView limited only 55 lines per indicator in Pinescript Version 4.
In extreme cases it is possible to change the settings to "lite" that the 5-0 Pattern represent waves only with 2 lines. This allows the indicator to detect far more 5-0 Pattern on the same chart.
For more great indicators everyone is invited to follow me on TradingView.
Kind regards
NXT2017

Crab Pattern ULTRA V1 [NXT2017] Autodrawing Harmonic PatternPrivate indicator.
HI BIG PLAYERS AROUND THE WORLD,
this script allows to draw automatically lines of Crab Pattern . The Crab Pattern is part of Harmonic Pattern .
Parallel to the automatic drawing, the indicator can give signals as soon as the typically Fibonacci extension immediately reached or has been reached. This allows the indicator CrabPattern_ULTRA V1 to give early signals. In the default settings, the signals are displayed with a blue background on the chart.
NO REPAINT
As soon as the most points of the pattern are developed, the last point is a fix prediction without any repaints!
CrabPattern_ULTRA V1 is offered for sale. More information can be found below in the signature.
In the settings it is possible to change the degree of details. This is sometimes necessary because TradingView limited only 55 lines per indicator in Pinescript Version 4.
In extreme cases it is possible to change the settings to "lite" that the Crab Pattern represent waves only with 2 lines. This allows the indicator to detect far more Crab Pattern on the same chart.
For more great indicators everyone is invited to follow me on TradingView.
Kind regards
NXT2017

NenStar Pattern ULTRA V1 [NXT2017] Autodrawing Harmonic PatternPrivate indicator.
HI BIG PLAYERS AROUND THE WORLD,
this script allows to draw automatically lines of NenStar Pattern . The NenStar Pattern is part of Harmonic Pattern .
Parallel to the automatic drawing, the indicator can give signals as soon as the typically Fibonacci extension immediately reached or has been reached. This allows the indicator NenStarPattern_ULTRA V1 to give early signals. In the default settings, the signals are displayed with a blue background on the chart.
NO REPAINT
As soon as the most points of the pattern are developed, the last point is a fix prediction without any repaints!
NenStarPattern_ULTRA V1 is offered for sale. More information can be found below in the signature.
In the settings it is possible to change the degree of details. This is sometimes necessary because TradingView limited only 55 lines per indicator in Pinescript Version 4.
In extreme cases it is possible to change the settings to "lite" that the NenStar Pattern represent waves only with 2 lines. This allows the indicator to detect far more NenStar Pattern on the same chart.
For more great indicators everyone is invited to follow me on TradingView.
Kind regards
NXT2017
Another example:

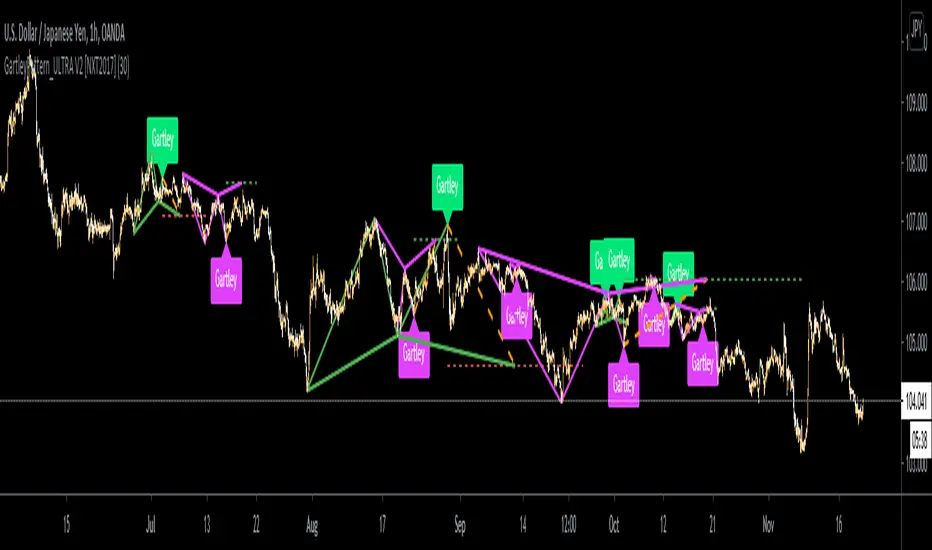
GartleyPattern_ULTRA V1 [NXT2017] Autodrawing Harmonic PatternPrivate indicator.
HI BIG PLAYERS AROUND THE WORLD,
this script allows to draw automatically lines of Gartley Pattern. The Gartley Pattern is part of Harmonic Pattern.
Parallel to the automatic drawing, the indicator can give signals as soon as the typically Fibonacci extension immediately reached or has been reached. This allows the indicator GartleyPattern_ULTRA V1 to give early signals. In the default settings, the signals are displayed with a blue background on the chart.
NO REPAINT
As soon as the most points of the pattern are developed, the last point is a fix prediction without any repaints!
GartleyPattern_ULTRA V1 is offered for sale. More information can be found below in the signature.
In the settings it is possible to change the degree of details. This is sometimes necessary because TradingView limited only 55 lines per indicator in Pinescript Version 4.
Furthermore, you can set a range how much bars back you want go from current bar for the automatic drawings. As default is setting 2000 bars back.
In extreme cases it is possible to change the settings to "lite" that the Gartley Pattern represent waves only with 2 lines. This allows the indicator to detect far more Gartley Pattern on the same chart.
For more great indicators everyone is invited to follow me on TradingView.
Kind regards
NXT2017
More Examples:
Elliott Wave - AutoCounting [NXT2017] draws the Wave 3 and 5HI BIG PLAYERS,
here's another indicator that I use pretty often.
The waves of Elliott Wave theory are automatically detected and displayed.
It makes it possible to count the Elliott waves almost always correctly and plausibly. However, the tool can only detect wave 3 as well as waves 5, A, B and C. The rest you have to draw yourself.
Sometimes the waves 3 and 5/A/B/C overlap - so I only use the view with wave 3 myself.
Kind regards
NXT2017

SharkPattern_ULTRA V1 - draws Shark Pattern inclusive alertsHI BIG PLAYERS AROUND THE WORLD,
this script allow to draw automatically lines of Shark Pattern. The Shark Pattern is part of Harmonic Pattern.
Parallel to the automatic drawing, the indicator can give signals as soon as the typically Fibonacci extension immediately reached or has been reached. This allows the indicator SharkPattern_ULTRA V1 to give early signals. In the default settings, the signals are displayed with a blue background on the chart.
SharkPattern_ULTRA V1 is offered for sale. More information can be found below in the signature.
However, anyone can test this indicator for once without any registration in a 3 day trial. You can request access with a simple message to me.
Another trial of 7 days is included in the offer on my website - before the first payment will done.
In the settings it is possible to change the degree of details. This is sometimes necessary because TradingView limited only 55 lines per indicator in Pinescript Version 4.
In extreme cases it is therefore possible to change the settings that the Shark Pattern represent waves only with 2 lines. This allows the indicator to detect far more Shark Pattern on the same chart.
For more great indicators everyone is invited to follow me on TradingView.
Kind regards
NXT2017

BatPattern_ULTRA V1 - draws Bat Pattern inclusive alertsHI BIG PLAYERS AROUND THE WORLD,
this script allow to draw automatically lines of Bat Pattern . The Bat Pattern is part of Harmonic Pattern .
Parallel to the automatic drawing, the indicator can give signals as soon as the typically Fibonacci extension immediately reached or has been reached. This allows the indicator BatPattern_ULTRA V1 to give early signals. In the default settings, the signals are displayed with a blue background on the chart.
BatPattern_ULTRA V1 is offered for sale. More information can be found below in the signature.
However, anyone can test this indicator for once without any registration in a 3 day trial. You can request access with a simple message to me.
Another trial of 7 days is included in the offer on my website - before the first payment will done.
In the settings it is possible to change the degree of details. This is sometimes necessary because TradingView limited only 55 lines per indicator in Pinescript Version 4.
In extreme cases it is therefore possible to change the settings that the Bat Pattern represent waves only with 2 lines. This allows the indicator to detect far more Bat Pattern on the same chart.
For more great indicators everyone is invited to follow me on TradingView.
Kind regards
NXT2017

B3 AutoEdgeBreak FibonacciHere is the lazy person's Fibonacci retracement drawing machine. Keep the bars in range pretty big, but you can play around and see what it does. If too small, it gets in your way, and If oversized, your retracements will not properly work upward and downward according to action. So, if you notice that it's always retracing the same direction, then lower the first input.
Now on top of the coding being tricky because of massive history in T-view, trading the Fibs is not an easy task either. Experienced Fib traders will probably love my script, and those that are not good at Fibs will love the historical look of it, but feel helpless in real-time. It took me years to learn a reaction pattern to the Fib lines, and the one key piece of my memory: if a price-line test comes and fails in relation to your trade, get out!!! <- Not real advice, just experience talking.
I expect to be upgrading this particular script in the future. Enjoy!
