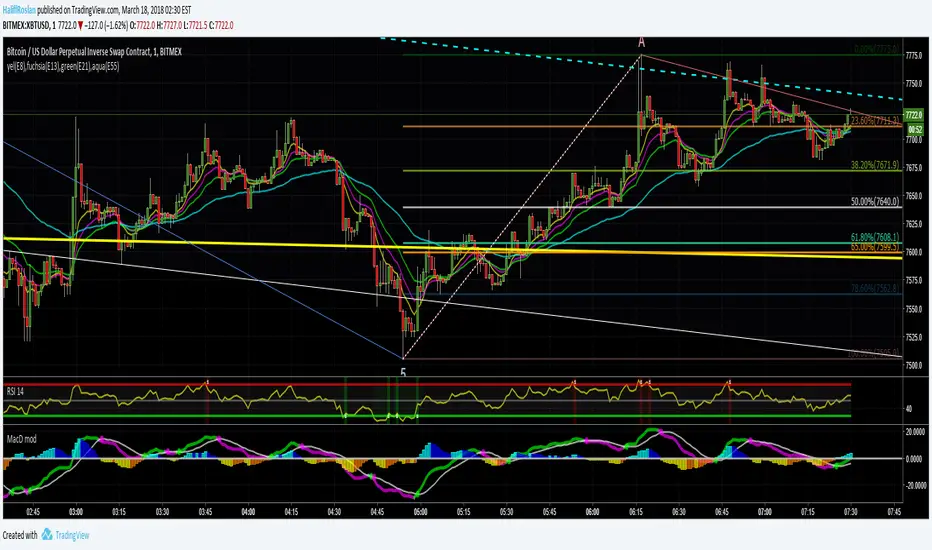
Quad EMAAllow multiple moving averages to be displayed without needing to use up multiple charting indicators individually
yellow(Ema8),fuchsia(Ema13),green(Ema21),aqua(Ema55)
Average
VolumeThis is an OBV (On Balance Volume) with two different moving averages on it plus a bollinger band set to OBV to find the squeeze and expansion points on OBV. As you many know, OBV is one of those indicators that can show you the volume and not only that but also the direction that volume is going.

Always show daily EMAThis script will always plot the daily EMA regardless of which timeframe you are on.

All of BTC (Average BTC price)A script to give average price across multiple exchanges(for now only USD) v1(Bitstamp,Bitfinex,Coinbase) and plot as candles that can be adjusted to current currency (via exchange rate)
please comment if you want your exchange added and what foreign exchanges should be averaged first(japan?,china??,korea??!!,mexico???!!)
Whats in future versions?
Add Look at volume to give weight to average function
auto exchange rates?
strategy!!??
pretty colors?
please drop any suggestions below
//insert donation info//
if i helped you in anyway feel free to donate to=
BTC: 37e8WqB9hmDwZN9jJDp2yj5B32CqrEzvjw
ETH: 0x45c5e69028924772bf15092236f33c1e07cee97c
LTC: MJVNYkW4NGubZACaX3wNJcVJjJS7Yr6Hok
As im in the amazing contry know as mexico and use the very valuable MXN it takes very little to help alot
//end shameless donation info//
and for those of you wondering yes i have inverted the colors of the candles intentionally... you can edit them from the script settings

DayMidPointDayMidPoint - Plot the moving average of the Daily price midpoint for short periods of time (i.e. 3 day or 5 day). Great for detecting the short term daily trend direction to determine a SHORT or LONG position building in a stock. Use with DayHigh and DayLow indicators. for nice price channels on a chart.

DayHigh - Plot the Moving Average of the Daily HighPlot the Moving Average of the Daily High for short periods of time (i.e 3 day or 5 day). Great for detecting when a stocks SELL pressure is running out and time to switch to a BUY strategy. Use in the DayHIGH indicator for nice price channels on a chart.
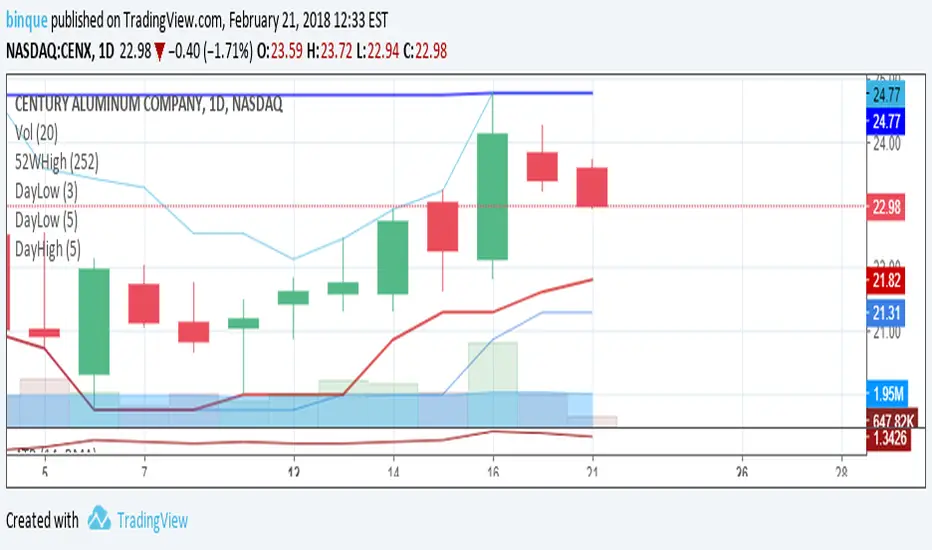
DayLow - Chart the Moving Average of the DAILY LOW PriceThis is a moving average of the Daily LOW Price over a short period of time (i.e. 3 day low moving average, etc...) Great for tracking trailing stops for a stock on an up swing.

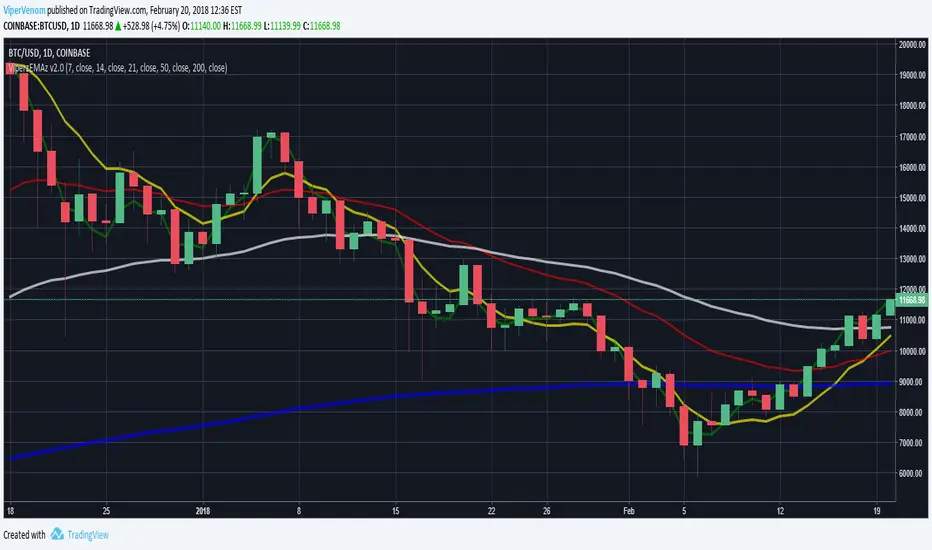
Viperz Super EMA Mix v2.0Hello friends,
Welcome to Viperz Super EMA Mix v2.0!!!
v2.0: Added TEMA source as an input, so the default value can be changed. I also Added a full description of Viperz Super EMA Mix below.
I have created a multi-layered Exponential Moving Average chart indicator, called Viperz Super EMA Mix. This is used to measure momentum of market trends. I had Bitcoin/Crypto trading in mind while creating it. Here is a breakdown of the different moving averages included, their default values and the reasoning behind why they were chosen.
First, we have the most reactive EMA, which is a Triple EMA, or TEMA. The TEMA smooths price fluctuations and filters out more volatility than a traditional EMA. Therefore, I have chosen that as the green line which will be nearest to the current price. I used TEMA here, so it will help filter out some of the noise on the most reactive EMA on this indicator. I have chosen 7 as the default for length, since that is a week. I chose the color green because I am using a stop light theme to make it easy for myself, and hopefully, for others to remember. All you have to remember for color order is Green > Yellow > Red. If the green is above yellow and yellow is above red lines, then current trend is bullish.
Secondly, we have the next most reactive EMA, which is a Double EMA, or DEMA. The DEMA is a fast-acting moving average that is more responsive to market changes than a traditional moving average. The TEMA and DEMA will react with each other the most on the charts, since their default values are nearest each other and use smaller lengths. I chose them to be the first 2 EMAs, in a "reverse order", so that the noise filtering is done slightly more on the shorter EMAs with more volatility. I chose 14 as default on the DEMA, since that is 2 weeks. I choose the color yellow to stick with my stop light theme (green better then yellow better than red).
Third, we have a less reactive regular EMA, set at length 21. This represents 3 weeks and uses the color red. If green and yellow are below the red lines, then the trend is bearish.
Lastly, I included the 50 day and 200 day EMAs, because they very commonly used for Bitcoin trading. I could try to explain it, but they do a better job of explaining why 50 and 200 day EMAs are used if you check this article here: cointelegraph.com
The color chosen for the 50 day was white and 200 day was blue. This is also so it's easy for me to remember (America, red, white and blue). Here is the full color scheme order: Green, Yellow, Red, White, Blue.
*** Just remember traffic lights first on smaller time frames (1 - 4 Hour time frames) and American flag for larger time frames (Daily to Weekly time frames) and you'll be recognizing the color scheme easily at a glance in no time!
If you don't agree on any of the default values I have chosen, then I have made it so you can change the length or source input values to anything you want for each moving average. You can also adjust the coloring and size of the EMA's bands.
If you find different default values that you like and you want me to make a special version for you, please send me a personal message. I appreciate the likes and follows. :)
TLDR: This should be used as a momentum indicator while market trading. The easiest way to remember how to recognize the market trend using my color scheme is to think of a stop light. Green, yellow, then red. The last are red, white and blue, like the American flag. If the order of the colors is green, yellow, red, white, blue, then the market is strongly trending bullish. It is opposite for bearish trend. Traffic lights (green/yellow/red) work the best on smaller time frames (Hourlys) and American flag (red/white/blue) for larger time frames (daily-weekly). All default input values and sources can be changed for each EMA.
Thank you, enjoy!


BTC Price Spread - Coinbase & Futs - Premiums & DiscountsThis indicator takes the price of Bitcoin on Coinbase and the futures price on Mex, and compares it the average price of Bitcoin across other major exchanges.
This essentials give us a spread at which Bitcoin is going for.
In turn, this could be a possible tool to help determine market sentiment.
This indicator was created for experimental purposes.
Use at your own digression.


3SMAThis script plots three Simple Moving Averages instead of just one.
Support me going through grad school!
www.linkedin.com
BTC tip jar: 1Mv1s7nLaTsRoLai5WXEGg8doisXuiPUXy
ETH tip jar: 0x6113DDD23D0D5aCad3d1f8640A8A571E9Cb86cB8
LTC tip jar: LYvyoqTSWxa22TQw3E7818xy4AfYNi6xcm
BCH tip jar: 1GC7oZ7MhLkamKCDdZFnUfV21SKWq84VdY

Multidema - Multiple Double EMA
Finally a multiDEMA indicator!
You can set up to 4 Double exponential moving average at the same time with one indicator
I use it as a reference to see on what DEMA the price is reacting
Code is protected but the use is FREE for anyone!
ENJOY!

Currency StrengthRepublished: The original script violated house rules by including an external link to Backtest Rookies.
Background
The currency strength indicator takes up to 4 forex pairs and calculates the average strength across all pairs. The indicator uses the pair's daily percentage change to calculate the overall strength. For flexibility, it can accept any instrument as an input. This means you can use multiple instances to track various currency strengths. It was designed with the major pairs in mind but there is no reason why it cannot be used for other FX pairs.
Note: The indicator defaults to GBP. When setting it up for other currencies, be sure to flag whether the currency is a counter currency or not.
The code is provided free and open source. Please modify it as you see fit.
Screenshots
Defaults with Annotation
Yen strength beating pound strength
Opposing Trends

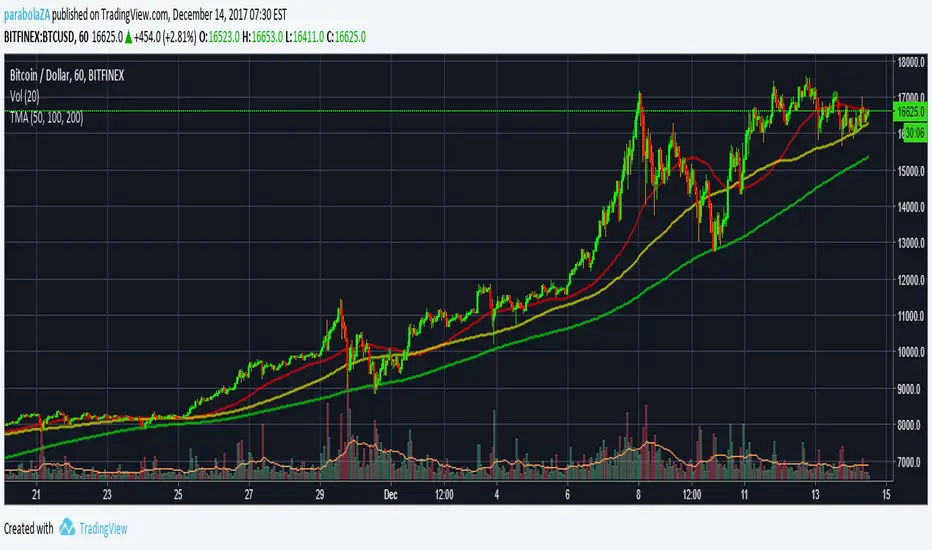
Triple MASuper simple.
Three simple moving averages all in a single indicator for your convenience.
Default values:
MA 1 - 20
MA 2 - 50
MA 3 - 100
If you like this or any of my other scripts - please consider chucking some BTC my way ;) 1LbFxAYJSVPxirT8eW31QHaGbySHyPYgMq

Combo Indicator V2This is an updated version of the Combo Indicator I previously published. It combines Bollinger Bands, 3 moving averages and 1 exponential moving average all into one chart. I use this indicators on most of my charts so wanted an easy way of combining them all.
SPECIAL BONUS
This indicator also includes a common Bollinger Band trading strategy built in. It was developed with options trading in mind for members over at OptionsPlayers.com. It tries to detect when the BB tunnel tightens, and then triggers an entry position when it detects the breakout. No strategy is 100% accurate, and there are some false positives, but it seems to work fairly well. However, do your own due diligence and use at your own risk.
The strategy can be turned on using a checkbox in the properties.


Average Daily Range - without open barBasic ADR-indicator that is showing the daily range on lower timeframes as well, without using the current open daily bar for calculation.
Also plots as line in a separate indicator window. Updates displayed value when hovering over the candles on the chart to see historical Numbers.
