ATR+CCI Monetary Risk Tool - TP/SL⚙️ ATR+CCI Monetary Risk Tool — Volatility-aware TP/SL & Position Sizing
Exact prices (no rounding), ATR-percentile dynamic stops, and risk-budget sizing for consistent execution.
🧠 What this indicator is
A risk-first planning tool. It doesn’t generate orders; it gives you clean, objective levels (Entry, SL, TP) and position size derived from your risk budget. It shows only the latest setup to keep charts readable, and a compact on-chart table summarizing the numbers you actually act on.
✨ What makes it different
Dynamic SL by regime (ATR percentile): Instead of a fixed multiple, the SL multiplier adapts to the current volatility percentile (low / medium / high). That helps avoid tight stops in noisy markets and over-wide stops in quiet markets.
Risk budgeting, not guesswork: Size is computed from Account Balance × Max Risk % divided by SL distance × point value. You risk the same dollars across assets/timeframes.
Precision that matches your instrument: Entry, TP, SL, and SL Distance are displayed as exact prices (no rounding), truncated to syminfo.mintick so they align with broker/exchange precision.
Symbol-aware point value: Uses syminfo.pointvalue so you don’t maintain tick tables.
Non-repaint option: Work from closed bars to keep the plan stable.
🔧 How to use (quick start)
Add to chart and pick your timeframe and symbol.
In settings:
Set Account Balance (USD) and Max Risk per Trade (%).
Choose R:R (1:1 … 1:5).
Pick ATR Period and CCI Period (defaults are sensible).
Keep Dynamic ATR ON to adapt SL by regime.
Keep Use closed-bar values ON to avoid repaint when planning.
Read the labels (Entry/TP/SL) and the table (SL Distance, Position Size, Max USD Risk, ATR Percentile, effective SL Mult).
Combine with your entry trigger (price action, levels, momentum, etc.). This indicator handles risk & targets.
📐 How levels are computed
Bias: CCI ≥ 0 ⇒ long, otherwise short.
ATR Percentile: Percent rank of ATR(atrPeriod) over a lookback window.
Effective SL Mult:
If percentile < Low threshold ⇒ use Low SL Mult (tighter).
If between thresholds ⇒ use Base SL Mult.
If percentile > High threshold ⇒ use High SL Mult (wider).
Stop-Loss: SL = Entry ± ATR × SL_Mult (minus for long, plus for short).
Take-Profit: TP = Entry ± (Entry − SL) × R (R from the R:R dropdown).
Position Size:
USD Risk = Balance × Risk%
Contracts = USD Risk ÷ (|Entry − SL| × PointValue)
For futures, quantity is floored to whole contracts.
Exact prices: Entry/TP/SL and SL Distance are not rounded; they’re truncated to mintick so what you see matches valid price increments.
📊 What you’ll see on chart
Latest Entry (blue), TP (green), SL (red) with labels (optional emojis: ➡️ 🎯 🛑).
Info Table with:
Bias, Entry, TP, SL (exact, truncated to mintick)
SL Distance (exact, truncated)
Position Size (contracts/units)
Max USD Risk
Point Value
ATR Percentile and effective SL Mult
🧪 Practical examples
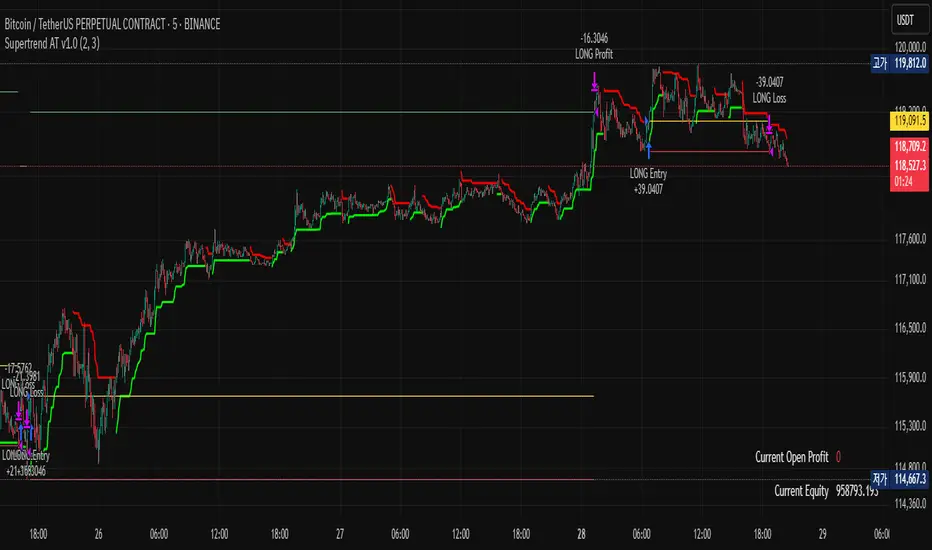
High-volatility session (e.g., XAUUSD, 1H): ATR percentile is high ⇒ wider SL, smaller size. Reduces churn from normal noise during macro events.
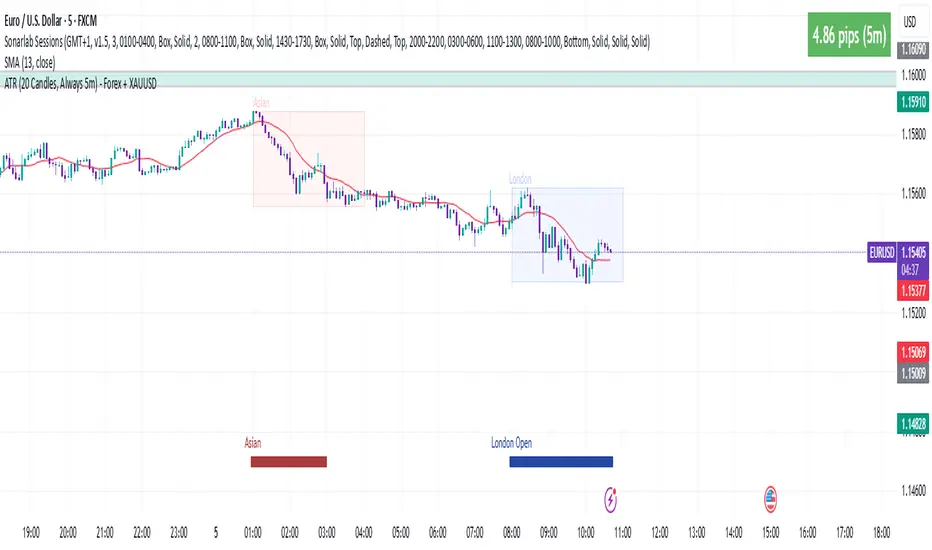
Range-bound market (e.g., EURUSD, 4H): ATR percentile low ⇒ tighter SL, better R:R. Helps you avoid carrying unnecessary risk.
Index swing planning (e.g., ES1!, Daily): Non-repaint levels + risk budgeting = consistent sizing across days/weeks, easier to review and journal.
🧭 Why traders should use it
Consistency: Same dollar risk regardless of instrument or volatility regime.
Clarity: One-trade view forces focus; you see the numbers that matter.
Adaptivity: Stops calibrated to the market’s current behavior, not last month’s.
Discipline: A visible checklist (SL distance, size, USD risk) before you hit buy/sell.
🔧 Input guide (practical defaults)
CCI Period: 100 by default; use as a bias filter, not an entry signal.
ATR Period: 14 by default; raise for smoother, lower for more reactive.
ATR Percentile Lookback: 200 by default (stable regime detection).
Percentile thresholds: 33/66 by default; widen the gap to change how often regimes switch.
SL Mults: Start ~1.5 / 2.0 / 2.5 (low/base/high). Tune by asset.
Risk % per trade: Common pro ranges are 0.25–1.0%; adjust to your risk tolerance.
R:R: Start with 1:2 or 1:3 for balanced skew; adapt to strategy edge.
Closed-bar values: Keep ON for planning/live; turn OFF only for exploration.
💡 Best practices
Combine with your entry logic (structure, momentum, liquidity levels).
Review ATR percentile and effective SL Mult across sessions so you understand regime shifts.
For futures, remember size is floored to whole contracts—safer by design.
Journal trades with the table snapshot to improve risk discipline over time.
⚠️ Notes & limitations
This is not a strategy; it does not place orders or alerts.
No slippage/commissions modeled here; build a strategy() version for backtests that mirror your broker/exchange.
Displayed non-price metrics use two decimals; prices and SL Distance are exact (truncated to mintick).
📎 Disclaimer
For educational purposes only. Not financial advice. Markets involve risk. Test thoroughly before trading live.
مؤشر Pine Script®