[Volatility] [Gain & Loss] - OverviewFX:EURUSD
Indicator Overview: Volatility & Gain/Loss - Forex Pair Analysis
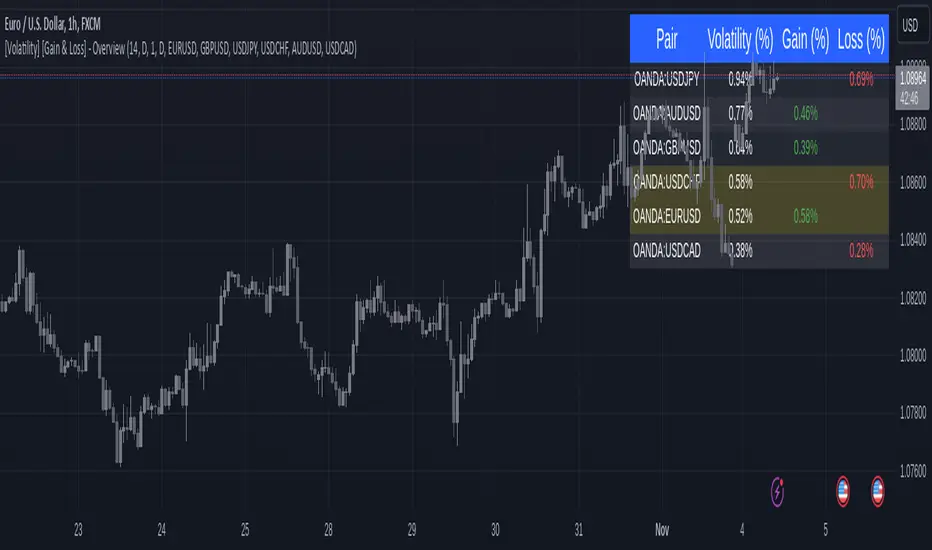
This indicator, " —Overview" , is designed for users interested in analyzing the volatility and gain/loss metrics of multiple forex pairs. The tool is especially useful for traders aiming to assess currency pair volatility alongside gain and loss percentages over selected periods. It enables a clearer understanding of pair behavior and aids in decision-making.
Key Features
Customizable Volatility and Gain/Loss Periods : Define your preferred calculation periods and timeframes for both volatility and gain/loss to tailor the indicator to specific trading strategies. Multi-Pair Analysis : This indicator supports up to six forex pairs (default pairs include EURUSD, GBPUSD, USDJPY, USDCHF, AUDUSD, and USDCAD) and allows you to adjust these pairs as needed. Visual Ranking : Forex pairs are sorted by volatility, displaying the highest pairs at the top for quick reference. Top Gain/Loss Highlighting : The pair with the maximum gain and the pair with the maximum loss are highlighted in the table, making it easy to identify the best and worst performers at a glance.
Indicator Settings
Volatility Settings : Period : Adjust the number of periods used in the ATR (Average True Range) calculation. A default period of 14 is set. Timeframe : Select a timeframe (e.g., Daily, Weekly) for volatility calculation to match your analysis preference.
Gain/Loss Settings : Period : Choose the number of periods for gain/loss calculation. The default is set to 1. Timeframe : Select the timeframe for gain/loss calculation, independent of the volatility timeframe.
Symbol Selection : Configure up to six forex pairs. By default, popular forex pairs are pre-loaded but can be customized to include other currency pairs.
Output and Visualization
Table Display : This indicator displays data in a neatly structured table positioned in the top-right corner of your chart. Columns : Includes columns for the Forex Pair, Volatility Percentage, Gain Percentage, and Loss Percentage. Color Coding : Volatility is displayed in a standard color for clear readability. Gain values are highlighted in green, and Loss values are highlighted in red, allowing for quick visual differentiation. Highlighting : Rows representing the pair with the highest gain and the pair with the most significant loss are especially highlighted for emphasis.
How to Use
Volatility Analysis : This metric gives insight into the average price range movements for each pair over the specified period and timeframe, helping you evaluate the potential for rapid price changes. Gain/Loss Tracking : Gain or loss percentages show the pair's recent performance, allowing you to observe whether a currency pair is trending positively or negatively over the chosen period. Comparative Pair Ranking : Use the table to identify pairs with the highest volatility and extremes in gain or loss to guide trading decisions based on market conditions.
Ideal For
Swing Traders and Day Traders looking to understand short-term market fluctuations in currency pairs. Risk Management : Helps traders gauge pairs with higher risk (volatility) and recent performance (gain/loss) for informed position sizing and risk control.
This indicator is a comprehensive tool for visualizing and analyzing key forex pairs, making it an essential addition for traders looking to stay updated on volatility trends and recent price changes.
متوسط المدى الحقيقي
Entropy-Based Adaptive SuperTrendOverview:
Introducing the Entropy-Based Adaptive SuperTrend – a groundbreaking trading indicator designed to adapt dynamically to market conditions using market entropy. This enhanced SuperTrend indicator adjusts its sensitivity according to the level of chaos (or order) in price movements, providing more stable signals during volatile periods and more responsive signals when the market becomes orderly.
Key Features:
Entropy-Adaptive Mechanism: By incorporating an entropy measure, this indicator estimates the degree of unpredictability in the market. During high entropy periods (more chaotic), signals are made less sensitive, while during low entropy periods, the indicator reacts more quickly to price changes.
Adaptive ATR Multiplier: Unlike traditional SuperTrend indicators that use a fixed ATR multiplier, this version calculates a dynamic ATR multiplier based on the entropy score, ensuring more flexibility and adaptability in setting stop levels.
Visual Clarity: The indicator is overlayed on the price chart with customizable visual elements. The bullish and bearish trends are color-coded for ease of use, and optional entry signals ("L" for long and "S" for short) are plotted to clearly mark potential entry opportunities.
Alerts for Key Opportunities : Never miss an opportunity with built-in alerts for buy and sell signals. Traders can easily configure these alerts to be notified instantly when market conditions trigger a new trend.
How It Works:
Entropy Calculation: The entropy of the price data is calculated over a user-defined period, giving an indication of the degree of randomness in the price movements. The result is then smoothed to reduce noise and create a meaningful trend indication.
Dynamic ATR Adjustment: The ATR (Average True Range) multiplier, which controls the distance of the trailing stop, is adjusted based on the entropy score. This allows the SuperTrend line to widen in chaotic times, reducing false signals, while tightening in orderly times, allowing quicker trend captures.
Parameters Explained:
Entropy Settings: Control the sensitivity of entropy calculations, including the look-back period, number of bins for price distribution, and smoothing length.
Adaptive Settings: Adjust how the indicator adapts to different levels of entropy, including the adaptation period and the filtering weight.
SuperTrend Settings : Customize the ATR period and the dynamic multiplier range to fine-tune the trailing stops for your trading style.
Visual Settings: Choose your preferred colors for bullish and bearish trends, and decide if you want the entry labels displayed directly on the chart.
Use Cases:
Swing Traders can utilize the indicator to capture trend reversals while filtering out the noise during high entropy periods.
Intraday Traders can adapt the settings for shorter time frames to benefit from dynamic adjustments that reduce overtrading and false signals.
Risk Management: The entropy-based adaptive feature provides an edge in risk management by reducing sensitivity during times of increased chaos, thus helping to limit unnecessary trades.
How to Use It:
Look for entry labels ("L" for long, "S" for short) to identify potential opportunities.
Use the color-coded trendlines to determine market bias: greenish hue for bullish trends, reddish hue for bearish trends.
Customize the input settings to align with your preferred market timeframe and risk profile.
Alerts & Notifications:
Built-in alerts notify you of significant trend changes. Simply enable these alerts to receive updates when a new long or short opportunity is detected, helping you stay ahead without needing to watch the screen constantly.
Customization Tips:
Longer Timeframes : Increase the Entropy Period to better capture macro trends in high timeframe charts.
Higher Volatility Markets: Increase the ATR Max Multiplier to ensure stops are set farther away during high entropy.
Lower Volatility Markets: Use a lower ATR Base Multiplier and tighter entropy thresholds to capture rapid price movements.
Final Thoughts:
The Entropy-Based Adaptive SuperTrend indicator merges traditional trend-following logic with an adaptive mechanism driven by market entropy, aiming to address the challenges of whipsaws and false signals common in conventional SuperTrend setups. This indicator offers an intelligent and flexible way to track market trends, suitable for both beginners and experienced trade

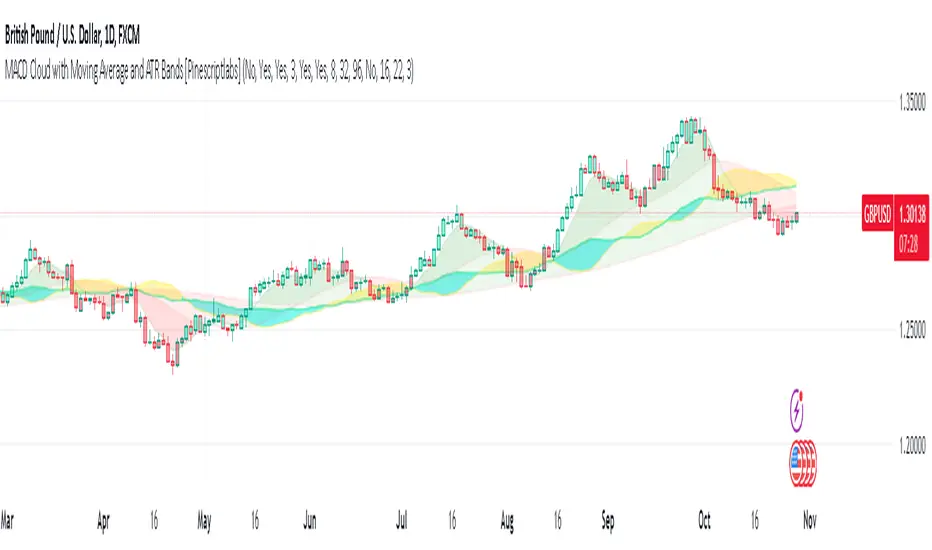
MACD Cloud with Moving Average and ATR BandsThe algorithm implements a technical analysis indicator that combines the MACD Cloud, Moving Averages (MA), and volatility bands (ATR) to provide signals on market trends and potential reversal points. It is divided into several sections:
🎨 Color Bars:
Activated based on user input.
Controls bar color display according to price relative to ATR levels and moving average (MA).
Logic:
⚫ Black: Potential bearish reversal (price above the upper ATR band).
🔵 Blue: Potential bullish reversal (price below the lower ATR band).
o
🟢 Green: Bullish trend (price between the MA and upper ATR band).
o
🔴 Red: Bearish trend (price between the lower ATR band and MA).
o
📊 MACD Bars:
Description:
The MACD Bars section is activated by default and can be modified based on user input.
🔴 Red: Indicates a bearish trend, shown when the MACD line is below the Signal line (Signal line is a moving average of MACD).
🔵 Blue: Indicates a bullish trend, shown when the MACD line is above the Signal line.
Matching colors between MACD Bars and MACD Cloud visually confirms trend direction.
MACD Cloud Logic: The MACD Cloud is based on Moving Average Convergence Divergence (MACD), a momentum indicator showing the relationship between two moving averages of price.
MACD and Signal Lines: The cloud visualizes the MACD line relative to the Signal line. If the MACD line is above the Signal line, it indicates a potential bullish trend, while below it suggests a potential bearish trend.
☁️ MA Cloud:
The MA Cloud uses three moving averages to analyze price direction:
Moving Average Relationship: Three MAs of different periods are plotted. The cloud turns green when the shorter MA is above the longer MA, indicating an uptrend, and red when below, suggesting a downtrend.
Trend Visualization: This graphical representation shows the trend direction.
📉 ATR Bands:
The ATR bands calculate overbought and oversold limits using a weighted moving average (WMA) and ATR.
Center (matr): Shows general trend; prices above suggest an uptrend, while below indicate a downtrend.
Up ATR 1: Marks the first overbought level, suggesting a potential bearish reversal if the price moves above this band.
Down ATR 1: Marks the first oversold level, suggesting a possible bullish reversal if the price moves below this band.
Up ATR 2: Extends the overbought range to an extreme, reinforcing the possibility of a bearish reversal at this level.
Down ATR 2: Extends the oversold range to an extreme, indicating a stronger bullish reversal possibility if price reaches here.
Español:
El algoritmo implementa un indicador de análisis técnico que combina la nube MACD, promedios móviles (MA) y bandas de volatilidad (ATR) para proporcionar señales sobre tendencias del mercado y posibles puntos de reversión. Se divide en varias secciones:
🎨 Barras de Color:
- Activado según la entrada del usuario.
- Controla la visualización del color de las barras según el precio en relación con los niveles de ATR y el promedio móvil (MA).
- **Lógica:**
- ⚫ **Negro**: Reversión bajista potencial (precio por encima de la banda superior ATR).
- 🔵 **Azul**: Reversión alcista potencial (precio por debajo de la banda inferior ATR).
- 🟢 **Verde**: Tendencia alcista (precio entre el MA y la banda superior ATR).
- 🔴 **Rojo**: Tendencia bajista (precio entre la banda inferior ATR y el MA).
### 📊 Barras MACD:
- **Descripción**:
- La sección de barras MACD se activa por defecto y puede modificarse según la entrada del usuario.
- 🔴 **Rojo**: Indica una tendencia bajista, cuando la línea MACD está por debajo de la línea de señal (la línea de señal es una media móvil de la MACD).
- 🔵 **Azul**: Indica una tendencia alcista, cuando la línea MACD está por encima de la línea de señal.
- La coincidencia de colores entre las barras MACD y la nube MACD confirma visualmente la dirección de la tendencia.
### 🌥️ Nube MACD:
- **Lógica de la Nube MACD**: Basada en el indicador de convergencia-divergencia de medias móviles (MACD), que muestra la relación entre dos medias móviles del precio.
- **Líneas MACD y de Señal**: La nube visualiza la relación entre la línea MACD y la línea de señal. Si la línea MACD está por encima de la de señal, indica una tendencia alcista potencial; si está por debajo, sugiere una tendencia bajista.
### ☁️ Nube MA:
- **Relación entre Medias Móviles**: Se trazan tres medias móviles de diferentes períodos. La nube se vuelve verde cuando la media más corta está por encima de la más larga, indicando una tendencia alcista, y roja cuando está por debajo, sugiriendo una tendencia bajista.
- **Visualización de Tendencias**: Proporciona una representación gráfica de la dirección de la tendencia.
### 📉 Bandas ATR:
- Las bandas ATR calculan límites de sobrecompra y sobreventa usando una media ponderada y el ATR.
- **Centro (matr)**: Muestra la tendencia general; precios por encima indican tendencia alcista y debajo, bajista.
- **Up ATR 1**: Marca el primer nivel de sobrecompra, sugiriendo una reversión bajista potencial si el precio sube por encima de esta banda.
- **Down ATR 1**: Marca el primer nivel de sobreventa, sugiriendo una reversión alcista potencial si el precio baja por debajo de esta banda.
- **Up ATR 2**: Amplía el rango de sobrecompra a un nivel extremo, reforzando la posibilidad de reversión bajista.
- **Down ATR 2**: Extiende el rango de sobreventa a un nivel extremo, sugiriendo una reversión alcista más fuerte si el precio alcanza esta banda.
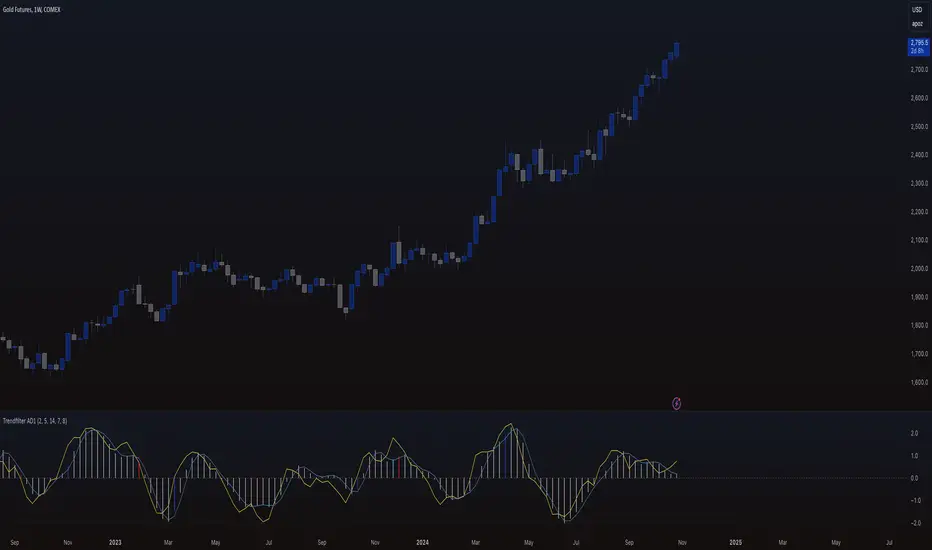
Trendfilter AD1
The "Trendfilter AD1" indicator is a versatile tool for trend detection that combines volume changes, price ranges, ATR (Average True Range), and moving averages. It also considers the momentum of True High/Low over a specified period (PROFF). The indicator integrates various mathematical calculations to measure market trends and volatility. Key features include the use of Powerbar colors, which indicate significant activity from large market participants.
Trendfilter LW
The Trendfilter LW section of the script calculates trend strength by comparing short-term and long-term simple moving averages (SMA) of closing prices, and by assessing cumulative price differences. The result is displayed as a histogram, with positive values indicating bullish trends and negative values indicating bearish trends. This helps traders visualize the strength and direction of long-term and short-term trends.
Trendfilter SP
The Trendfilter SP section combines volume changes, ATR data, and Z-score calculations to smooth out trend signals and provide a clearer assessment of market trends. It uses these data points to filter out noise and highlight significant trend changes. The combined Z-score, smoothed by an EMA, offers precise trend indications and helps traders identify whether the prevailing market forces are bullish or bearish.
What is it for?
The indicator helps traders identify trends and assess market volatility. By combining volume and price movements, it highlights potential trend reversals and shifts in market strength. The calculation of True High/Low (PROFF) measures market momentum over a set period, providing insights into price dynamics. The indicator also uses color-coded bars to represent different levels of market activity and trend strength, with Powerbar colors specifically highlighting major market moves driven by large traders.
How is it used?
Traders can customize the indicator through settings such as Volume Change Periods, EMA periods, and the True High/Low period (PROFF). The indicator generates signals based on significant volume and price fluctuations, with trends displayed through color-coded bars. The Trendfilter LW section calculates trend strength using SMA and cumulative price differences, while the Trendfilter SP section combines volume and ATR data with Z-score calculations to smooth out trend signals. These elements together provide a clear picture of market direction and strength.
Atr Target TP & Protecion Zone [Pinescriptlabs]This indicator provides an adaptive trailing stop system with dynamic price targets and protection zones, ideal for position management.
Main Features:
🚦 ADAPTIVE TRAILING STOP:
Automatically adjusts based on volatility (ATR) and volume
Two modes: "Modified" and "UnModified" for true range calculation
Displayed as a line with colored background (green for longs, red for shorts)
🎯 TARGET ZONES (T1 & T2):
Calculates two target zones (T1 and T2) based on:
Market strength (combination of RSI, volume, MFI, ADX, MACD)
Current volatility (ATR)
Distance from current price
Visualized with blue boxes (T1) and purple boxes (T2)
🛡️ PROTECTION ZONE:
Automatically activates in sideways markets
Provides an additional buffer to the trailing stop
Helps avoid premature exits in volatile markets
📊 INFORMATION PANELS:
Top Right Panel displays:
Current trend direction
Target status (T1 & T2)
Market strength
Current ATR
RSI level
Bottom Right Panel displays:
Trailing status (WIDE/NORMAL)
Volume impact
Directional strength
Protection zone status
Español:
Este indicador proporciona un sistema de trailing stop adaptativo con objetivos de precio dinámicos y zonas de protección, ideal para la gestión de posiciones.
**Características Principales**:
🚦 **TRAILING STOP ADAPTATIVO**:
- Se ajusta automáticamente según la volatilidad (ATR) y el volumen
- Dos modos: "Modified" y "UnModified" para el cálculo del rango verdadero
- Se visualiza como una línea con fondo coloreado (verde para largos, rojo para cortos)
🎯 **ZONAS OBJETIVO (T1 y T2)**:
- Calcula dos zonas objetivo (T1 y T2) basadas en:
- Fuerza del mercado (combinación de RSI, volumen, MFI, ADX, MACD)
- Volatilidad actual (ATR)
- Distancia al precio actual
- Visualización mediante cajas azules (T1) y moradas (T2)
🛡️ **ZONA DE PROTECCIÓN**:
- Se activa automáticamente en mercados laterales
- Proporciona un buffer adicional al trailing stop
- Ayuda a evitar salidas prematuras en mercados volátiles
📊 **PANELES INFORMATIVOS**:
*Panel Superior Derecho* muestra:
- Dirección de la tendencia actual
- Estado de los objetivos (T1 y T2)
- Fuerza del mercado
- ATR actual
- Nivel de RSI
*Panel Inferior Derecho* muestra:
- Estado del trailing (WIDE/NORMAL)
- Impacto del volumen
- Fuerza direccional
- Estado de la zona de protección

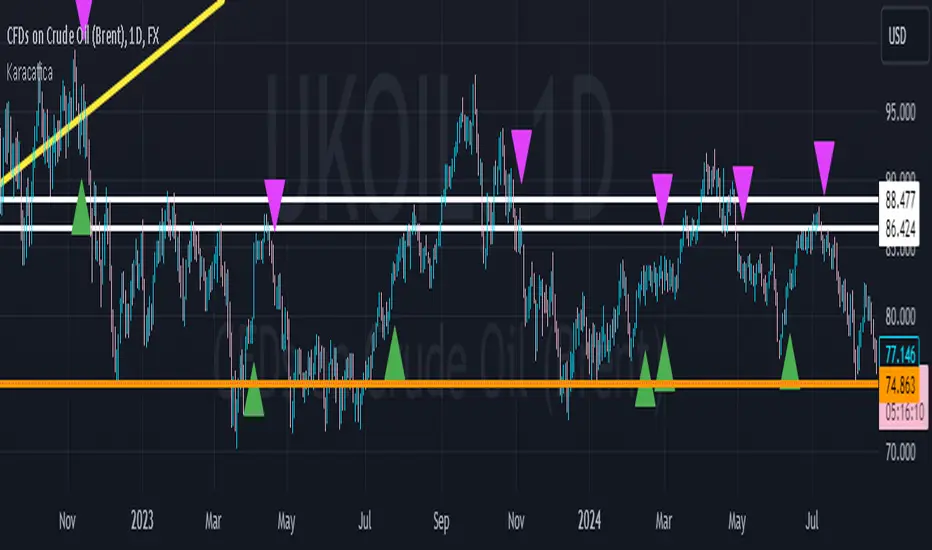
KaracaticaKaracatica Indicator - Dynamic Trend Following.
The Karacatica Indicator is designed for traders looking for a comprehensive approach to trend trading by combining directional movements and Average True Range (ATR).
Key Features: ATR-Based Trend Detection: The indicator uses Average True Range (ATR) to measure market volatility and integrates with price action to capture strong trend movements.
Directional Indicators (DI's): Calculates DI's (Positive Directional Index Di+ and Negative Directional Index Di-) to compare buying and selling pressure. This allows for more accurate trend identification, highlighting when buyers or sellers dominate.
Signal Generation: Buy Signal: Generated when price action is bullish (close is above the previous period's close) and DI+ exceeds DI-, indicating that buyers are in control.
Sell Signal: Triggered when price action is bearish (close is below the previous period’s close) and DI- exceeds DI+, showing that sellers dominate the market.
Visual Signals: Green triangle (▲) indicating a buy opportunity, plotted below the bar.
Fuchsia triangle (▼) signaling a sell opportunity, plotted above the bar.
Customizable Inputs: The indicator allows users to adjust the ATR period, DI length, and ADX smoothing parameters, giving it the flexibility to suit different trading styles and timeframes.
Why should you use it?
This indicator simplifies the process of analyzing the combination market direction and trend strength. It is especially useful for traders who like strong directional movements and want clear, visually represented entry signals. The Karacatica Indicator can generate good buy or sell signals in trading and can be used on multiple assets and timeframes, making it adaptable to different market conditions.
Settings Overview: ATR Period: Sets the period for calculating ATR, used to determine market volatility.
DI Length: The length of the lookback period for DI+ and DI- calculations.
ADX Smoothing: Smooths the ADX (Average Directional Index) to reduce noise.
Feel free to experiment with this indicator, share feedback, and adapt it to your trading strategy. Good trading!
Relative VolatilityRelative Volatility is a technical indicator designed to assess changes in market volatility by comparing fast and slow Average True Range (ATR) values. It operates by subtracting a slower ATR (e.g., 50-period ATR) from a faster ATR (e.g., 20-period ATR) and visualizing the result as a histogram. This enables traders to determine whether volatility is increasing or decreasing over time.
This indicator can help traders recognize volatility trends, which can inform decisions related to trade entries, exits, and risk management.
Interpreting Volatility Changes
Increasing Volatility: When the histogram is above zero, it indicates that the fast ATR is greater than the slow ATR, signifying an increase in short-term volatility compared to the long-term average. This may suggest heightened market activity and potential trading opportunities.
Decreasing Volatility: When the histogram is below zero, it shows that the fast ATR is less than the slow ATR, indicating a decrease in short-term volatility relative to the long-term average. This may suggest consolidating markets or reduced trading activity.
Relative Volatility assists traders in monitoring and analyzing changes in market volatility, providing insights that can enhance trading strategies and decision-making processes.

Chandelier Exit Pro w/ExtensionsChandelier Exit Pro w/Extensions
The Chandelier Exit Pro w/Extensions indicator is designed to assist traders in managing risk and identifying trend reversals. The strategy is based on the Chandelier Exit concept, originally created by Charles Le Beau. It uses the Average True Range (ATR) to calculate dynamic stop levels that adjust based on market volatility. This script not only implements the standard Chandelier Exit, but also introduces extension levels and alerts to enhance decision-making.
Key Features:
➡️Dynamic Stop Levels: The indicator calculates stop levels for both long and short positions based on an ATR multiple. This allows traders to determine exit points by monitoring when the price crosses above or below these levels. These levels adapt in real-time based on price volatility, making them a versatile tool for trend-following strategies.
➡️Extension Levels: In addition to the primary stop levels, the script includes extension levels for more advanced stop-loss management. Traders can view active and extension levels separately, providing more flexibility in their exit strategies.
➡️Labels and Visual Cues: The indicator provides dynamic labels that automatically update and follow the plotted stop levels. Labels include the ATR multiplier value (e.g., "2.5" or "2.5ext"), clearly showing the significance of each level. When price crosses below or above a level, the corresponding label is highlighted, aiding traders in quickly identifying the most relevant stop level.
➡️Bar Confirmation and Alerts: The script includes an "await bar confirmation" option to ensure that the stop levels and alerts only trigger after the bar has closed. Alerts are customizable and will notify traders when price crosses critical levels, helping to make timely decisions without the need to constantly monitor charts.
➡️Multiple ATR Levels for Enhanced Precision: The indicator supports up to four different ATR levels, each with customizable multipliers. This allows traders to set different thresholds for exits based on varying degrees of volatility. For example, Level 1 (2.5x ATR) might represent a tighter stop, while Level 4 (10x ATR) could serve as a wider stop for long-term positions.
➡️Calc_bars_count: Improves efficiency of the indicator by reducing the on-chart calculations in to the past. This input can be found at the bottom of the INPUTS tab.
How it Helps Traders:
💥Trend Identification: By using the Chandelier Exit levels, traders can identify when the trend is likely to reverse. When the price crosses below the stop level in a long trade or above the stop level in a short trade, it signals a potential exit point.
💥Volatility-based Adjustments: Unlike static stop-loss methods, the ATR-based stop levels dynamically adjust based on the market’s volatility. This means tighter stops during low volatility periods and wider stops during high volatility periods, reducing the chance of being stopped out prematurely.
💥Risk Management: The dynamic stop levels and extension levels provide a structured way to manage risk. Traders can set tighter stops for short-term trades and wider stops for longer-term trades. The script's visual labels make it easy to track these levels in real-time.
💥Automation with Alerts: The built-in alert system ensures that traders are notified when key levels are crossed. This helps to avoid emotional decision-making and allows for better execution of trading strategies.
Confluence and Price Fluidity:
One of the powerful ways to enhance the effectiveness of the Chandelier Exit indicator is by using it in conjunction with other technical analysis tools to create confluence. Confluence occurs when multiple indicators or price action signals align, providing stronger confirmation for a trade decision. For example:
🎯Support and Resistance Levels: Traders can use the Chandelier Exit levels in combination with key support and resistance zones. If the price is nearing a support level and the Chandelier Exit signals a bullish reversal, this alignment strengthens the case for entering a long position.
🎯Moving Averages: When the Chandelier Exit signals a trend reversal and this is confirmed by a crossover in moving averages (such as a 50-day and 200-day moving average), traders gain additional confidence in the trade direction.
🎯Momentum Indicators: Traders can also look for momentum indicators like RSI or MACD to confirm the strength of a trend or potential reversal. For instance, if the Chandelier Exit triggers a short signal and the RSI also shows overbought conditions, this could provide stronger confirmation to exit a long trade or enter a short position.
🎯Candlestick Patterns: Price fluidity can be monitored using candlestick formations. For example, a bearish engulfing pattern near a Chandelier Exit resistance level offers confluence, adding confidence to the signal to close or short the trade.
By combining the Chandelier Exit with other tools, traders ensure that they are not relying on a single indicator. This layered approach can reduce the likelihood of false signals and improve overall trading accuracy.
Practical Use Case:
Imagine a trader enters a long position, and the price moves favorably. Using the Chandelier Exit, the trader sets the initial stop level at 2.5x ATR below the highest close. As the price continues to rise, the stop level follows the price, locking in profits. If the market suddenly turns, the price crossing below the stop level signals an exit, helping the trader preserve gains. With extension levels, the trader can further refine exits, adjusting based on their risk tolerance and market conditions.
Good luck and I hope that you can find a place in your tool bag to use this dynamic indicator 🙏

Options Series - Supertrend, HalfTrend, Ichimoku Cloud and P_SAR➤ Supertrend:
➤ HalfTrend:
➤ Ichimoku Cloud:
➤ Parabolic SAR:
⭐ Overview and How It Works:
This script combines multiple popular technical indicators—Supertrend, HalfTrend, Ichimoku Cloud, and Parabolic SAR—into a single, cohesive tool for analyzing price trends and reversals. Designed for traders who prefer multi-layered confirmation, it displays non-overlay signals in a candlestick format, helping users make sense of intricate market dynamics. It also includes a "Master Candle" condition, which aggregates the signals from all indicators, providing a powerful snapshot of market sentiment.
References for study,
Supertrend and HalfTrend and Ichimoku Cloud and Parabolic SAR
⭐ Key Features and Functionality:
The script integrates four indicators and visually represents them in a non-overlay fashion, meaning that each indicator's signal appears on separate candlestick layers. It uses color coding to differentiate between bullish and bearish signals. The Master Candle is a unique feature that aggregates the signals from all indicators to show the overall sentiment.
Supertrend: It uses ATR and a multiplier factor to create a trailing stop, identifying bullish and bearish trends.
HalfTrend: It analyzes market volatility that provides buy and sell signals based on volatility channels and historical highs and lows.
Ichimoku Cloud: It leverages historical highs and lows to form the conversion and baseline, which are compared to assess market strength.
Parabolic SAR: A stop-and-reverse system that highlights potential reversals. It is based on time and price, offering traders potential reversal points.
Master Candle: It computes a score based on the confluence of all four indicators, adding another layer of confirmation.
🎨 Visualizations and User Experience:
The script's user interface is highly visual, with color-coded candlesticks plotted across multiple layers. Each indicator has its own color coding for bullish and bearish signals, ensuring clarity:
➤ Green for bullish signals.
➤ Red for bearish signals.
➤ Each candlestick layer represents a different indicator (e.g., Supertrend, HalfTrend, etc.), making it easy for the trader to isolate and interpret signals.
➤ The "Master Candle" provides an overarching view of the market by displaying a consolidated signal, which can reduce confusion from mixed indicator signals.
⭐ Settings and Customization:
The script is highly customizable, allowing users to adjust the settings for each indicator. Key customizable parameters include:
• Supertrend ATR Period and Factor
• HalfTrend Amplitude and Channel Deviation
• Ichimoku Conversion, Base, and Lagging Span Periods
• Parabolic SAR Start, Increment, and Maximum value
Additionally, users can toggle the visibility of each indicator and customize the look of the plot to suit their preferences.
⭐ Uniqueness of the Concept:
No repaints. This is the advanced representation and the combination of multiple indicators into a single script, along with a powerful "Master Candle" that aggregates them, makes this tool unique. Most scripts provide isolated indicator signals, while this one brings together four powerful indicators and visually simplifies the analysis. The non-overlay style and color-coded candlesticks offer traders an easy-to-understand, actionable visual cue, which stands out from traditional indicator overlays.
🚀 Conclusion:
This script is a comprehensive, multi-indicator trading tool suitable for traders looking for reliable trend-following and reversal detection. Its ability to provide an aggregated "Master Candle" signal reduces noise and aids in better decision-making. Customization options allow users to tailor it to their trading style, while its clear visualizations provide an excellent user experience.

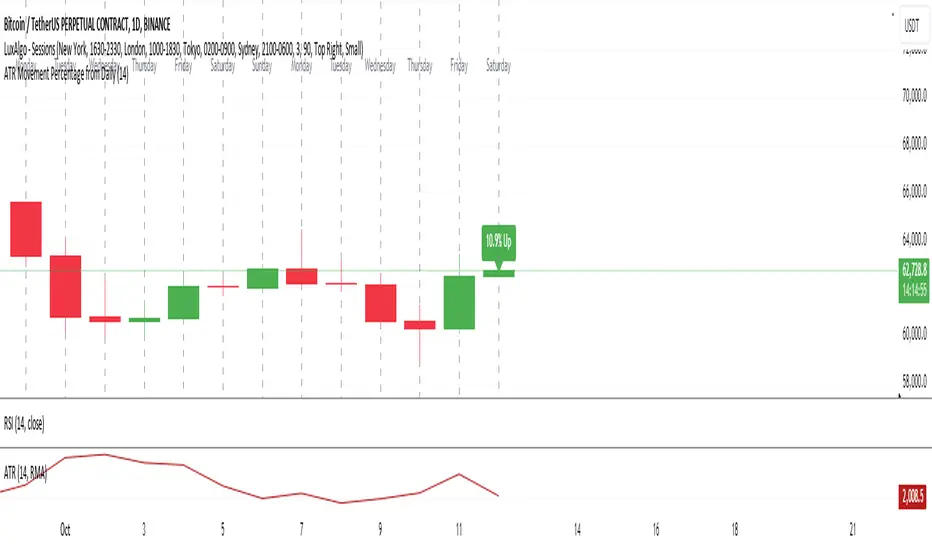
ATR Movement Percentage from Daily (Bal)Script Description: ATR Movement Percentage from Daily
The script titled "ATR Movement Percentage from Daily" is designed to help traders analyze the price movement of an asset in relation to its daily volatility, as represented by the Average True Range (ATR). Here's a breakdown of how the script works:
Key Features of the Script:
ATR Calculation:
The script allows the user to input the length of the ATR calculation (default is 14 periods).
It retrieves the daily ATR value using the request.security function, ensuring that the ATR is based on the daily timeframe, regardless of the current chart's timeframe.
Price Movement Calculation:
It calculates the opening price of the current day using request.security to ensure it is aligned with the daily timeframe.
It retrieves the current closing price and computes the price change from the opening price.
Movement Percentage:
The percentage of price movement relative to the daily ATR is calculated. This value helps traders understand how significant the current price movement is compared to the expected volatility for the day.
Direction of Movement:
The script determines the direction of the price movement (upward or downward) based on whether the price change is positive or negative.
Dynamic Label Display:
A label is created and updated to show the movement percentage and direction on the chart.
If the price movement is upward, the label is displayed in green; if downward, it is shown in red.
The label position updates with each new bar, keeping it relevant to the current price action.
Plotting Daily ATR:
The daily ATR value is plotted on the chart as a blue line, providing a visual reference for traders to see the volatility levels in relation to price movements.
Conclusion:
This script is particularly useful for traders who want to assess market conditions based on volatility. By understanding how much the price has moved in relation to the daily ATR, traders can make informed decisions about entry and exit points, and adjust their risk management strategies accordingly. The dynamic labeling feature enhances the usability of the script, allowing for quick visual assessments of market behavior.
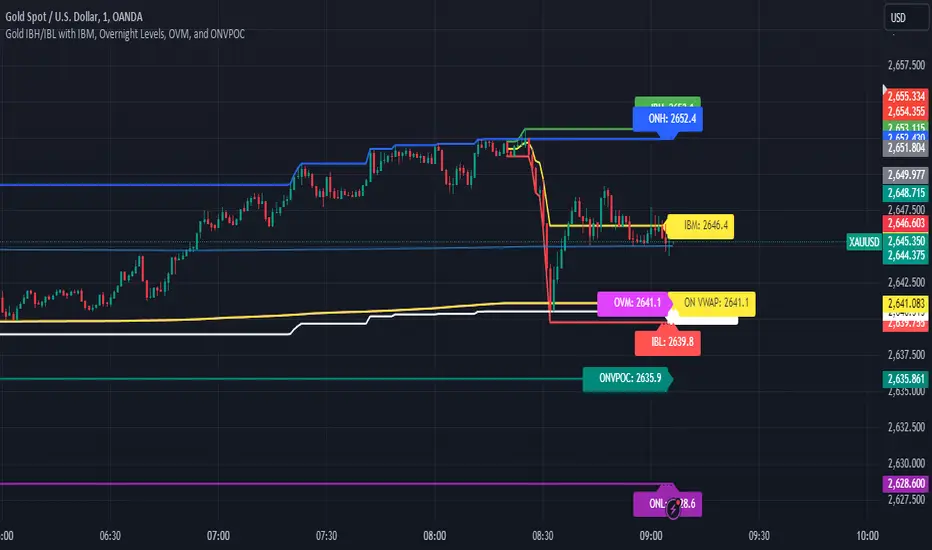
Gold IBH/IBL with IBM, Overnight Levels, OVM, and ONVPOCThe Initial Balance (IB) indicator for gold trading is a valuable tool for identifying key price levels and potential trade setups. Here's an overview of how it works:
Initial Balance Calculation
The Initial Balance for gold is calculated from 8:20 AM to 9:20 AM EST, coinciding with the COMEX open. This one-hour period establishes crucial reference points for the trading day.
Key Levels
The indicator displays several important price levels:
IB High: The highest price reached during the Initial Balance period
IB Low: The lowest price reached during the Initial Balance period
IB Midpoint: The average of the IB High and IB Low
These levels often serve as significant support and resistance areas, with many traders placing stop-losses around them.
Overnight Levels
In addition to the IB levels, the indicator shows overnight price action:
ONH: Overnight High
ONL: Overnight Low
ONM: Overnight Midpoint
Overnight VWAP: Volume Weighted Average Price from the overnight session
These overnight levels have a high probability of being tested during the COMEX trading session, making them valuable reference points for traders.
Trading Applications
Traders can use the IB and overnight levels for various purposes:
Setting profit targets
Identifying potential trade entry points
Managing risk by placing stop-losses at key levels
Gauging overall market sentiment and volatility
The levels established during both the Initial Balance and overnight sessions are likely to be touched during the COMEX trading session. This insight allows traders to make more informed decisions and enhances their trading strategies.
If you have more questions about the trading strategy, please DM me, and I can explain further. I also have probabilities of all these levels being broken during the COMEX trading hours, which gives us confidence to hold our trades to targets.
Understanding and utilizing these levels can provide traders with a competitive edge in gold trading, helping them make more informed decisions based on early market dynamics and overnight price action.
ATR Band, Stop loss , Take Profit Lines, and Pip Distance# ATR Band, Take Profit Lines, and Pip Distance Indicator
This indicator helps traders identify potential stop loss and take profit levels using Average True Range (ATR) bands and custom multipliers. It provides a visual representation of these levels and calculates the pip distance to stop loss, aiding in risk management and trade planning.
## Key Features:
- ATR-based upper and lower bands for potential stop loss levels
- Two take profit levels above and below the ATR bands
- Customizable ATR period and multipliers for bands and take profit levels
- Pip distance calculation to stop loss levels
- Adjustable colors for all elements
## How to Use:
1. The ATR bands (blue and red lines) suggest potential stop loss levels.
2. Take profit levels are shown as green lines above and below the ATR bands.
3. Labels display the pip distance from the current or last close to the stop loss levels.
## Customization:
- Adjust the ATR period and multipliers to fit your trading style
- Customize colors for better visibility on your chart
- Choose between current candle or last close for pip distance calculation
Remember, this indicator is for informational purposes only. Always manage your risk carefully and consider using it in conjunction with other analysis tools and your trading strategy.
Good luck with your trading!

Dynamic Supertrend1. Indicator Overview:
This indicator is designed to plot dynamic support and resistance lines based on the Supertrend strategy, incorporating volatility through the Average True Range (ATR). The indicator changes direction when the price crosses certain thresholds, generating buy and sell signals. It also highlights the prevailing trend on the chart and can trigger alerts when a trend shift occurs.
2. Key Features:
ATR-Based Trend Calculation:
The script uses the Average True Range (ATR) to adjust the distance between the Supertrend line and the price. This ensures that the indicator adapts to market volatility.
The trend is determined by comparing the closing price to upper and lower boundaries, which are calculated by adding or subtracting a multiple of ATR to a source price (typically the average of the high and low prices).
Volatility Filter:
The script includes a function to check if the market is volatile by measuring the standard deviation of the closing price over the past 14 periods. This can potentially be used to conditionally enable or disable signals based on volatility.
Buy and Sell Signals:
When the price crosses above the Supertrend line, it indicates the start of an uptrend, triggering a "Buy" signal.
Conversely, when the price crosses below the Supertrend line, it signals a downtrend, triggering a "Sell" signal.
Both signals can be displayed on the chart with optional shapes (circles or arrows) and labels.
Highlighting Current Trend:
You can choose to highlight the trend with color shading. The areas above the price line are shaded green during an uptrend, while the areas below are shaded red during a downtrend. The highlighting is controlled through an input switch.
Customizable Inputs:
The script allows users to adjust the ATR period and multiplier, as well as control whether to show buy/sell signals and highlight trends.
The source price used for calculations can also be customized, providing flexibility for different market conditions.
Alerts for Trading Opportunities:
Alerts are configured to notify the user of key events:
When the Supertrend changes direction (from uptrend to downtrend, or vice versa).
When a buy or sell signal is generated.
3. Code Structure:
Input Settings: Users can customize the base ATR period, the multiplier for ATR, and control the display of signals and highlighting features.
Trend Calculation Logic: The code determines the uptrend and downtrend by comparing the current price against dynamic ATR-based thresholds. It ensures that trends persist until price action confirms a change.
Plotting and Signals: Plots the trend lines based on whether the trend is up or down. It also provides visual cues for buy and sell signals with circles and optional arrows/labels on the chart.
Alert System: Three alert conditions are defined: buy signal, sell signal, and a general trend direction change, allowing users to set up real-time notifications for trading actions.
4. Use Case:
This script is particularly useful for traders who:
Rely on trend-following strategies and want to enter trades based on price action.
Need visual confirmation of market direction changes.
Prefer to automate their trading signals with real-time alerts.
Want to adjust the sensitivity of the indicator by tweaking the ATR multiplier and period settings to suit different market conditions.
Overall, this dynamic Supertrend indicator can be a powerful tool for both manual and automated trading setups, offering flexibility and clarity in identifying trend shifts.

ATR Bands with ATR Cross + InfoTableOverview
This Pine Script™ indicator is designed to enhance traders' ability to analyze market volatility, trend direction, and position sizing directly on their TradingView charts. By plotting Average True Range (ATR) bands anchored at the OHLC4 price, displaying crossover labels, and providing a comprehensive information table, this tool offers a multifaceted approach to technical analysis.
Key Features:
ATR Bands Anchored at OHLC4: Visual representation of short-term and long-term volatility bands centered around the average price.
OHLC4 Dotted Line: A dotted line representing the average of Open, High, Low, and Close prices.
ATR Cross Labels: Visual cues indicating when short-term volatility exceeds long-term volatility and vice versa.
Information Table: Displays real-time data on market volatility, calculated position size based on risk parameters, and trend direction relative to the 20-period Smoothed Moving Average (SMMA).
Purpose
The primary purpose of this indicator is to:
Assess Market Volatility: By comparing short-term and long-term ATR values, traders can gauge the current volatility environment.
Determine Optimal Position Sizing: A calculated position size based on user-defined risk parameters helps in effective risk management.
Identify Trend Direction: Comparing the current price to the 20-period SMMA assists in determining the prevailing market trend.
Enhance Decision-Making: Visual cues and real-time data enable traders to make informed trading decisions with greater confidence.
How It Works
1. ATR Bands Anchored at OHLC4
Average True Range (ATR) Calculations
Short-Term ATR (SA): Calculated over a 9-period using ta.atr(9).
Long-Term ATR (LA): Calculated over a 21-period using ta.atr(21).
Plotting the Bands
OHLC4 Dotted Line: Plotted using small circles to simulate a dotted line due to Pine Script limitations.
ATR(9) Bands: Plotted in blue with semi-transparent shading.
ATR(21) Bands: Plotted in orange with semi-transparent shading.
Overlap: Bands can overlap, providing visual insights into changes in volatility.
2. ATR Cross Labels
Crossover Detection:
SA > LA: Indicates increasing short-term volatility.
Detected using ta.crossover(SA, LA).
A green upward label "SA>LA" is plotted below the bar.
SA < LA: Indicates decreasing short-term volatility.
Detected using ta.crossunder(SA, LA).
A red downward label "SA LA, then the market is considered volatile.
Display: Shows "Yes" or "No" based on the comparison.
b. Position Size Calculation
Risk Total Amount: User-defined input representing the total capital at risk.
Risk per 1 Stock: User-defined input representing the risk associated with one unit of the asset.
Purpose: Helps traders determine the appropriate position size based on their risk tolerance and current market volatility.
c. Is Price > 20 SMMA?
SMMA Calculation:
Calculated using a 20-period Smoothed Moving Average with ta.rma(close, 20).
Logic: If the current close price is above the SMMA, the trend is considered upward.
Display: Shows "Yes" or "No" based on the comparison.
How to Use
Step 1: Add the Indicator to Your Chart
Copy the Script: Copy the entire Pine Script code into the TradingView Pine Editor.
Save and Apply: Save the script and click "Add to Chart."
Step 2: Configure Inputs
Risk Parameters: Adjust the "Risk Total Amount" and "Risk per 1 Stock" in the indicator settings to match your personal risk management strategy.
Step 3: Interpret the Visuals
ATR Bands
Width of Bands: Wider bands indicate higher volatility; narrower bands indicate lower volatility.
Band Overlap: Pay attention to areas where the blue and orange bands diverge or converge.
OHLC4 Dotted Line
Serves as a central reference point for the ATR bands.
Helps visualize the average price around which volatility is measured.
ATR Cross Labels
"SA>LA" Label:
Indicates short-term volatility is increasing relative to long-term volatility.
May signal potential breakout or trend acceleration.
"SA 20 SMMA?
Use this to confirm trend direction before entering or exiting trades.
Practical Example
Imagine you are analyzing a stock and notice the following:
ATR(9) Crosses Above ATR(21):
A green "SA>LA" label appears.
The info table shows "Yes" for "Is ATR-based price volatile."
Position Size:
Based on your risk parameters, the position size is calculated.
Price Above 20 SMMA:
The info table shows "Yes" for "Is price > 20 SMMA."
Interpretation:
The market is experiencing increasing short-term volatility.
The trend is upward, as the price is above the 20 SMMA.
You may consider entering a long position, using the calculated position size to manage risk.
Customization
Colors and Transparency:
Adjust the colors of the bands and labels to suit your preferences.
Risk Parameters:
Modify the default values for risk amounts in the inputs.
Moving Average Period:
Change the SMMA period if desired.
Limitations and Considerations
Lagging Indicators: ATR and SMMA are lagging indicators and may not predict future price movements.
Market Conditions: The effectiveness of this indicator may vary across different assets and market conditions.
Risk of Overfitting: Relying solely on this indicator without considering other factors may lead to suboptimal trading decisions.
Conclusion
This indicator combines essential elements of technical analysis to provide a comprehensive tool for traders. By visualizing ATR bands anchored at the OHLC4, indicating volatility crossovers, and providing real-time data on position sizing and trend direction, it aids in making informed trading decisions.
Whether you're a novice trader looking to understand market volatility or an experienced trader seeking to refine your strategy, this indicator offers valuable insights directly on your TradingView charts.
Code Summary
The script is written in Pine Script™ version 5 and includes:
Calculations for OHLC4, ATRs, Bands, SMMA:
Uses built-in functions like ta.atr() and ta.rma() for calculations.
Plotting Functions:
plotshape() for the OHLC4 dotted line.
plot() and fill() for the ATR bands.
Crossover Detection:
ta.crossover() and ta.crossunder() for detecting ATR crosses.
Labeling Crossovers:
label.new() to place informative labels on the chart.
Information Table Creation:
table.new() to create the table.
table.cell() to populate it with data.
Acknowledgments
ATR and SMMA Concepts: Built upon standard technical analysis concepts widely used in trading.
Pine Script™: Leveraged the capabilities of Pine Script™ version 5 for advanced charting and analysis.
Note: Always test any indicator thoroughly and consider combining it with other forms of analysis before making trading decisions. Trading involves risk, and past performance is not indicative of future results.
Happy Trading!

ATR with Donchian Channels and SMAsThis script combines the Average True Range (ATR), Donchian Channels, and Simple Moving Averages (SMAs) to provide a comprehensive tool for volatility and trend analysis.
Key Components:
ATR Calculation: The ATR is used to measure market volatility. It is calculated as a moving average of the true range over a specified length, which you can customize using different smoothing methods: RMA, SMA, EMA, or WMA. ATR helps identify periods of high and low volatility, giving insights into potential breakout or consolidation phases in the market.
Donchian Channels on ATR: The Donchian Channels are calculated based on the highest and lowest values of the ATR over a user-defined period. The upper and lower bands provide a volatility range, and the middle line represents the average of the two. This can help visualize the range of market volatility and detect possible trend reversals or continuations.
SMAs on ATR: Two Simple Moving Averages (SMA) are applied to the ATR values. These SMAs act as a smoothed version of the ATR, providing additional insight into volatility trends. By adjusting the length of these SMAs, you can track short-term and long-term volatility movements, helping in decision-making for potential entries and exits.
Inputs:
ATR Length: Set the length for calculating the ATR.
Smoothing Method: Choose from RMA, SMA, EMA, or WMA for smoothing the ATR calculation.
Donchian Channel Length: Set the length for calculating the highest and lowest ATR values for Donchian Channels.
SMA Lengths: Two adjustable lengths for applying SMAs to the ATR.
Visualization:
ATR Plot: The ATR is plotted in red, allowing you to see the market's volatility at a glance.
Donchian Channels: Blue lines represent the upper and lower bands, while the green line represents the middle line of the Donchian Channels, helping you visualize the volatility range.
SMAs: Two SMAs (green and orange) are plotted to smooth out the ATR and identify trends in volatility.
Use Cases:
Breakout Detection: High ATR values breaking out of the Donchian Channels may signal increased volatility and a potential breakout.
Trend Analysis: SMAs on ATR help smooth volatility trends, aiding in determining if the market is entering a more volatile or stable period.
Stop-Loss Placement: ATR and Donchian Channels can be used to set dynamic stop-loss levels based on market volatility.
This script is versatile and can be used across different asset classes, such as stocks, forex, crypto, and commodities. It is especially useful for traders who want to incorporate volatility into their trading strategies for better risk management and trend detection.
ATR, Chop, Profit Target and Stop Loss TableThe ATR Table indicator is a versatile tool that helps traders visually and quantitatively manage risk, identify market conditions, and set profit targets and stop-loss levels. It is designed to enhance decision-making by incorporating key volatility and chop (market consolidation) signals into a comprehensive table format.
Key Features:
Average True Range (ATR) Calculation : The indicator computes the ATR over a user-defined period (default 14). ATR helps to measure market volatility, providing insights into how much an asset's price typically moves within a given period.
Stop Loss and Profit Target Calculation : You can configure stop-loss and profit target levels using multipliers based on the ATR. This allows dynamic risk management that adjusts to market volatility:
Stop Loss : Defined as a multiple of the ATR to help control losses.
Profit Target : Also based on a multiple of the ATR to lock in gains. The user can specify whether they are trading long or short, and the indicator adjusts the levels accordingly.
Customizable Plot Lines : The indicator can display the Stop Loss and Profit Target levels directly on the chart. Users can toggle these lines on or off and customize their colors.
Chop Signa l: The indicator highlights potential consolidation periods (chop) using a wick-based analysis. It calculates the highest upper or lower wick values and compares them to the ATR to detect periods of indecision or consolidation.
Table Display : When these wick values exceed the ATR by a user-defined multiplier, the corresponding table rows are highlighted.
Background Alerts : Optionally, users can activate background color changes on the chart to visually alert them when chop conditions are detected.
Customizable Table Layout : A table displaying the key values (ATR, Stop Loss, Profit Target, Upper/Lower Wickiness) is placed on the chart. You can choose the table's position, adjust its color scheme, and decide which rows to display.
Chop Background Customization : For users who prefer more visual cues, the indicator allows you to enable or disable background shading when chop conditions are met. You can also choose the color of this background for better customization.
KAMA CloudDescription:
The KAMA Cloud indicator is a sophisticated trading tool designed to provide traders with insights into market trends and their intensity. This indicator is built on the Kaufman Adaptive Moving Average (KAMA), which dynamically adjusts its sensitivity to filter out market noise and respond to significant price movements. The KAMA Cloud leverages multiple KAMAs to gauge trend direction and strength, offering a visual representation that is easy to interpret.
How It Works:
The KAMA Cloud uses twenty different KAMA calculations, each set to a distinct lookback period ranging from 5 to 100. These KAMAs are calculated using the average of the open, high, low, and close prices (OHLC4), ensuring a balanced view of price action. The relative positioning of these KAMAs helps determine the direction of the market trend and its momentum.
By measuring the cumulative relative distance between these KAMAs, the indicator effectively assesses the overall trend strength, akin to how the Average True Range (ATR) measures market volatility. This cumulative measure helps in identifying the trend’s robustness and potential sustainability.
The visualization component of the KAMA Cloud is particularly insightful. It plots a 'cloud' formed between the base KAMA (set at a 100-period lookback) and an adjusted KAMA that incorporates the cumulative relative distance scaled up. This cloud changes color based on the trend direction — green for upward trends and red for downward trends, providing a clear, visual representation of market conditions.
Benefits:
Dynamic Sensitivity: By adapting to the market's volatility, KAMA provides more reliable signals than traditional moving averages.
Trend Clarity: The color-coded cloud visually enhances the perception of the trend’s direction and strength, making it easier for traders to decide on their trading strategy.
Versatility: Suitable for various asset classes, including stocks, forex, commodities, and cryptocurrencies, across different timeframes.
Decision Support: Helps traders understand not just the direction but the strength of trends, aiding in more informed decision-making regarding entries, exits, and risk management.
Usage:
The KAMA Cloud is ideal for traders who need a robust trend-following tool that adjusts according to market dynamics. It can be used as a standalone indicator or in conjunction with other technical analysis tools to enhance trading strategies. Look for the cloud’s color shifts as potential signals for trend reversals or continuations, and consider the cloud’s thickness as an indication of trend strength.
Whether you are a day trader, swing trader, or long-term investor, the KAMA Cloud offers a unique approach to understanding market trends, helping you navigate the complexities of various market conditions with confidence.

Iceberg Trade Revealer [CHE]Unveiling Iceberg Trades: A Deep Dive into Low Volatility Market Phases
Introduction
In the dynamic world of trading, hidden forces often influence market movements in ways that aren't immediately apparent. One such force is the phenomenon of iceberg trades—large orders that are concealed to prevent significant market impact. This presentation explores the concept of iceberg trades, explains why they are typically hidden during periods of low volatility, and introduces an indicator designed to reveal these elusive trades.
Agenda
1. Understanding Iceberg Trades
- Definition and Purpose
- Impact on Market Dynamics
2. The Low Volatility Concealment
- Why Low Volatility Phases?
- Strategies Behind Hiding Large Orders
3. Introducing the Iceberg Trade Revealer Indicator
- How the Indicator Works
- Key Components and Calculations
4. Demonstration and Use Cases
- Interpreting the Indicator Signals
- Practical Trading Applications
5. Conclusion
- Summarizing the Insights
- Q&A Session
1. Understanding Iceberg Trades
Definition and Purpose
- Iceberg Trades are large single orders divided into smaller lots to disguise the total order quantity.
- Traders use iceberg orders to minimize market impact and avoid unfavorable price movements.
Impact on Market Dynamics
- Concealed Volume: Iceberg orders hide true supply and demand levels.
- Price Stability: They prevent sudden spikes or drops by releasing orders gradually.
- Market Sentiment: Their presence can influence perceptions of market strength or weakness.
2. The Low Volatility Concealment
Why Low Volatility Phases?
- Less Market Attention: Low volatility periods attract fewer traders, making it easier to conceal large orders.
- Reduced Slippage: Prices are more stable, reducing the risk of executing orders at unfavorable prices.
- Strategic Advantage: Large players can accumulate or distribute positions without tipping off the market.
Strategies Behind Hiding Large Orders
- Order Splitting: Breaking down large orders into smaller pieces.
- Time Slicing: Executing orders over an extended period.
- Algorithmic Trading: Using sophisticated algorithms to optimize order execution.
3. Introducing the Iceberg Trade Revealer Indicator
How the Indicator Works
- Core Thesis: Iceberg trades can be detected by analyzing periods of unusually low volatility.
- Volatility Analysis: Uses the Average True Range (ATR) and Bollinger Bands to identify low volatility phases.
- Signal Generation: Marks periods where iceberg trades are likely occurring.
Key Components and Calculations
1. Average True Range (ATR)
- Measures market volatility over a specified period.
- Lower ATR values indicate less price movement.
2. Bollinger Bands
- Creates a volatility envelope around the ATR.
- Bands tighten during low volatility and widen during high volatility.
3. Timeframe Adjustments
- Utilizes multiple timeframes to enhance signal accuracy.
- Options for auto, multiplier, or manual timeframe selection.
4. Signal Conditions
- Iceberg Trade Detection: ATR falls below the lower Bollinger Band.
- Revealed Volatility: ATR rises above the upper Bollinger Band, indicating potential market moves after iceberg trades.
4. Demonstration and Use Cases
Interpreting the Indicator Signals
- Iceberg Trade Zones: Highlighted areas where large hidden orders are likely.
- Revealed Volatility Zones: Areas indicating the market's response to the execution of iceberg trades.
Practical Trading Applications
- Entry and Exit Points: Use signals to time trades alongside institutional activity.
- Risk Management: Adjust strategies during detected low volatility phases.
- Market Analysis: Gain insights into underlying market mechanics.
5. Conclusion
Summarizing the Insights
- Iceberg Trades play a significant role in market movements, especially when concealed during low volatility phases.
- The Iceberg Trade Revealer Indicator provides a tool to uncover these hidden activities, offering traders a strategic edge.
- Understanding and utilizing this indicator can enhance trading decisions by aligning them with the actions of major market players.
Best regards Chervolino ( Volker )
Q&A Session
- Questions and Discussions: Open the floor for any queries or further explanations.
Thank You!
By delving into the hidden aspects of market activity, traders can better navigate the complexities of financial markets. The Iceberg Trade Revealer Indicator serves as a bridge between observable market data and the concealed strategies of large institutions.
References
- Average True Range (ATR): A technical analysis indicator that measures market volatility.
- Bollinger Bands: A volatility indicator that creates a band of three lines which are plotted in relation to a security's price.
- Iceberg Orders: Large orders divided into smaller lots to hide the actual order quantity.
Note: Always consider multiple factors when making trading decisions. Indicators provide tools, but they do not guarantee results.
Educational Content Disclaimer:
Disclaimer:
The content provided, including all code and materials, is strictly for educational and informational purposes only. It is not intended as, and should not be interpreted as, financial advice, a recommendation to buy or sell any financial instrument, or an offer of any financial product or service. All strategies, tools, and examples discussed are provided for illustrative purposes to demonstrate coding techniques and the functionality of Pine Script within a trading context.
Any results from strategies or tools provided are hypothetical, and past performance is not indicative of future results. Trading and investing involve high risk, including the potential loss of principal, and may not be suitable for all individuals. Before making any trading decisions, please consult with a qualified financial professional to understand the risks involved.
By using this script, you acknowledge and agree that any trading decisions are made solely at your discretion and risk.
$TUBR: Stop Loss IndicatorATR-Based Stop Loss Indicator for TradingView by The Ultimate Bull Run Community: TUBR
**Overview**
The ATR-Based Stop Loss Indicator is a custom tool designed for traders using TradingView. It helps you determine optimal stop loss levels by leveraging the Average True Range (ATR), a popular measure of market volatility. By adapting to current market conditions, this indicator aims to minimize premature stop-outs and enhance your risk management strategy.
---
**Key Features**
- **Dynamic Stop Loss Levels**: Calculates stop loss prices based on the ATR, providing both long and short stop loss suggestions.
- **Customizable Parameters**: Adjust the ATR period, multiplier, and smoothing method to suit your trading style and the specific instrument you're trading.
- **Visual Aids**: Plots stop loss lines directly on your chart for easy visualization.
- **Alerts and Notifications** (Optional): Set up alerts to notify you when the price approaches or hits your stop loss levels.
---
**Understanding the Indicator**
1. **Average True Range (ATR)**:
- **What It Is**: ATR measures market volatility by calculating the average range between high and low prices over a specified period.
- **Why It's Useful**: A higher ATR indicates higher volatility, which can help you set stop losses that accommodate market fluctuations.
2. **ATR Multiplier**:
- **Purpose**: Determines how far your stop loss is placed from the current price based on the ATR.
- **Example**: An ATR multiplier of 1.5 means the stop loss is set at 1.5 times the ATR away from the current price.
3. **Smoothing Methods**:
- **Options**: Choose from RMA (default), SMA, EMA, WMA, or Hull MA.
- **Effect**: Different smoothing methods can make the ATR more responsive or smoother, affecting where the stop loss is placed.
---
**How the Indicator Works**
- **Long Stop Loss Calculation**:
- **Formula**: `Long Stop Loss = Close Price - (ATR * ATR Multiplier)`
- **Purpose**: For long positions, the stop loss is set below the current price to protect against downside risk.
- **Short Stop Loss Calculation**:
- **Formula**: `Short Stop Loss = Close Price + (ATR * ATR Multiplier)`
- **Purpose**: For short positions, the stop loss is set above the current price to protect against upside risk.
- **Plotting on the Chart**:
- **Green Line**: Represents the suggested stop loss level for long positions.
- **Red Line**: Represents the suggested stop loss level for short positions.
---
**How to Use the Indicator**
1. **Adding the Indicator to Your Chart**:
- **Step 1**: Copy the PineScript code of the indicator.
- **Step 2**: In TradingView, click on **Pine Editor** at the bottom of the platform.
- **Step 3**: Paste the code into the editor and click **Add to Chart**.
- **Step 4**: The indicator will appear on your chart with the default settings.
2. **Adjusting the Settings**:
- **ATR Period**:
- **Definition**: Number of periods over which the ATR is calculated.
- **Adjustment**: Increase for a smoother ATR; decrease for a more responsive ATR.
- **ATR Multiplier**:
- **Definition**: Factor by which the ATR is multiplied to set the stop loss distance.
- **Adjustment**: Increase to widen the stop loss (less likely to be hit); decrease to tighten the stop loss.
- **Smoothing Method**:
- **Options**: RMA, SMA, EMA, WMA, Hull MA.
- **Adjustment**: Experiment to see which method aligns best with your trading strategy.
- **Display Options**:
- **Show Long Stop Loss**: Toggle to display or hide the long stop loss line.
- **Show Short Stop Loss**: Toggle to display or hide the short stop loss line.
3. **Interpreting the Indicator**:
- **Long Positions**:
- **Action**: Set your stop loss at the value indicated by the green line when entering a long trade.
- **Short Positions**:
- **Action**: Set your stop loss at the value indicated by the red line when entering a short trade.
- **Adjusting Stop Losses**:
- **Trailing Stops**: You may choose to adjust your stop loss over time, moving it in the direction of your trade as the ATR-based stop loss levels change.
4. **Implementing in Your Trading Strategy**:
- **Risk Management**:
- **Position Sizing**: Use the stop loss distance to calculate your position size based on your risk tolerance.
- **Consistency**: Apply the same settings consistently to maintain discipline.
- **Combining with Other Indicators**:
- **Enhance Decision-Making**: Use in conjunction with trend indicators, support and resistance levels, or other technical analysis tools.
- **Alerts Setup** (If included in the code):
- **Purpose**: Receive notifications when the price approaches or hits your stop loss level.
- **Configuration**: Set up alerts in TradingView based on the alert conditions defined in the indicator.
---
**Benefits of Using This Indicator**
- **Adaptive Risk Management**: By accounting for current market volatility, the indicator helps prevent setting stop losses that are too tight or too wide.
- **Minimize Premature Stop-Outs**: Reduces the likelihood of being stopped out due to normal price fluctuations.
- **Flexibility**: Customizable settings allow you to tailor the indicator to different trading instruments and timeframes.
- **Visualization**: Clear visual representation of stop loss levels aids in quick decision-making.
---
**Things to Consider**
- **Market Conditions**:
- **High Volatility**: Be cautious as ATR values—and thus stop loss distances—can widen, increasing potential losses.
- **Low Volatility**: Tighter stop losses may increase the chance of being stopped out by minor price movements.
- **Backtesting and Optimization**:
- **Historical Analysis**: Test the indicator on past data to evaluate its effectiveness and adjust settings accordingly.
- **Continuous Improvement**: Regularly reassess and fine-tune the parameters to adapt to changing market conditions.
- **Risk Per Trade**:
- **Alignment with Risk Tolerance**: Ensure the stop loss level keeps potential losses within your acceptable risk per trade (e.g., 1-2% of your trading capital).
- **Emotional Discipline**:
- **Stick to Your Plan**: Avoid making impulsive changes to your stop loss levels based on emotions rather than analysis.
---
**Example Usage Scenario**
1. **Setting Up a Long Trade**:
- **Entry Price**: $100
- **ATR Value**: $2
- **ATR Multiplier**: 1.5
- **Calculated Stop Loss**: $100 - ($2 * 1.5) = $97
- **Action**: Place a stop loss order at $97.
2. **During the Trade**:
- **Price Increases to $105**
- **ATR Remains at $2**
- **New Stop Loss Level**: $105 - ($2 * 1.5) = $102
- **Action**: Move your stop loss up to $102 to lock in profits.
---
**Final Tips**
- **Documentation**: Keep a trading journal to record your trades, stop loss levels, and observations for future reference.
- **Education**: Continuously educate yourself on risk management and technical analysis to enhance your trading skills.
- **Support**: Engage with trading communities or seek professional advice if you're unsure about implementing the indicator effectively.
---
**Conclusion**
The ATR-Based Stop Loss Indicator is a valuable tool for traders looking to enhance their risk management by setting stop losses that adapt to market volatility. By integrating this indicator into your trading routine, you can improve your ability to protect capital and potentially increase profitability. Remember to use it as part of a comprehensive trading strategy, and always adhere to sound risk management principles.
---
**How to Access the Indicator**
To start using the ATR-Based Stop Loss Indicator, follow these steps:
1. **Obtain the Code**: Copy the PineScript code provided for the indicator.
2. **Create a New Indicator in TradingView**:
- Open TradingView and navigate to the **Pine Editor**.
- Paste the code into the editor.
- Click **Save** and give your indicator a name.
3. **Add to Chart**: Click **Add to Chart** to apply the indicator to your current chart.
4. **Customize Settings**: Adjust the input parameters to suit your preferences and start integrating the indicator into your trading strategy.
---
**Disclaimer**
Trading involves significant risk, and it's possible to lose all your capital. The ATR-Based Stop Loss Indicator is a tool to aid in decision-making but does not guarantee profits or prevent losses. Always conduct your own analysis and consider seeking advice from a financial professional before making trading decisions.

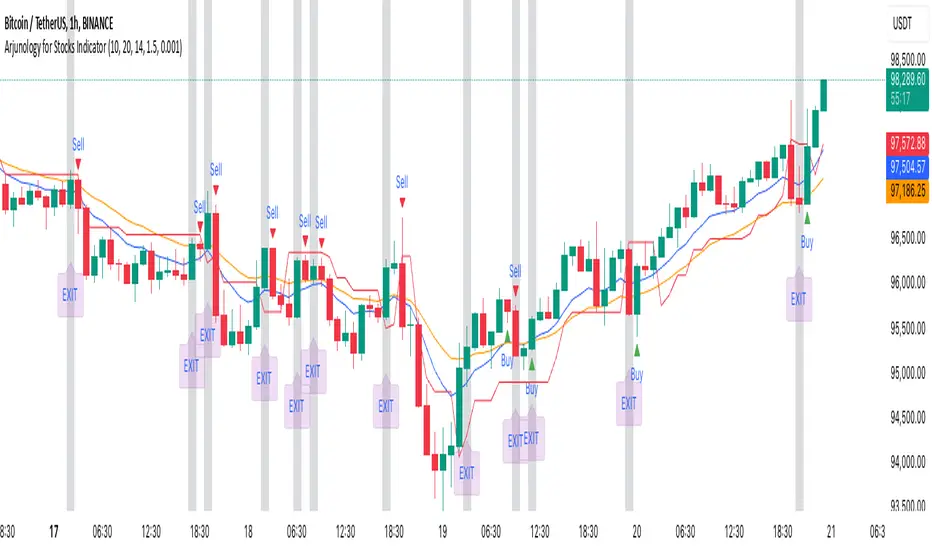
Arjunology for Stocks IndicatorArjunology for Stocks Indicator is a unique trend-following and exit management system that combines the power of Exponential Moving Averages (EMA) and Average True Range (ATR) to capture market trends and manage trade exits dynamically. It is designed to help traders identify potential buy and sell points based on market trends while incorporating volatility adjustments to avoid false signals and provide more reliable trade entries and exits.
Key Features:
1. Exponential Moving Averages (EMAs):
• Two EMAs (Short EMA and Long EMA) are used to determine trend direction and potential crossover signals.
• Short EMA reacts quickly to price changes, giving an indication of shorter-term trends.
• Long EMA provides a more stable measure of the overall trend direction, helping filter out market noise.
• Bullish Crossovers: When the short EMA crosses above the long EMA, it signals a potential uptrend (buy condition).
• Bearish Crossovers: When the short EMA crosses below the long EMA, it signals a potential downtrend (sell condition).
2. Average True Range (ATR):
• ATR is used to assess market volatility and avoid false signals during low volatility periods.
• A trailing stop loss mechanism based on ATR ensures that the indicator adapts to the current market environment, with higher volatility allowing for wider stops and lower volatility leading to tighter stops.
• A flat ATR threshold is used to avoid signals during quiet periods, where price movement may be too insignificant to trade effectively.
3. Buy and Sell Visual Cues:
• Green Triangle at the bottom of the candle when a bullish crossover (buy) condition is met.
• Red Triangle at the top of the candle when a bearish crossover (sell) condition is met.
• These visual cues help traders quickly identify trade entry points based on the trend signals.
4. Dynamic Exit Management:
• The indicator provides an Blue candle background to highlight exit points, with an “EXIT” label at the bottom of the candle in blue. This visual exit signal ensures clarity when a trade should be exited based on the trend reversal.
Justification for Combining EMAs and ATR in This Script:
The Exponential Moving Averages (EMAs) and Average True Range (ATR) serve complementary purposes in this script, enhancing each other’s functionality to provide a more complete trading system:
1. Trend Identification with EMAs:
• The combination of short and long EMAs is a widely trusted method for determining the trend direction. The crossovers between these EMAs provide clear entry signals for buy or sell trades. However, relying solely on EMAs can lead to false signals during periods of low volatility or market consolidation.
2. ATR for Volatility and Stop Loss:
• To prevent false signals during low-volatility conditions, the script uses ATR as a filter. This ensures that trades are only taken when the market has enough momentum, reducing the risk of being caught in “choppy” conditions where price action may be flat and untradeable.
• Additionally, the ATR-based trailing stop provides dynamic trade management, adjusting stop-loss levels according to the current volatility. This makes the system adaptive and prevents tight stops in volatile conditions or unnecessarily wide stops in calm markets.
3. Why They Work Together:
• The EMAs handle the trend direction, which is the foundation of the trading system, while the ATR adjusts the trade management to account for changing volatility. This means that the trader is always entering trades that are likely to follow a strong trend, while avoiding stagnant markets and using volatility-adaptive exit points.
• Without ATR, EMAs might generate signals during low-volatility periods that are unreliable. On the other hand, ATR alone wouldn’t provide a clear direction for trend-following. Together, these indicators create a balanced approach where trades are not only timely but also carefully managed.
How to Use:
• Buy Entry: Enter when the green triangle appears, indicating a bullish EMA crossover.
• Sell Entry: Enter short when the red triangle appears, indicating a bearish EMA crossover.
• Exit: Follow the orange background and blue “EXIT” label as a visual cue to exit the trade.
The combination of these tools allows traders to identify meaningful trend reversals while also managing risk dynamically, making the Arjunology for Stocks Indicator both versatile and effective for various market conditions.
Multi-Step FlexiSuperTrend - Indicator [presentTrading]This version of the indicator is built upon the foundation of a strategy version published earlier. However, this indicator version focuses on providing visual insights and alerts for traders, rather than executing trades. This one is mostly for @thorcmt.
█ Introduction and How it is Different
The **Multi-Step FlexiSuperTrend Indicator** is a versatile tool designed to provide traders with a highly customizable and flexible approach to trend analysis. Unlike traditional supertrend indicators, which focus on a single factor or threshold, the **FlexiSuperTrend** allows users to define multiple levels of take-profit targets and incorporate different trend normalization methods.
It comes with several advanced customization features, including multi-step take profits, deviation plotting, and trend normalization, making it suitable for both novice and expert traders.
BTCUSD 6hr Performance
█ Strategy, How It Works: Detailed Explanation
The **Multi-Step FlexiSuperTrend** works by calculating a supertrend based on multiple factors and incorporating oscillations from trend deviations. Here’s a breakdown of how it functions:
🔶 SuperTrend Calculation
At the heart of the indicator is the SuperTrend formula, which dynamically adjusts based on price movements.
🔶 Normalization of Deviations
To enhance accuracy, the **FlexiSuperTrend** calculates multiple deviations from the trend and normalizes them.
🔶 Multi-Step Take Profit Levels
The indicator allows setting up to three take profit levels, which are displayed via price level alerts. lows traders to exit part of their position at various profit intervals.
For more detail, please check the strategy version - Multi-Step-FlexiSuperTrend-Strategy:
and 'FlexiSuperTrend-Strategy'
█ Trade Direction
The **Multi-Step FlexiSuperTrend Indicator** supports both long and short trade directions.
This flexibility allows traders to adapt to trending, volatile, or sideways markets.
█ Usage
To use the **FlexiSuperTrend Indicator**, traders can set up their preferences for the following key features:
- **Trading Direction**: Choose whether to focus on long, short, or both signals.
- **Indicator Source**: The price source to calculate the trend (e.g., close, hl2).
- **Indicator Length**: The number of periods to calculate the ATR and trend (the larger the value, the smoother the trend).
- **Starting and Increment Factor**: These adjust how reactive the trend is to price movements. The starting factor dictates how far the initial trend band is from the price, and the increment factor adjusts subsequent trend deviations.
The indicator then displays buy and sell signals on the chart, along with alerts for each take-profit level.
Local picture
█ Default Settings
The default settings of the **Multi-Step FlexiSuperTrend** are carefully designed to provide an optimal balance between sensitivity and accuracy. Let’s examine these default parameters and their effect on performance:
🔶 Indicator Length (Default: 10)
The **Indicator Length** determines the lookback period for the ATR calculation. A smaller value makes the indicator more reactive to price changes, but may generate more false signals. A longer length smooths the trend and reduces noise but may delay signals.
Effect on performance: Shorter lengths perform better in volatile markets, while longer lengths excel in trending markets.
🔶 Starting Factor (Default: 0.618)
This factor adjusts the starting distance of the SuperTrend from the current price. The smaller the starting factor, the closer the trend is to the price, making it more sensitive. Conversely, a larger factor allows more distance, reducing sensitivity but filtering out false signals.
Effect on performance: A smaller factor provides quicker signals but can lead to frequent false positives. A larger factor generates fewer but more reliable signals.
🔶 Increment Factor (Default: 0.382)
The **Increment Factor** controls how the trend bands adjust as the price moves. It increases the distance of the bands from the price with each iteration.
Effect on performance: A higher increment factor can result in wider stop-loss or trend reversal bands, allowing for longer trends to develop without frequent exits. A lower factor keeps the bands closer to the price and is more suited for shorter-term trades.
🔶 Take Profit Levels (Default: 2%, 8%, 18%)
The default take-profit levels are set at 2%, 8%, and 18%. These values represent the thresholds at which the trader can partially exit their positions. These multi-step levels are highly customizable depending on the trader’s risk tolerance and strategy.
Effect on performance: Lower take-profit levels (e.g., 2%) capture small, quick profits in volatile markets, while higher levels (8%-18%) allow for a more gradual exit in strong trends.
🔶 Normalization Method (Default: None)
The default normalization method is **None**, meaning the deviations are not normalized. However, enabling normalization (e.g., **Max-Min**) can improve the clarity of the indicator’s signals in volatile or choppy markets by smoothing out the noise.
Effect on performance: Using a normalization method can reduce the effect of extreme deviations, making signals more stable and less prone to false positives.

Uptrick: Market MoodsThe "Uptrick: Market Moods" indicator is an advanced technical analysis tool designed for the TradingView platform. It combines three powerful indicators—Relative Strength Index (RSI), Average True Range (ATR), and Bollinger Bands—into one cohesive framework, aimed at helping traders better understand and interpret market sentiment. By capturing shifts in the emotional climate of the market, it provides a holistic view of market conditions, which can range from calm to stressed or even highly excited. This multi-dimensional analysis tool stands apart from traditional single-indicator approaches by offering a more complete picture of market dynamics, making it a valuable resource for traders looking to anticipate and react to changes in market behavior.
The RSI in the "Uptrick: Market Moods" indicator is used to measure momentum. RSI is an essential component of many technical analysis strategies, and in this tool, it is used to identify potential market extremes. When RSI values are high, they indicate an overbought condition, meaning the market may be approaching a peak. Conversely, low RSI values suggest an oversold condition, signaling that the market could be nearing a bottom. These extremes provide crucial clues about shifts in market sentiment, helping traders gauge whether the current emotional state of the market is likely to result in a reversal. This understanding is pivotal in predicting whether the market is transitioning from calm to stressed or from excited to overbought.
The Average True Range adds another layer to this analysis by offering insights into market volatility. Volatility is a key factor in understanding the mood of the market, as periods of high volatility often reflect high levels of excitement or stress, while low volatility typically indicates a calm, steady market. ATR is calculated based on the range of price movements over a given period, and the higher the value, the more volatile the market is. The "Uptrick: Market Moods" indicator uses ATR to dynamically gauge volatility levels, helping traders understand whether the market is currently moving in a way that aligns with its emotional mood. For example, an increase in ATR accompanied by an RSI value that indicates overbought conditions could suggest that the market is in a highly excited state, with the potential for either strong momentum continuation or a sharp reversal.
Bollinger Bands complement these tools by providing visual cues about price volatility and the range within which the market is likely to move. Bollinger Bands plot two standard deviations away from a simple moving average of the price. This banding technique helps traders visualize how far the price is likely to deviate from its average over a certain period. The "Uptrick: Market Moods" indicator uses Bollinger Bands to establish price boundaries and identify breakout conditions. When prices break above the upper band or below the lower band, it often signals that the market is either highly stressed or excited. This breakout condition serves as a visual representation of the market mood, alerting traders to moments when prices are moving beyond typical ranges and when significant emotional shifts are occurring in the market.
Technically, the "Uptrick: Market Moods" indicator has been developed using TradingView’s Pine Script language, a highly efficient language for building custom indicators. It employs functions like ta.rsi, ta.atr, and ta.sma to perform the necessary calculations. The use of these built-in functions ensures that the calculations are both accurate and efficient, allowing the indicator to operate in real-time without lagging, even in volatile market conditions. The ta.rsi function is used to compute the Relative Strength Index, while ta.atr calculates the Average True Range, and ta.sma is used to smooth out price data for the Bollinger Bands. These functions are applied dynamically within the script, allowing the "Uptrick: Market Moods" indicator to respond to changes in market conditions in real time.
The user interface of the "Uptrick: Market Moods" indicator is designed to provide a visually intuitive experience. The market mood is color-coded on the chart, making it easy for traders to identify whether the market is calm, stressed, or excited at a glance. This feature is especially useful for traders who need to make quick decisions in fast-moving markets. Additionally, the indicator includes an interactive table that updates in real-time, showing the most recent mood state and its frequency. This provides valuable statistical insights into market behavior over specific time frames, helping traders track the dominant emotional state of the market. Whether the market is in a prolonged calm state or rapidly transitioning through moods, this real-time feedback offers actionable data that can help traders adjust their strategies accordingly.
The RSI component of the "Uptrick: Market Moods" indicator helps detect the speed and direction of price movements, offering insight into whether the market is approaching extreme conditions. By providing signals based on overbought and oversold levels, the RSI helps traders decide whether to enter or exit positions. The ATR element acts as a volatility gauge, dynamically adjusting traders’ expectations in response to changes in market volatility. Meanwhile, the Bollinger Bands help identify trends and potential breakout conditions, serving as an additional confirmation tool that highlights when the price has moved beyond normal boundaries, indicating heightened market excitement or stress.
Despite the robust capabilities of the "Uptrick: Market Moods" indicator, it does have limitations. In markets affected by sudden shifts, such as those driven by major news events or external economic factors, the indicator’s performance may not always be reliable. These external factors can cause rapid mood swings that are difficult for any technical analysis tool to fully anticipate. Additionally, the indicator’s complexity may pose a learning curve for novice traders, particularly those who are unfamiliar with the concepts of RSI, ATR, and Bollinger Bands. However, with practice, traders can become proficient in using the tool to its full potential, leveraging the insights it provides to better navigate market shifts.
For traders seeking a deeper understanding of market sentiment, the "Uptrick: Market Moods" indicator is an invaluable resource. It is recommended for those dealing with medium to high volatility instruments, where understanding emotional shifts can offer a strategic advantage. While it can be used on its own, integrating it with other forms of analysis, such as fundamental analysis and additional technical indicators, can enhance its effectiveness. By confirming signals with other tools, traders can reduce the likelihood of false signals and improve their overall trading strategy.
To further enhance the accuracy of the "Uptrick: Market Moods" indicator, it can be integrated with volume-based tools like Volume Profile or On-Balance Volume (OBV). This combination allows traders to confirm the moods identified by the indicator with volume data, providing additional confirmation of market sentiment. For example, when the market is in an excited mood, an increase in trading volume could reinforce the reliability of that signal. Conversely, if the market is stressed but volume remains low, traders may want to proceed with caution. Using multiple indicators together creates a more comprehensive trading approach, helping traders better manage risk and make informed decisions based on multiple data points.
In conclusion, the "Uptrick: Market Moods" indicator is a powerful and unique addition to the suite of technical analysis tools available on TradingView. It provides traders with a multi-dimensional view of market sentiment by combining the analytical strengths of RSI, ATR, and Bollinger Bands into a single tool. Its ability to capture and interpret the emotional mood of the market makes it an essential tool for traders seeking to gain an edge in understanding market behavior. While the indicator has certain limitations, particularly in rapidly shifting markets, its ability to provide real-time insights into market sentiment is a valuable asset for traders of all experience levels. Used in conjunction with other tools and sound trading practices, the "Uptrick: Market Moods" indicator offers a comprehensive solution for navigating the complexities of financial markets.

ATR Price Targets (Daily, Weekly, Monthly)This indicator calculates and displays dynamic price targets based on the Average True Range (ATR) for daily, weekly, and monthly timeframes. It’s designed to help traders set volatility-based price targets for more precise stop-losses, take-profit levels, and trade management.
Features:
Daily, Weekly, and Monthly ATR Targets: Automatically calculates and plots upper and lower price targets based on ATR values for each timeframe.
Risk Management Tool: Ideal for setting stop-loss and take-profit levels based on market volatility.
Customizable Settings: You can adjust the ATR length and multiplier to match your preferred trading style and risk tolerance.
Visual Alerts: Background colors change when price reaches or exceeds the calculated targets, providing easy visual cues for decision-making.
How to Use:
Use the upper and lower price targets to set realistic exit points for your trades.
Adjust the ATR multiplier for more or less conservative targets based on market volatility.
Apply this across multiple timeframes to combine long-term and short-term volatility trends.
This indicator is perfect for traders looking to incorporate volatility analysis into their trading strategy using ATR.
