TTP RSI drawdownThis indicator offers a way to trade the RSI drawdown combined together with its value.
Parameters
- Lookback. How many candles in the past are used to calculate the drawdown of the RSI
- RSI strength and timeframe
- Lower and Upper RSI limits. These are used to colour the drawdown chart, the greener the closed to your specified lower limit and the more red the closer to the upper limit. These limits are also used to confirm that the signal occurs with an RSI value within the given limits.
- Signal threshold. Buy signals will only be triggered when the drawdown of the RSI is higher than the provided value.
Buy signals
The signal will trigger in white color and will plot a 1 to allow backtesting.
TradingView alerts can be set for buy signals.
Buy signals will be trigger only when:
- RSI value is within the provided lower and upper limit values
- RSI drawdown is higher than the provided threshold.
Features
- Back-testable (plots 1 for buy)
- TV alerts
Chart modes
- show RSI
- show highest RSI
- show RSI drawdown
In the short time I've been playing with this new idea I noticed it can be used both for swing trading and for long term analysis like for example finding market bottoms.
Here's an example setup to find BTC past market cycle bottoms:
- load a chart with INDEX:BTCUSD
- set the chart timeframe to daily
- set the chart to logarithmic scale
- zoom out to see the full chart
- add the RSI drawdown indicator
- use the following parameters in the indicator: timeframe: week, gaps: off, show RSI drawdown: on, lookback:30, length:14, lower: 20, upper: 30: threshold: 40
Backtest

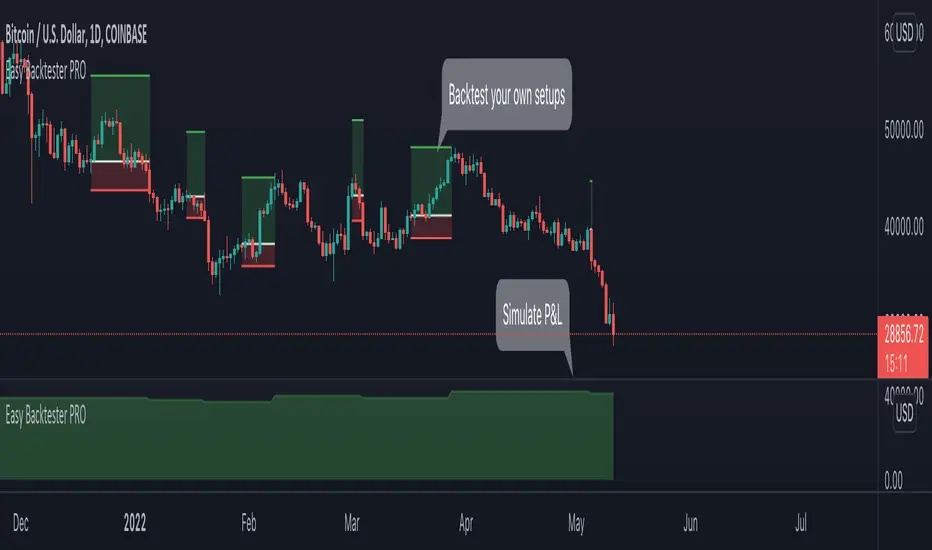
Easy Backtester PROWHAT IS EasyBacktester ?
EasyBacktester is a tool that helps you backtest trading strategies built by yourself with an included strategy builder and a multitude of options.
From within the parameters of the tool, you can specifically pick your entry settings across 12 most common indicators, such as "RSI", "MACD", "Moving Averages" etc... Then you can immediately visualise your setup's Stop-loss & Take Profit, your expected Profits & Loss and a lot of other statistics for your entry strategy. Once you are satisfied with your entry strategy, you are given a set of tools to optimize your setup using stop-loss rules, take profits rules, partial profits, trailing-stops, entry timing...
WHY IS THIS TOOL DIFFERENT ?
EasyBacktester is a backtesting engine with no coding skills required. TradingView allows for "Strategy Scripting" using PineScript, which is not an option for non-coder audience. EasyBacktester fills this gap and allow non-coders to get an idea of how their trading strategies may perform using mouse clicks only.
Some similar attempts have been made on TradingView, allowing some limited options, but none have the same capabilities EasyBacktester offers, for instance, as of April 2022 these features have not been seen in any other TradingView tools:
- partial take profits
- leverage simulation
- a multitude of trailing stop-loss possibilities including trail triggers and trail parameters
- visualisation of entries including stop-loss, take profits, partial take profits, and trailing stops. One can now visualize such complex setups.
- visualisation of Profits & Loss
- time in trade
- wait strategy after a signal: for example, when RSI is oversold, "WAIT until price retraces 100% of the original signal" amongst other possibilities
QUICK START GUIDE:
STEP 1: DEFINE YOUR SIGNAL STRATEGY
From the settings of the tool, find the "SIGNALS STRATEGY" section.
Select a type of entry you wish to simulate, for example "LONGs", and activate the checkbox right before "Simulate".
Right below, you will find 4 signal builder for you to play with and pick your strategy accordingly.
For example, to simulate a signal when RSI is oversold, follow these steps:
- On the 1st multiple choice box, select "RSI"
- On the 2nd multiple choice box, select "is below..."
- On the 3rd multiple choice box, select "OverSold level"
Don't forget to activate this rule by checking the checkbox in front of it.
After this first step, one should immediately see the chart affected with some plots. The dots represents the signal entry defined by the rule we just created, and the red/green boxes visually represent trades that could have been taken with this signal which, in this example, occurs "when RSI is below oversold level". Note that all specific parameters for RSI including its specific "oversold level" is customisable at the end of the tools settings along with all other indicators settings.
STEP 2: STATISTICS
By default, the "APPEARANCE" section only plots potential entry signals (materialized by dots) and actual entry boxes (materialized by red/green boxes).
But the user can easily add other precious statistics to the chart, and obviously the most important one for backtesting: Profits & Loss (P&L).
In the "STATISTICS" section please check the "P&L" box to see appear a chart of the simulated P&L for our example. You should immediately see a new graph below the chart representing the evolution of the P&L after each entry.
Other statistics are available to the user, including: Equity, Number of Trades, Time in Position, Number of trades Won, Number of trades Lost, Number of trades Stopped.
Play around with those to see them plotted on your chart.
STEP 3: OPTIMIZE YOUR ENTRY
Under the "ENTRY STRATEGY" section, one can pick how to enter AFTER the signal, which provides the user with an extensive flexibility to pick its timing.
Here there are a various set of choices offered, ranging from the default "Market Order at Next Candle Open", to "Limit Order: at signal's candle open" or even "Stop-Buy: at break of last candle high". As its name suggests, this option allows you to actually wait before randomly enter in trade.
It is important to also note that the user can totally prevent entry if the conditions are not filled after a customizable number of candles represented in "Max bars to wait for entry" (default being 1, meaning the engine will wait the condition to be filled during only 1 candle)
STEP 4: MANAGE YOUR RISK
Under the "RISK MANAGEMENT" section, the user is given a series of options to set the amount (s)he would like to risk.
This is extremely important to set, and is the result of a combination of customizable options including:
- the Initial Capital of the account
- the amount to risk per trade, and HOW to risk it: some fixed % the initial equity or adjust the stop-loss to the desired risk ?
- use of leverage or not
- initial stop-loss, as well as minimum and maximum
- trailing stop-loss: what should trigger the trailing ? and by how much should the engine trail ?
STEP 5: HAVE AN EXIT PLAN
Under the "EXIT STRATEGY", the user can define how to exit the trade.
For instance, here again a lot of options are given:
- Take Profit: exit at some level of profits defined by a multiple of the stop-loss, or a multiple of the ATR, or some % or points
- Partial Profit taking before exit
- Panic close position after some time spent on the trade
STEP 6: FURTHER OPTIMIZATIONS
Under the sections "Commissions" & "Calendar & Sessions", one can simulate real trading conditions by including commissions fees as well as filtering actual dates and trading sessions. These sections are straightforward for any user to use.
SETP 7: INDICATORS SETTINGS
Since EasyBacktester uses a predefined set of indicators to get started, those indicators are also customizable in the last section of the settings. Here, one can easily customize RSI periodicity, MACD lengths, Moving averages types & lengths, ATR, etc...
STEP 8: GOING FURTHER
This is only a start to give users an overview of how various options affect their trading performance. But of course, each trader has its special recipe and specific detailed setup that is not possible to embed in a single tool. For advanced simulation, EasyBacktester provides plug & play connectors for advanced users. Namely, there are 3 connectors:
- signal connector
- trail trigger connector
- exit connector
Each of these connectors are an opportunity to customize the engine signals, trail trigger and exit choices with the user's own options. This case does require a little bit of coding, but it can easily be implemented by copy-pasting existing resources or with a slight help of a professional. In fact, the only conditions to build a proper connector is to export a plot with the numbers 1 (for signals), 2 (for trigger trails) and 3 (for exits). Here is an example of custom SIGNAL connector compatible with EasyBacktester, to produce a signal when last RSI was below 30 and current RSI reads above 30:
============================================================
//@version=5
indicator("My custom RSI signal")
// when previous RSI 14 was below 30 and current RSI 14 is above 30, set "custom_signal" to 1, otherwise set "custom_signal" to 0
custom_signal = ta.rsi(close, 14) < 30 and ta.rsi(close, 14) > 30 ? 1 : 0
// Export a plot of "custom_signal", but do not display it
plot(custom_signal, title="my signal", display=display.none)
============================================================
Once this indicator has been built, the user only needs to connect it with EasyBacktester as follow:
1. Open a desired chart, and add both EasyBacktester indicator as well as the custom "My custom signal" we just created above.
2. Open EasyBacktester's settings, and in the first option, there is "Connect signals source" which by default is set to "close". In the multiple choices, find your custom signal which should be named something like "My custom RSI signal: my signal", generally speaking the name is built like this " : ".
3. Now the custom code is connected to EasyBacktester, but we need to indicate the engine we actually want to use it as custom signal.
4. Under the "SIGNALS STRATEGY" section, where we generally build signals rules, there is special rule for this specific connection named "Use external source as entry signal". Just check the checkbox to activate it and see how the chart took our custom signal into consideration.
That's it for the overview of EasyBacktester. Thank you for reading and happy trading :)
Backtesting- IndicatorFor anyone interested, Here is an example of how to put backtesting results into an Indicator. This calculates the same values as you find in the Summary Screen of the built in Strategy backtester. This will use the same result size as the standard backtester i.e. 5 minute chart grabs roughly 1 month of data, 1 minute chart grabs 1 week of data, etc... I tried to keep this as self-contained as possible so I put most of the code for the results in the bottom of the Indicator. The results stop at the last completed trade signal i.e. a Buy has a Sell to it. This is the same indicator I posted earlier with the PCT Trailing StopLoss so you will see that code in here as well. As said in my previous posting, the indicator is just a simple EMA crossover to give it something to do and I would not recommend using this indicator on its own, but instead copy the code to your own indicator if you find it useful. I also left the code in so that you can switch back to a Strategy if you want to verify the results.
Additional Notes:
- The results are within an acceptable margin of error due to the fact that the Indicator is having to calculate based on when the Buy and Sell Signal occur as opposed to when actual trades occur like in the Strategy Backtester
- I was trying to find a way to set the number of Buy Signals to use i.e. show me the results from the past 100 trades but couldn't sort out the logic. I am open to suggestions. Also keep in mind I am not a coder by profession so if you have any ideas on that front, please explain it to me as though I am a 5 year old child and provide code examples if possible :)
- I included the Strategy results in the Screen Shots so that you can see where the results line up.
Additional Additional Note:
This is not financial advice. Use at your own risk.

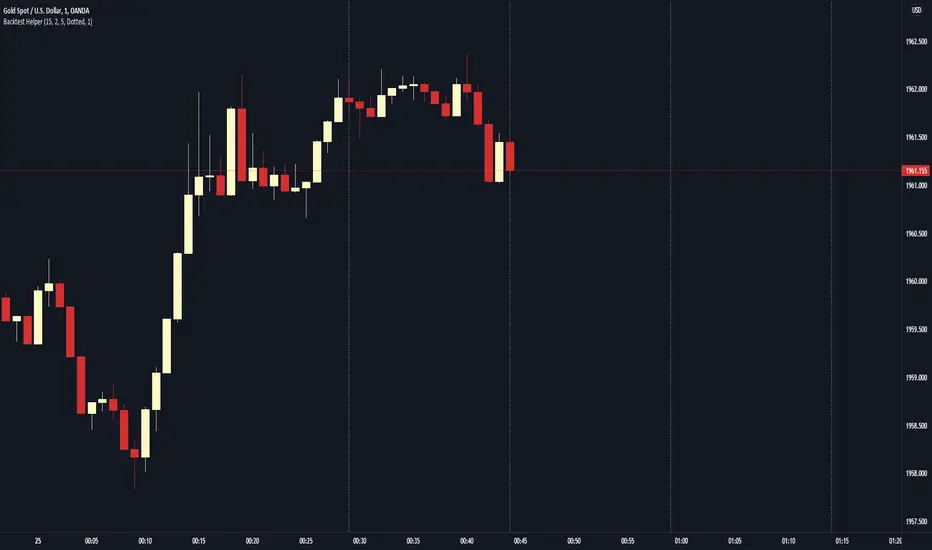
Backtest HelperAre you tired of being able to see the future while you're backtesting? Have you ever clicked to a higher timeframe in bar replay, only to realize you've just seen everything that's going to happen before you've had a chance to test it? If you've had this problem, Backtest Helper is here for YOU.
All you have to do is set a start date and time, then set your desired timeframe in minutes, then you're off to the races.
For example, if you're a scalper that uses the 15 minute as their higher timeframe, set your start time at the 14th minute of the session you're testing and set your line spacing at 15 minutes. This will mark off every 14th minute on the charts. Now you know the exact moment you can go up to the 15 minute timeframe!
On our 1 minute timeframe, this is how we'd look with the above settings. The Backtest Helper has marked off the 14th, 29th, 44th and 59th minute.
When we go up to our 15 minute, there's no issues. We're seeing the candle we want to see and not the next 15 minute candle.
You can use this for any timeframe. Just make sure you set your start time to at least 1 minute before the close of the candle and your line spacing to the higher timeframe (in minutes) you want to target.
Manual Backtest - Flat the ChartThis script is an utility tool for manual backtesting.
The main problem in backtesting a discretionary strategy is the bias of knowing the future result of the market, in this way all the market will be crushed into a flat line, this way you can avoid bias.
The way to use this indicator is easy and made by 4 step:
Step 1 : add to an asset you won't backtest and put the auto scale on
Step 2 : go to the asset you will backtest and scroll left until the date you want to start
Step 3 : use the replay function of tradingview (15 min chart won't go back more than 18 month)
Step 4: toggle off the indicator or remove from the chart (untill next asset to backtest)
That's not a complex indicator but is what you need to do a fair backtesting

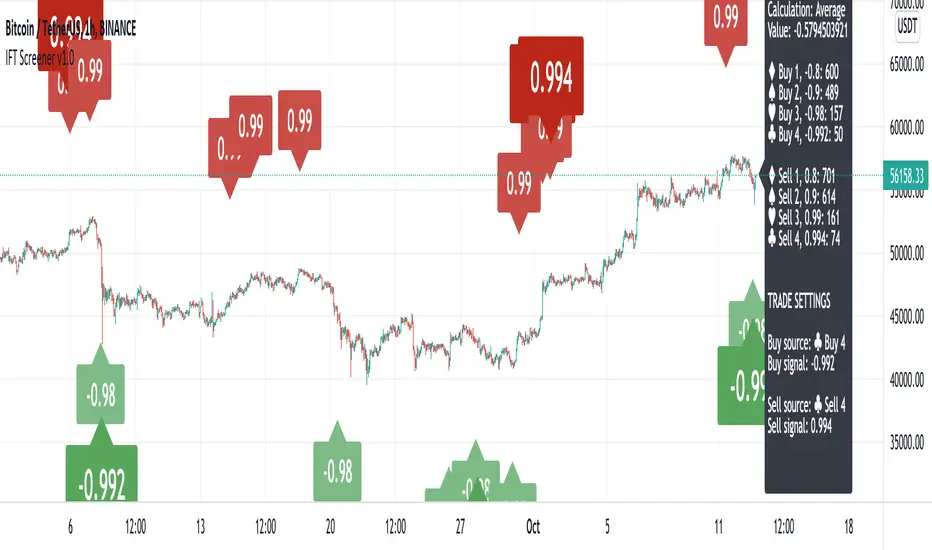
Inverse Fisher Transform ScreenerThis is a Screener for Inverse Fisher Transform on multiple oscillators
This tool is intended to aid you to visually analyse reasonable buy and sell IFT-signal thresholds across multiple tokens and different sources. It will help you speed up the tedious and manual work of trying out different IFT-settings when you're able to review the chart visually to find which values are present the most often and the location of that signal on the chart.
What does it bring to the table, why is it useful?
- Invese Fisher Transform on multiple oscillators such as RSI, MFI, CCI, Stochastic
- Combine multiple sources into one signal, select how it's calculated
- Visually review the chart for good IFT-settings
- 4 dynamic buy labels with different thresholds
- 4 dynamic sell labels with different thresholds
- Buy and sell on signal reversal
- Create your own trade alerts for automation
- Backtester compatible (plots 1 and 2 for buy and sell signals)
- A dynamic table counting amount of signals for each setting
- The labels are automatically updated when you change the values in the settings
How to use?
1. Change signal source and method
2. Change buy and sell thresholds
3. Show/hide additional labels
4. Review chart
5. Change trade settings
6. Backtest
7. Create alerts
Description
With this indicator you're able to visually review the signal strength of one or multiple oscillators processed with Inverse Fisher Transform ( IFT ), combine them and choose the method of calculation when they are combined. This produces a signal which strongly fluctuates between -1 and +1 instead of the more common 0-100 most oscillators uses. The intention is to make the decision making clearer and easier when you decide when to enter or exit a trade. This aims to help you remove the feelings from your trading.
Inverse Fisher Transform was first presented by John Ehlers in Stocks & Commodities V. 22:5 where he proposes to process RSI with the formula for hyperbolic tangent, tanh (x). This transforms the oscillator into a smoother and more compressed version with quicker oscillations.
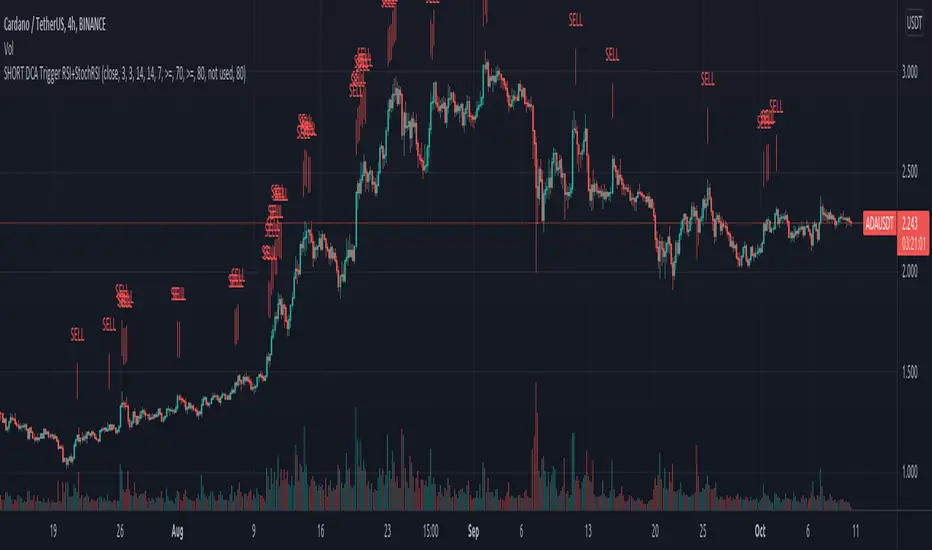
Zendog SHORT DCA Trigger RSI+StochRSIThis is a script that generates a SELL signal by combining RSI and Stochastic RSI into the same script and that can easily be integrated into an external Backtester like the one I published.
The script uses default values for RSI and Stochastic RSI overbought conditions.
They should be adjusted for specific assets and timeframes so they better match the current trend. Please beware you might overfit settings to match a short timeframe trend (like a few days or hours). If this is the case once the trend changes the signals will not be accurate.
The purpose of this script is to provide some pine code that can be used to further combine multiple indicators into a SHORT Deal Start signal.
Integration with the Zendog Backtster:
- add the backtester on the chart
- add this script on the chart
- in the Zendog backtester Deal start type select "External indicator"
- in the Zendog backtester Indicator source and value select "Zendog SHORT DCA Trigger RSI+StochRSI: SIGNAL"
Zendog LONG DCA Trigger RSI+StochRSIThis is a script that generates a BUY signal by combining RSI and Stochastic RSI into the same script and that can easily be integrated into an external Backtester like the one I published.
The script uses default values for RSI and Stochastic RSI oversold conditions.
They should be adjusted for specific assets and timeframes so they better match the current trend. Please beware you might overfit settings to match a short timeframe trend (like a few days or hours). If this is the case once the trend changes the signals will not be accurate.
The purpose of this script is to provide some pine code that can be used to further combine multiple indicators into a LONG Deal Start signal.
Integration with the Zendog Backtster:
- add the backtester on the chart
- add this script on the chart
- in the Zendog backtester Deal start type select "External indicator"
- in the Zendog backtester Indicator source and value select "Zendog LONG DCA Trigger RSI+StochRSI: SIGNAL"

VictoriaThis indicator visualises different oscillators processed through Inverse Fisher Transform
What is included:
Inverse Fisher Transform on different oscillators
You can combine multiple oscillators into one
The combination of sources can be calculated in different ways
Set different buy and sell signal thresholds
View selected thresholds in the chart
Use TradingView Technicals Buy and Sell signals to dynamically change threshold values
Convert signal to alerts
Multiple filters to allow or block signals
Backtest compatible
Alerts compatible
Two different chart modes:
You can view multiple oscillators in the same chart
You can view trade signals/alerts on the chart from the thresholds you have selected
Description:
With this indicator you're able to visually review the signal strength of one or multiple oscillators processed with Inverse Fisher Transform (IFT), combine them and choose the method of calculation when they are combined. This produces a signal which strongly fluctuates between -1 and +1 instead of the more common 0-100 most oscillators uses. The intention is to make the decision making clearer and easier when you decide when to enter or exit a trade. This aims to help you remove the feelings from your trading.
Inverse Fisher Transform was first presented by John Ehlers in Stocks & Commodities V. 22:5 where he proposes to process RSI with the formula for hyperbolic tangent, tanh(x). This transforms the oscillator into a smoother and more compressed version with quicker oscillations.
Within a bull or bear period of the traded asset the signal have different strengths. To harness this to our advantage we use the combined strength of the TradingView Technical indicator which gives us a Buy, Strong Buy, Sell or a Strong Sell on the selected timeframe and asset. This makes it possible to delay the buy in bearish conditions to only trigger when it is really oversold and also allow the signal be more relaxed and exit the trade sooner. While on the other hand if the condition is bullish the buy signal is relaxed and the sell requires a stronger signal. All of this is possible to change in the indicator to fine tune the settings for the specific asset and timeframe selected. We also have the possibility of blocking the buy signals with different filters.

QFL bull bypassThis bypass indicator triggers plots 1 when the price is above the QFL base.
This can be used as a "bypass" by a consumer indicator that can skip trades when the bypass is triggering.
You can use it for long and short strategies, to prevent using buy or sell signals in areas were the price is either overextended.
QFL works better in 1, 2 or 4 hours timeframes.

Inverse Fisher Transform on RSI for backtest w/alertsThis version of the Inverse Fisher Transform on RSI comes with support for
1) Backtesting with Gavin's backtest script
2) Bypass, you can use another indicator to pause buy signals from this indicator. Just create another indicator that plots "1" whenever you want to activate the bypass on the IFTRSI signal.
3) Independent buy and sell level thresholds. Some tokens perform better with a higher sell level, even levels as high as 0.996, sometimes the buy level can also be relaxed to even 0.6 and get incredible results on the 5 minute chart.
4) alerts for Buy and Sell signals
Make sure you add Gavin's backtest and select external signal and this indicator as the source.

TV signal for DCA backtestThis script allows you to backtest Trading View's "Technical Ratings" (Buy, Strong buy, Sell, Strong Sell) using Gavin's backtest script.
To use it add the backtest script to the chart together with this script and then from the back test settings connect the external indicator. You should select "TV Signal" as the source.
Backtesting works best on the 5m chart, but you can still change this script from its settings to higher timeframes.
Encoding
Buy is 1
Strong Buy is 2
Sell is -1
Strong Sell is -2
In the backtest script you can decide which rating you want to use for open deal and which one for close deal.
For example, if you were backtesting a long bot you could enter a long position when TV signal is Buy (1) and close the deal when TV signal is Sell (-1).
You have the full flexibility to decide which technical rating to use for your backtesting.
Enjoy!

Smart AlertsThis indicator provides back-tested signals and alerts from multiple technical indicators.
No more guessing whether or not you should trust an indicator. See your indicators' past performance at a glance.
No more false alarms. Disable re-painting of signals.
When multiple indicators overlap, a Confluence indicator will print (large triangle). With your settings properly tuned, this will show a HIGH probability of a move.
Current Signal/Alert Options (more to come):
RSI Oversold
RSI Overbought
EMA Crossing Up
EMA Crossing Down
Buy Signal Confluence
Sell Signal Confluence
Instructions:
-Enable/disable individual indicators so you can fine tune one at a time
-Adjust the indicator's settings
-Adjust your trade parameters (Max Wait, Take Profit %). Signals that would have given the desired profit in the time allowed will be painted orange.
-Repeat this process with each indicator until you're satisfied
-Set-up alerts

Smart EMA SignalsThis indicator starts by plotting each time the price action crosses above or below the EMA, of which you can tune the timeframe and duration.
It then takes it a step further and plots whether or not that indicator would have given you a profitable trade, of which you can also tune the parameters (Max wait time, and % Profit).
Once you have your EMA tuned to your liking, set up alerts to notify you of a golden opportunity.

QFL single TF with alertsBacktesting compatible QFL pine script w/alerts
This version of QFL was made based on this one:
From author:
www.tradingview.com
I made the following additions according to my requirements:
- I need to use pine script 4
- I needed to avoid repainting issues so I'm not calling directly security, I'm using the wrapper function.
- There might be still repainting issues when you use "max base age" which uses the function "barssince" so be careful, you can disable it by setting its value to zero.
- Alerts so I can use it for automated trading and bots
- In order to make this signal compatible with the backtest script there's an option provided in the settings. If you enable this option this indicator will plot 1 whenever there's a BUY signal. This will allow the backtest to pick the "QFL Buy" from external indicator so it can perform the backtest.
I recommend some of these settings to start playing with the chart in 15 min / QFL in 1, 2 or 4 hours.
The higher the TF the more conservative.
QFL with 3.5% is pretty popular but you can try higher QFL percentage settings for a more conservative approach.

Study Backtester [MS]Backtest your study like a strategy with our Study Backtester. Visualize your script's performance directly on the chart.
Simple to use, copy-paste a few lines of code (shown below) into your script, then set your script as input to the Study Backtester.
Visualize how your script performs against buy-and-hold over time, and get a nice print out of stats.
Settings
Set your buy and sell signal inputs
Add a stop loss
Choose normal or trailing stop loss
Choose the start date and time for backtesting
Set trading commissions
Use leverage or not
Set carry cost for leveraged trades
Version 1
Only supports buy-sell-buy-sell alternating signals. Any non-alternating signals will be ignored.
Testing begins with 1 share of the asset at your first buy signal.
Things To Note
This cannot enter or exit mid-candle. With the exception of the stop loss feature, which will calculate exits at the exact stop price.
Stops are not treated as stop-orders, but as market-exists at the stop (or trailing stop) price.
This DOES NOT take into account any loss of funds due to liquidation if price goes against you in a margin position.
Short positions are not currently supported.
Only `study` scripts are supported
How To Use
1) Add the following to the bottom your study's code.
//------------------------------------------------------------------------------
// FOR BACKTESTER
plot(buy ? 1 : sell ? -1 : na, title="Signals", display=display.none, editable=false)
2) Make sure `buy` and `sell` variables are assigned appropriately according to your strategy.
3) Add both your study and this script to your chart.
4) Set the "Signals Plot" setting of this script to: : Signals
5) Adjust this script's settings (start date, commission, stoploss, etc) as necessary.
PM us with any questions about this script.

MACD With Trend Filter: Visual Backtest Module TemplateSample Strategy: MACD Crossover with trend filter options
MA Filter : Price Close Above MA, Search for Buy, Price Close Below MA, Search for Sell
ADX Filter : Take trade only when ADX is above certain treshold
MACD Signal : MACD Cross above signal line while under 0 line indicate Buy Signal
MACD Cross below signal line while above 0 line indicate Sell Signal
-----------------------------
Using Alert Module:
Enable Alert --> Enable TV's alert and plot signal to chart
Alert Type --> Set to take Buy only, Sell only or Both alert
----------------------------
Using Backtest Module:
Enable Backtest --> Enable Backtest simulation
Backtest Type --> Set to take Buy only, Sell only or Both
SL Type -->
ATR : Set SL in ATR times Multiplier below/above entry price
Fixed : Set SL in fixed point below entry point (in 'Dollar'). e.g. for Stocks -> 0.5 equals to 50cent while for EURUSD currency -> 0.005 equal to 50 pips
HiLo Bar : Set SL at highest/lowest wick of previous bar plus/minus Fixed point. e.g. EURUSD HiLo=3 and Fixed Point = 0.0005, buy trade will place SL 5 Pips below lowest of previous 3 bar
SL ATR Period --> Set Lookback Period used for SL's ATR calculation
SL ATR Multi --> Set ATR Multiplier for SL
SL Fixed --> Set Fixed Level for SL (Use when SL Type is either Fixed or HiLo Bar)
SL Bar --> Set Number of previous bar to check for SL placement
TP RR Ratio --> Set TP based on RR multiplier. e.g. 2 means TP level will be twice further from entry point compared to Entry-SL distance.
Notes: The point is for preliminary testing, so it only supports 1 trade at a time and no Trailing Stop
----------------------------
Disclaimer:
This script main objective is to create my personal indicator template so that i just have to modify the indicator module for preliminary testing in future.
Testing Alert Module so i can re-use it as template in future study/indicator
Testing Visual Backtest Module so i can re-use it as template in future study/indicator
i believe using Strategy function is a better approach for this but the entry/exit level seems to be hit n miss (at least for me, still trying to figure what i did wrong)
also, i rather code the strategy in other platform where i can use the more accurate tick data if i want to validate backtest statistics.
My study scripts was built only to test/visualize an idea to see its viability and if it can be used to optimize existing strategy.
credit: ADX code are originally from "ADX and DI" by @BeikabuOyaji although i re-wrote so i can have cleaner read and use RMA instead of SMA

Multi Time Frame Buy&Sell V4.0 [ALERTSETUP]Hi guys,this indicator Developed for Intraday and multi Time Frame Trading. Note: Invite only Script.Request to me Access permission to test this.
*** THIS IS STUDY VERSION ***
Time Frame : can use for 15 min / 30 min / 1h / 4h time
15 min configuration is best result for bitcoin and ethereum .
This can be used : Crypto Currency/ Bitcoins / ethereum ,Forex,currencies ,Index ,Commodity Gold / silver , Oil Market and in Equity / Futures
ETHUSDT Futures 15min
BTCUSDT Futures 15min:
GOLD /USD FOREX 15min:
HOW IT WORKS:
this indicator analyze EMA&SMA support and resistance then combine with pivot point and fibo levels is used to calculate the signals.and finally show entry label on
chart with target point and stop loss
HOW TO USE:
Creating a signal is as simple as adding the indicator called to your chart(buy or sell)label and background color change ( green=buy / red = sell)
green line is target and black line is stop loss.
in top of setting page you can see noise filter option . that can change it to get better result and reduce noise. in setting can set 3 target level and stoploss
NOT:all information show to info panel in chart.
strategy tester : enabled .All you can test this in live market in any segment.
NOT: can to change noise filter in setting setup until to get best result.
Choose any Date Month Year to Current Date and check the results below in the Strategy Tester.
REPAINT/NO REPAINT : No Repaint ,entery labal(buy or sell) and Background Color wont change. In the current candle position wait for the candle to close to see the
stability.
"Set alert": Select "Once per bar close" for your alert options.
There are 5 alerts:
- BUY
- SELL
- BUY OR SELL (for free TV users)
- take profit
- stop loss
To Get access - Send me a private chat message in tradingview.com to get access.Or request in comment section below.
Review and Feedback.Thank you!
Any issues report to me to Fix.Thank you!
Use the link below to obtain access to this indicator:

Logistic RSI, STOCH, ROC, AO, ... by DGTExperimental attemt of applying Logistic Map Equation for some of widly used indicators.
With this study "Awesome Oscillator (AO)", "Rate of Change (ROC)", "Relative Strength Index (RSI)", "Stochastic (STOCH)" and a custom interpretation of Logistic Map Equation is presented
Calculations with Logistic Map Equation makes sense when the calculated results are iterated many times within the same equation.
Here is the Logistic Map Equation : Xn+1 = r * Xn * (1 - Xn)
Where, the value of r is the key for this equation which changes amazingly the behaviour of the Logistic Map.
The value we have asigned for r is less then 1 and greater than 0 ( 0 < r < 1) and in this case the iterations performed with the maximum number of output series allowed by Pine is quite enough for our purpose and thanks to arrays we can easiliy store them for further processing
What we have as output:
Each iteration result is then plotted (excluding plotting the first iteration), as circles or line based on user preference
Values above and below zero level (0) are coloured differently to emphasis bull and bear power
Finally Standard Deviation of Array's Elements is ploted as line. Users may choose to display this line only
So where it comes the indicators "Awesome Oscillator (AO)", "Rate of Change (ROC)", "Relative Strength Index (RSI)", "Stochastic (STOCH)".
Those are the indicators whose values are assigned to our key varaiable in the Logistic Map equation forulma which is r
Further details regarding Logistic Map can found under the description of “Logistic EMA w/ Signals by DGT” study
Disclaimer:
Trading success is all about following your trading strategy and the indicators should fit within your trading strategy, and not to be traded upon solely
The script is for informational and educational purposes only. Use of the script does not constitute professional and/or financial advice. You alone have the sole responsibility of evaluating the script output and risks associated with the use of the script. In exchange for using the script, you agree not to hold dgtrd TradingView user liable for any possible claim for damages arising from any decision you make based on use of the script

MACD-X, More Than MACD by DGTMoving Average Convergence Divergence – MACD
The most popular indicator used in technical analysis, the moving average convergence divergence (MACD), created by Gerald Appel. MACD is a trend-following momentum indicator, designed to reveal changes in the strength, direction, momentum, and duration of a trend in a financial instrument’s price
Historical evolution of MACD,
- Gerald Appel created the MACD line,
- Thomas Aspray added the histogram feature to MACD
- Giorgos E. Siligardos created a leader of MACD
MACD employs two Moving Averages of varying lengths (which are lagging indicators) to identify trend direction and duration. Then, MACD takes the difference in values between those two Moving Averages (MACD Line) and an EMA of those Moving Averages (Signal Line) and plots that difference between the two lines as a histogram which oscillates above and below a center Zero Line. The histogram is used as a good indication of a security's momentum.
Mathematically expressed as;
macd = ma(source, fast_length) – ma(source, slow_length)
signal = ma(macd, signal_length)
histogram = macd – signal
where exponential moving average (ema) is in common use as a moving average (ma)
fast_length = 12
slow_length = 26
signal_length = 9
The MACD indicator is typically good for identifying three types of basic signals ;
Signal Line Crossovers
A Signal Line Crossover is the most common signal produced by the MACD. On the occasions where the MACD Line crosses above or below the Signal Line, that can signify a potentially strong move. The standard interpretation of such an event is a recommendation to buy if the MACD line crosses up through the Signal Line (a "bullish" crossover), or to sell if it crosses down through the Signal Line (a "bearish" crossover). These events are taken as indications that the trend in the financial instrument is about to accelerate in the direction of the crossover.
Zero Line Crossovers
Zero Line Crossovers occur when the MACD Line crossed the Zero Line and either becomes positive (above 0) or negative (below 0). A change from positive to negative MACD is interpreted as "bearish", and from negative to positive as "bullish". Zero crossovers provide evidence of a change in the direction of a trend but less confirmation of its momentum than a signal line crossover
Divergence
Divergence is another signal created by the MACD. Simply, divergence occurs when the MACD and actual price are not in agreement. A "positive divergence" or "bullish divergence" occurs when the price makes a new low but the MACD does not confirm with a new low of its own. A "negative divergence" or "bearish divergence" occurs when the price makes a new high but the MACD does not confirm with a new high of its own. A divergence with respect to price may occur on the MACD line and/or the MACD Histogram
Moving Average Crossovers , another hidden signal that MACD Indicator identifies
Many traders will watch for a short-term moving average to cross above a longer-term moving average and use this to signal increasing upward momentum. This bullish crossover suggests that the price has recently been rising at a faster rate than it has in the past, so it is a common technical buy sign. Conversely, a short-term moving average crossing below a longer-term average is used to illustrate that the asset's price has been moving downward at a faster rate and that it may be a good time to sell.
Moving Average Crossovers in reality is Zero Line Crossovers, the value of the MACD indicator is equal to zero each time the two moving averages cross over each other. For easy interpretation by trades, Zero Line Crossovers are simply described as positive or negative MACD
False signals
Like any forecasting algorithm, the MACD can generate false signals. A false positive, for example, would be a bullish crossover followed by a sudden decline in a financial instrument. A false negative would be a situation where there is bearish crossover, yet the financial instrument accelerated suddenly upwards
What is “MACD-X” and Why it is “More Than MACD”
In its simples form, MACD-X implements variety of different calculation techniques applied to obtain MACD Line, ability to use of variety of different sources , including Volume related sources, and can be plotted along with MACD in the same window and all those features are available and presented within a single indicator, MACD-X
Different calculation techniques lead to different values for MACD Line, as will further discuss below, and as a consequence the signal line and the histogram values will differentiate accordingly. Mathematical calculation of both signal line and the histogram remain the same.
Main features of MACD-X ;
1- Introduces different proven techniques applied on MACD calculation , such as MACD-Histogram, MACD-Leader and MACD-Source, besides the traditional MACD (MACD-TRADITIONAL)
• MACD-Traditional , by Gerald Appel
It is the MACD that we know, stated as traditional just to avoid confusion with other techniques used with this study
• MACD-Histogram , by Thomas Aspray
The MACD-Histogram measures the distance between MACD and its signal line (the 9-day EMA of MACD). Aspray developed the MACD-Histogram to anticipate signal line crossovers in MACD. Because MACD uses moving averages and moving averages lag price, signal line crossovers can come late and affect the reward-to-risk ratio of a trade. Bullish or bearish divergences in the MACD-Histogram can alert chartists to an imminent signal line crossover in MACD
The MACD-Histogram represents the difference between MACD and its 9-day EMA, the signal line. Mathematically,
macdx = macd - ma(macd, signal_length)
Aspray's contribution served as a way to anticipate (and therefore cut down on lag) possible MACD crossovers which are a fundamental part of the indicator.
Here come a question, what if repeat the same calculations once more (macdh2 = macdh - ma(macdh, signal_length), will it be even better, this question will remain to be tested
• MACD-Leader , by Giorgos E. Siligardos, PhD
MACD Leader has the ability to lead MACD at critical situations. Almost all smoothing methods encounter in technical analysis are based on a relative-weighted sum of past prices, and the Leader is no exception. The concealed weights of MACD Leader are such that more relative weight is used in the more recent prices than the respective weights used by the components of MACD. In effect, the Leader expresses more changes in average price dynamics for the recent price movement than MACD, thus eventually leading MACD, especially when significant trend changes are about to take place.
Siligardos creates two less-laggard moving averages indicators in its formula using the same periods as follows
Indicator1 = ma(source, fast_length) + ma(source - ma(source, fast_length), fast_length)
Indicator2 = ma(source, slow_length) + ma(source - ma(source, slow_length), slow_length)
and then take the difference:
Indicator1 - Indicator2
The result is a new MACD Leader indicator
macdx = macd + ma(source - fast_ma, fast_length) - ma(source - slow_ma, slow_length)
• MACD-Source , a custom experimental interpretation of mine ,
MACD Source, presents an application of MACD that evaluates Source/MA Ratio, relatively with less lag, as a basis for MACD Line, also can be expressed as source convergence/divergence to its moving average. Among the various techniques for removing the lag between price and moving average (MA) of the price, one in particular stands out: the addition to the moving average of a portion of the difference between the price and MA. MACD Source, is based on signal length mean of the difference between Source and average value of shot length and long length moving average of the source (Source/MA Ratio), where the source is actual value and hence no lag and relatively less lag with the average value of moving average of the source . Mathematically expressed as,
macdx = ma(source - avg( ma(source, fast_length), ma(source, slow_length) ), signal_length)
MACD Source provides relatively early crossovers comparing to MACD and better momentum direction indications, assuming the lengths are set to same values
For further details, you are invited to check the following two studies, where the first seeds were sown of the MACD-Source idea
Price Distance to its Moving Averages study, adapts the idea of “Prices high above the moving average (MA) or low below it are likely to be remedied in the future by a reverse price movement", presented in an article by Denis Alajbeg, Zoran Bubas and Dina Vasic published in International Journal of Economics, Commerce and Management
First MACD like interpretation comes with the second study named as “ P-MACD ”, where P stands for price, P-MACD study attempts to display relationship between Price and its 20 and 200-period moving average. Calculations with P-MACD were based on price distance (convergence/divergence) to its 200-period moving average, and moving average convergence/divergence of 20-period moving average to 200-period moving average of price.
Now as explained above, MACD Source is a one adapted with traditional MACD, where Source stands for Price, Volume Indicator etc, any source applicable with MACD concept
2- Allows usage of variety of different sources, including Volume related indicators
The most common usage of Source for MACD calculation is close value of the financial instruments price. As an experimental approach, this study will allow source to be selected as one of the following series;
• Current Close Price (close)
• Average of High, Low, and Close Price (hlc3)
• On Balance Volume (obv)
• Accumulation Distribution (accdist)
• Price Volume Trend (pvt)
Where,
-Current Close Price and Average of High, Low, and Close Price are price actions of the financial instrument
- Accumulation Distribution is a volume based indicator designed to measure underlying supply and demand
- On Balance Volume (OBV) , is a momentum indicator that measures positive and negative volume flow
- Price Volume Trend (PVT) is a momentum based indicator used to measure money flow
3- Can be plotted along with MACD in the same window using the same scaling
Default setting of MACD-X will display MACD-Source with Current Close Price as a source and traditional MACD can be plotted eighter as a companion of MACD-X or can be selected to be plotted alone.
Applying both will add ability to compare, or use as a confirmation of one other
In case, traditional MACD Is plotted along with MACD-X to avoid misinterpreting, the lines plotted, the area between MACD-X Line and Signal-X Line is highlighted automatically, even if the highlight option not selected. Otherwise highlight will be applied only if that option selected
4- 4C Histogram
Histogram is plotted with four colors to emphasize the momentum and direction
5- Customizable
Additional to ability of selecting Calculation Method, Source, plotting along with MACD, there are few other option that allows users to customize the MACD-X indicator
Lengths are configurable, default values are set as 12, 26, 9 respectively for fast, slow and smoothing length. Setting lengths to 8,21,5 respectively Is worth checking, slower length moving averages will lead to less lag and earlier reaction to price actions but yet requires a caution and back testing before applying
Highlight the area between MACD-X Line and Signal-X Line, with colors emphasising the direction
Label can be added to display Calculation Method, Source and Length settings, the aim of this label is to server only as a reminder to trades to be aware of settings while they are occupied with charts, analysis etc.
Here comes another question, which is of more importance having the reminder or having the indicators with multi timeframe feature? Build-in Multi Time Frame features of Pine is not supported when labels and lines introduced in the script, there are other methods but brings complexity. To be studied further, this version will be with labels for time being.
Epilogue
MACD-X is an alternative variant of MACD, the insight/signals provided by MACD are also applicable to MACD-X with early and clear warnings for the changes in the trend.
If MACD is essential to your analysis, then it is my guess that after using the MACD-X for a while and familiarizing yourself with its unique character and personality, you will make it an inseparable companion to other indicators in your charts.
The various signals generated by MACD/MACD-X are easily interpreted and very few indicators in technical analysis have proved to be more reliable than the MACD, and this relatively simple indicator can quickly be incorporated into any short-term trading strategy
Disclaimer : Trading success is all about following your trading strategy and the indicators should fit within your trading strategy, and not to be traded upon solely
The script is for informational and educational purposes only. Use of the script does not constitutes professional and/or financial advice. You alone the sole responsibility of evaluating the script output and risks associated with the use of the script. In exchange for using the script, you agree not to hold dgtrd TradingView user liable for any possible claim for damages arising from any decision you make based on use of the script

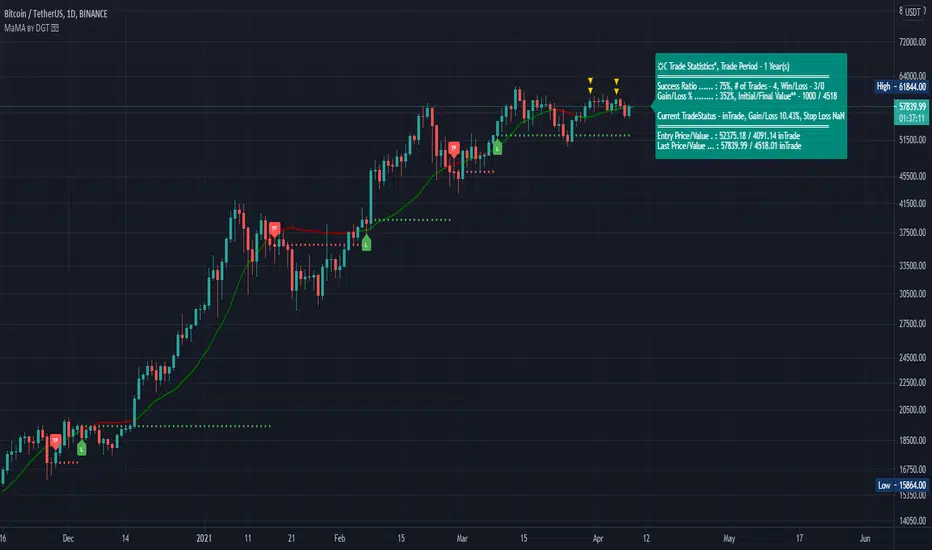
Momentum adjusted Moving Average by DGTA brand new Moving Average , calculated using Momentum, Acceleration and Probability (Psychological Effect).
Momentum adjusted Moving Average(MaMA) is an indicator that measures Price Action by taking into consideration not only Price movements but also its Momentum, Acceleration and Probability. MaMA, provides faster responses comparing to the regular Moving Average
Here is the math of the MaMA idea
Momentum measures change in price over a specified time period
momentum = source – source(length)
where,
source, indicates current bar’s price value
source(length), indicates historical price value of length bars earlier
Lets play with this formula and rewrite it by moving source(length) to other side of the equation
source = source(length) + momentum
to avoid confusion let’s call the source that we aim to predict as adjustedSource
adjustedSource = source(length) + momentum
looks nice the next value of source simply can be calculated by summing of historical value of the source value and value of the momentum. I wish it was so easy, the formula holds true only when the momentum is conserved/constant/steady but momentum move up or down with the price fluctuations (accelerating or decelerating)
Let’s add acceleration effects on our formula, where acceleration is change in momentum for a given length. Then the formula will become as (skipped proof part of acceleration effects, you may google for further details)
adjustedSource = source(length) + momentum + 1/2 * acceleration
here again the formula holds true when the acceleration is constant and once again it is not the case for trading, acceleration also changes with the price fluctuations
Then, how we can benefit from all of this, it has value yet requires additional approaches for better outcome
Let’s simulate behaviour with some predictive approach such as using probability (also known as psychological effect ), where probability is a measure for calculating the chances or the possibilities of the occurrence of a random event. As stated earlier above momentum and acceleration are changing with the price fluctuations, by using the probability approach we can add a predictive skill to determine the likelihood of momentum and acceleration changes (remember it is a predictive approach). With this approach, our equations can be expresses as follows
adjustedSource = source(length) + momentum * probability
adjustedSource = source(length) + ( momentum + 1/2 * acceleration ) * probability , with acceleration effect
Finally, we plot MaMA with the new predicted source adjustedSource, applying acceleration effect is made settable by the used from the dialog box, default value is true.
What to look for:
• Trend Identification
• Support and Resistance
• Price Crossovers
Recommended settings are applied as default settings, if you wish to change the length of the MaMA then you should also adjust length of Momentum (and/or Probability). For example for faster moving average such as 21 period it would be suggested to set momentum length to 13
Alternative usage , set moving average length to 1 and keep rest lengths with default values, it will produce a predictive price line based on momentum and probability. Experience acceleration factor by enabling and disabling it
Conclusion
MaMA provide an added level of confidence to a trading strategy and yet it is important to always be aware that it implements a predictive approach in a chaotic market use with caution just like with any indicator
Trading success is all about following your trading strategy and the indicators should fit within your trading strategy, and not to be traded upon solely
Disclaimer : The script is for informational and educational purposes only. Use of the script does not constitutes professional and/or financial advice. You alone the sole responsibility of evaluating the script output and risks associated with the use of the script. In exchange for using the script, you agree not to hold dgtrd TradingView user liable for any possible claim for damages arising from any decision you make based on use of the script
Momentum Acceleration by DGTItalian physicist Galileo Galilei is usually credited with being the first to measure speed by considering the distance covered and the time it takes. Galileo defined speed as the distance covered during a period of time. In equation form, that is v = Δd / Δt where v is speed, Δd is change in distance, and Δt is change in time. The Greek symbol for delta, a triangle (Δ), means change.
Is the speed getting faster or slower?
Acceleration will be the answer, acceleration is defined as the rate of change of speed over a set period of time, meaning something is getting faster or slower. Mathematically expressed, acceleration denoted as a is a = Δv / Δt , where Δv is the change in speed and Δt is the change in time.
How to apply in trading
Lets think about Momentum, Rate of Return, Rate of Change all are calculated in almost same approach with Speed
Momentum measures change in price over a specified time period,
Rate of Change measures percent change in price over a specified time period,
Rate of Return measures the net gain or loss over a specified time period,
And Speed measures change in distance over a specified time period
So we may state that measuring the change in distance is also measuring the change in price over a specified time period which is length, hence
speed can be calculated as (source – source )/length and acceleration becomes (speed – speed )/length
In this study acceleration is used as signal line and result plotted as arrows demonstrating bull or bear direction where direction changes can be considered as trading setups
Just a little fun, since we deal with speed the short name of the study is named after famous cartoon character Speedy Gonzales
Trading success is all about following your trading strategy and the indicators should fit within your trading strategy, and not to be traded upon solely
Disclaimer: The script is for informational and educational purposes only. Use of the script does not constitutes professional and/or financial advice. You alone the sole responsibility of evaluating the script output and risks associated with the use of the script. In exchange for using the script, you agree not to hold dgtrd TradingView user liable for any possible claim for damages arising from any decision you make based on use of the script

Candle Crawler V1 [Moon]Candle Crawler is designed to crawl back through candle and bar data to retrieve specific values of interest.
The first implementation shows
Total bars or candles on any specific time frame or asset to the beginning of the chart. This can be used for backtesting or looking for specific assets / time frames that have a lot of backtest data.
- *usually* More backtest data = More accurate strategy implementation or live testing.
Crawls back and counts Red vs Green candles in a defined period (the max is 4999 total bars).
Use this to identify bearish or bullish trends and assets.
- *hint* if an asset through time is leaning heavily one way, a long-only or short-only strategy may be worth investigating.
Plots days of the week on each candle within it's specific day (turned off by default).
Default view of Total Candles + R/G (note if you want to turn off the labels go to the "Style" tab and just uncheck "Labels" at the bottom).
Works on any asset or timeframe including stocks and forex.
Easily filter days on or off to identify specific patterns or trends (check the "days of the week" box for ON|OFF) or head to the "style" tab to customize days or colors.
Most precise on the Daily (D) timeframe, but applicable on any.
If interested send me a DM.
