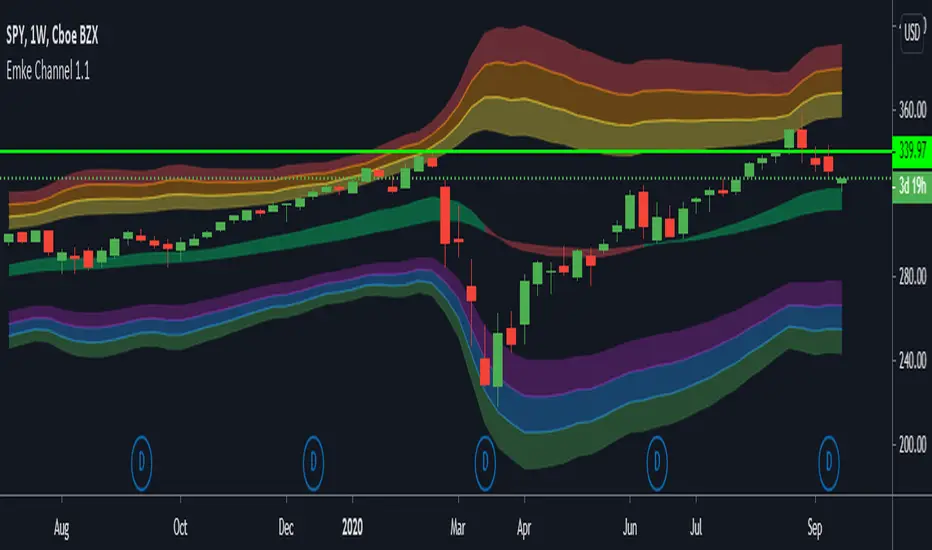
Torben BandsExtending the Works of Torben Mogensen, on Torben Median
Median Filtering is an important technique !
The median filter is a non-linear digital filtering technique, often used to remove noise from an image or signal. Such noise reduction is a typical pre-processing step to improve the results of later processing (for example, edge detection on an image). Median filtering is very widely used in digital image processing because, under certain conditions, it preserves edges while removing noise (but see the discussion below), also having applications in signal processing.
How its made?
Torben Medians of high and low of period of 21 are combined with ATR adjustments and plotted over the price
Enjoy!
Bands

VIX Implied Move Bands for ES/Emini futuresThis script uses the close of the VIX on a daily resolution to provide the 'implied move' for the E-mini SP500 futures. While it can be applied to any equity index, it's crucial to know that the VIX is calculated using SPX options, and may not reflect the implied volatility of other indices. The user can adjust the length of the moving average used to calculate the bands, the window of days used to calculate the implied move, and the multiplier that effects the width of the bands.

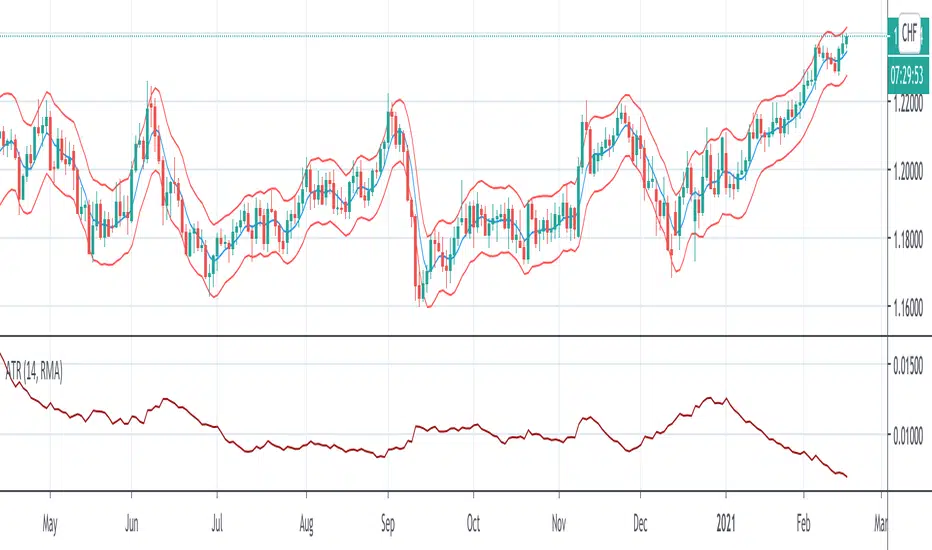
Arnaud Legoux Moving Average With ATR BandsArnaud Legoux Moving Average With ATR Bands to get an idea of the volatility.
FibBand, Perfect Trendline Trader and Target SystemSo, Dear Friends, I am open-sourcing one of my scripts which I created as a thesis project,
The Auto Trader System is a Scalping Tool , to be used mostly in intraday Setups!!
and is designed using,
1. Fibonacci Bands
Fibo Bands are Calculated by defining dynamic Fibonacci Pivots Lines over a history of Lookup values (Default is 89 periods lookback),
The bands help in identifying the Target Points for the setup
2. Perfect TrendLine Setup
The script uses PTS, as a filter to define the optimum entry and exit points
Which timeframe it works for ?
Works for Any Time Frame, but Intraday setups are good!
Who is this System for ?
Beginner and Intermediate Traders
Provision For Alerts
The Script has provision for both long and short alerts!!
Enjoy!
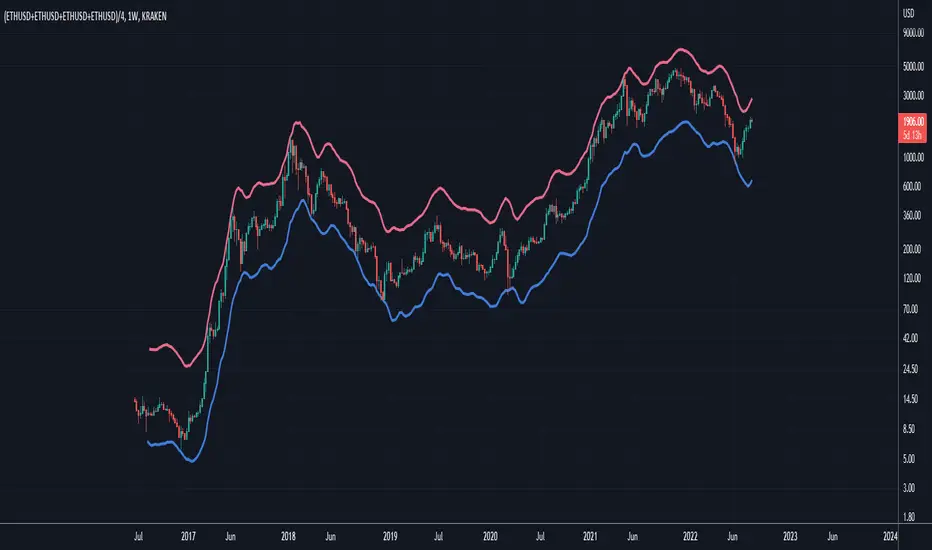
Ethereum: Confidence BandsPurpose of this Script
Similar to "Bitcoin: Confidence Bands", this script is designed to show regions of positive and negative overextension for Ethereum, where price is expected to either reverse long-term or at least shorter-term, using custom price loops tuned for the Ethereum case. Again, the idea is that one can be highly confident that Ethereum's price stays within the Confidence Bands, especially when looking at weekly closes. It might be wise to reduce exposure to Ethereum when price gets very near to the red band, and vice versa for an approach of the blue band. Of course this constitutes no financial advice, and one should always consider all available information for making trading decisions.
Settings
This indicator should only be used:
- with the default inputs (but of course feel free to play around a bit for testing purposes)
- on the weekly (W) time frame
- and for the following ticker setup, used to get well averaged Ethereum price data (ideally just copy this and paste it into the ticker field in the upper left area of the chart interface): (KRAKEN:ETHUSD+COINBASE:ETHUSD+BITFINEX:ETHUSD+POLONIEX:ETHUSD)/4
Otherwise the intended functionality cannot be guaranteed.
Access
For access please contact me via DM on TradingView or on Twitter (linked on my TradingView profile and in my signature).
Bitcoin: Confidence BandsPurpose of this Script
This script is designed to show regions of positive and negative overextension for Bitcoin, where price is expected to either reverse long-term or at least shorter-term, using custom price loops. The idea is that one can be highly confident that Bitcoin's price stays within the Confidence Bands, especially when looking at weekly closes. It might be wise to reduce exposure to Bitcoin when price gets very near to the red band, and vice versa for an approach of the blue band. Of course this constitutes no financial advice, and one should always consider all available information for making trading decisions.
Settings
This indicator should only be used:
- with the default inputs (but of course feel free to play around a bit for testing purposes)
- on the weekly (W) time frame
- and for the BraveNewCoin Liquid Index for Bitcoin (BNC:BLX).
Otherwise the intended functionality cannot be guaranteed.
Access
For access please contact me via DM on TradingView or on Twitter (linked on my TradingView profile and in my signature).

Flunki RSI Candles 2x LinReg 2x BandsHerewith ;
RSI as Candles
With Linear Regression and a multiplied Linear Regression
With Adaptive Deviation Bands
Background highlighter highlights breaking of the slow / wide band.
I like it for scalping tops and bottoms on low time frames, but have a play..
The linear regression slopes show trend and divergence, might include divergence flags later....
Last script of 2020, wew.

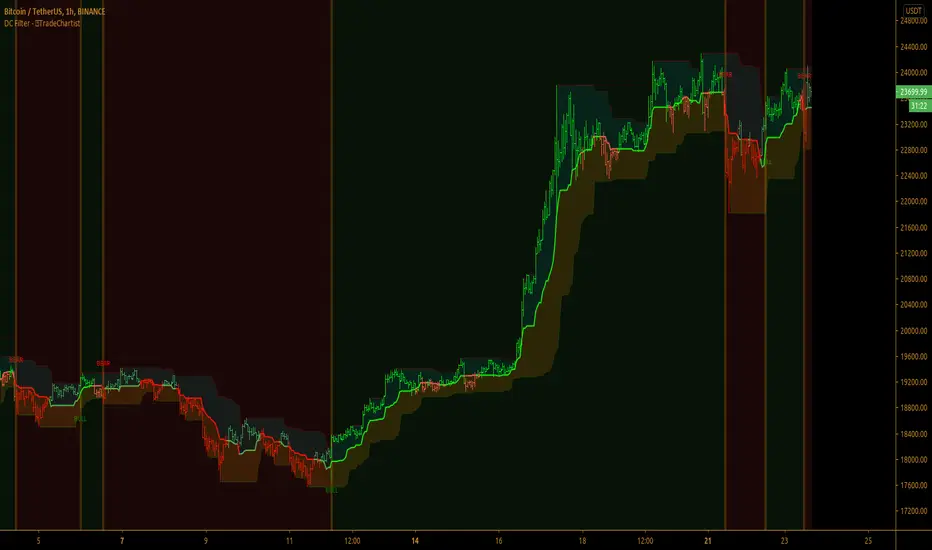
TradeChartist Donchian Channels Breakout Filter™TradeChartist Donchian Channels Breakout Filter is an elegant version of the classic Donchian Channels with few extra variations and option to filter breakouts based on user preferred Breakout price selection to generate Trade Entries.
===================================================================================================================
Features of ™TradeChartist Donchian Channels Breakout Filter
======================================================
Option to plot Donchian Channels of user preferred length, based on the Source price in addition to High/Low Donchian Channels.
Generates trade entries based on user preferred Breakout Price. For example, if the user prefers HL2 as breakout price, irrespective of the Donchian Channels type, trade entries are generated only when hl2 price (average of high/low) breaks out of the upper or lower band.
Option to plot background colour based on Breakout trend. The bull zones are filled with green background, the Bear zones are filled with red background and the bar that broke out is filled with orange background.
Option to colour price bars using Donchian Channels price trend. The Donchian Channels basis line is plotted using the same colours as coloured bars as default.
Alerts can be created for long and short entries using Once per Bar Close .
Note: This script does not repaint . To use the script for trade entries, wait for the bar close and use a second confirmator (includes fundamentals) based on asset type as some markets require users to have good pulse on the fundamentals as trading by Technicals/price action dynamic alone may not be safe.
===================================================================================================================
Best Practice: Test with different settings first using Paper Trades before trading with real money
===================================================================================================================
This is not a free to use indicator. Get in touch with me (PM me directly if you would like trial access to test the indicator)
Premium Scripts - Trial access and Information
Trial access offered on all Premium scripts.
PM me directly to request trial access to the scripts or for more information.
===================================================================================================================
PHInkTrade Price FinderHello there, fellow trader!
Welcome to Price Finder indicator for TradingView page.
Please join me as I present you an overview about it.
Before we begin, a few quick notes:
Availability information is presented at the last section of this content. Please check it out to know how to get access.
In addition to this description, there is also an overview video available. Please refer to the last section on this content as well.
With time, some of the functionality described below may change. Please refer to Release Notes for most up-to-date information.
Ok now, let's get started!
What is Price Finder?
Price Finder is a technical analysis indicator (aka "Indi" ), built on a mathematical foundation which recognizes price's fractal, multi-layered nature -- a key aspect, related to the multiple time-frames process different size traders use to make their decisions.
The objective of the indicator, naturally, is to help identify high probability opportunities for successful trades , especially those which can provide a good return : risk ratio (greater than 3:1). This is very important to foster sustainable equity growth over time .
In order to do that, it helps identify new positions of previously successful support and resistance levels , out of both its multi time-frame mathematical approach, and empirical evidence. By mapping these, indicator provides a good way to anticipate next levels with high success probability, as well as to validate or invalidate expectations in relation to what price is more likely to do next.
Last, but not least, it also helps identify price state , in terms of trend and consolidation . Meaning that, if price is trending, we can expect it to go farther -- either higher or lower --, in a more consistent way. Or, if it is consolidating, we can expect it to remain trading inside a range.
Combined, these aspects help you develop an enhanced view of the market , and a better edge for your trades.
Feedbacks from beta phase
Before diving into more details, i'd like to let you know that, besides internal tests, the indicator has gone through a public beta testing phase , having received quite nice feedback from participants . You can find more information about it in the overview video, as mentioned above.
How it works?
As seen on chart below, indicator is composed of:
a Trend Band
two Expansion Threshold Bands and
Bar colors .
Let's get through each of these.
Trend Band
The Trend Band is the one which runs around the middle of the indicator, and helps you assess if you should be leaning bullish or bearish, locally -- considering the time frame you are looking at. Its inflection points , also known as death crosses and golden crosses, are important events to anticipate -- and pay attention to when they happen. There's also a middle line , which helps you evaluate if price is leaning towards crossing the band to the other side.
The following chart shows some examples* of how lines can help identify potential places to have new trades.
* More information about specific trading approaches is available through complementary materials.
So, Trend Band helps us adjust our bias towards a direction. But how far can we expect price to go?
To help answer this question, the indicator also provides two other bands. Let's talk about them, next.
Expansion Threshold Bands
The Expansion Threshold Bands are the ones usually surrounding price (not always, as you'll notice). They are called the Upper Expansion Threshold Band and the Lower Expansion Threshold Band . Their purpose is to help identify potential limits , or places where price is more likely to face a contrarian force , and will probably have to decide whether to continue in the same direction, or to pull back -- end eventually revert.
On the following chart we have an example (Bitcoin, 15 minutes time-frame). It was retracing locally, but once it hit the corresponding Lower Expansion Threshold, it found strong support, making it pull back, and look to test upper structures, next . In fact, as can be seen, this support was tested and respected three times on this chart. Conversely, the Upper Expansion Threshold Band, resistance, was tested and broken twice -- an effect, and validation, of the overall uptrend Bitcoin was in.
Broken Expansion Threshold Bands
Indicator also helps adjust expectations when price breaks an Expansion Threshold . As an example, on the following chart, we see Bitcoin breaking the 15 mins lower band, after having respected it multiple times during the rise. The result was a significant correction.
So, when price breaks an Expansion Threshold Band of a particular time-frame, we can expect it to expand in that same direction for a while. In other words, we can expect it to trend in that direction, until it finds a larger time-frame Expansion Threshold which can hold it.
To help with this aspect, here enters indicator's distinctive multiple time-frame overlays functionality .
Multiple time-frame overlays
Multiple time-frames is a very important aspect to understand and consider when dealing with an asset's price, as different size traders make decisions based on each of them -- and, naturally, this requires us to deal with the combined results of all such decisions.
On the chart below, (again, Bitcoin 15 minutes time-frame), standard indicator deployment is showing where supports are for some of the lows. But there are moments when price stop "mid-air". Why is it so?
Well, this happens due to the influence of another time-frame structure (in this case, a smaller one). To identify which structures are working, it is possible to apply the indicator one or more times to the chart, and perform an empirical research . In this case, bounces were caused by the 10 minute lower threshold band, approximately.
This feature allows you to see, on a single chart, multiple time-frame structures working at once -- which, besides bringing greater clearness, can also help you save time, by skipping the handling of multiple charts.
Note : TradingView recommends using a lower time-frame chart and deploying a higher time-frame overlay. However, within a good margin, the reverse practice has proven itself to work for Price Finder, as indicator's approach is evidence-based. So, whichever smaller time-frame overlay which shows itself as working, even though on a higher time-frame chart, should continue to do so, as calculations remain proportional.
Another example below, now showing 5 minutes working as support multiple times too (besides 10 and 15).
So, by researching which supports and resistances are being repeatedly respected, out of price's multi time-frame / multi layered reality, and finding their current price levels -- both through the means of the indicator --, it is possible to anticipate high probability places for successful trades -- either in favor of the structure, if you believe in a stop-and-reverse move, or against it, if structure gets broken and allows price to start expanding / trending. Always based on both a mathematical foundation, and an empirical observation (evidence / confirmation).
Bar colors
As an additional information to help you understand if price is trending (or starting to develop trend intentions), or if it is consolidating , the indicator provides bar color schemes.
By default, it uses dark green and dark red colors for initial developments of bullish and bearish trends , bright green and bright red colors for developed, stronger trends , and orange for consolidations . Knowing such states help you build more confidence in the movement -- or not.
Color-blind friendly setting
Colors-wise, indicator also offers the possibility to use a second scheme, more friendly to color-blind users. You can change color scheme on settings panel.
Other settings
There are other ways to customize the presentation of the indicator , especially regarding multiple time-frame overlays , as we saw, but also to help you manage and reduce chart clutter , for example, in terms of number of lines being plotted.
It's possible to decide to just plot backgrounds, or some part of the structure, or avoid painting bars, etc.
Sample chart settings, explained
What you see on the chart above:
3 deployments of Price Finder, one for each of the following time frames: 1 hour ('Chart' time-frame), 15 and 4 minutes.
Custom settings:
1 hour: Upper and lower expansion threshold bands plotted in full. Trend band hidden;
15 minutes: Trend band hidden, expansion thresholds with just backgrounds (for better visibility);
4 minutes: likewise.
Price Finder working with other assets
Here are some other examples of the indicator, now working with other assets.
Time-frames used to 'calibrate' readings were observed from previous evidence on the same charts.
Ethereum / US Dollar, 4 hour chart, with 100, 50 and 25 minutes overlays.
S&P 500, 1 hour chart, with 30, 15 and 5 minutes overlays.
Dow Jones Industrial Average, also 1 hour chart, with 4 hours, 15 and 5 minutes overlays.
Gold / US Dollar, 1D chart, with 600 minutes, 4 hours, 140 and 80 minutes overlays.
Euro / US Dollar, 4 days chart, with 1 day, 700 minutes and 4 hours overlays.
Availability and more information
For indicator availability, access instructions, and/or additional information, please use the corresponding link in the external links section below.
Thank you very much for your attention!
Cheers!
PHInkTrade

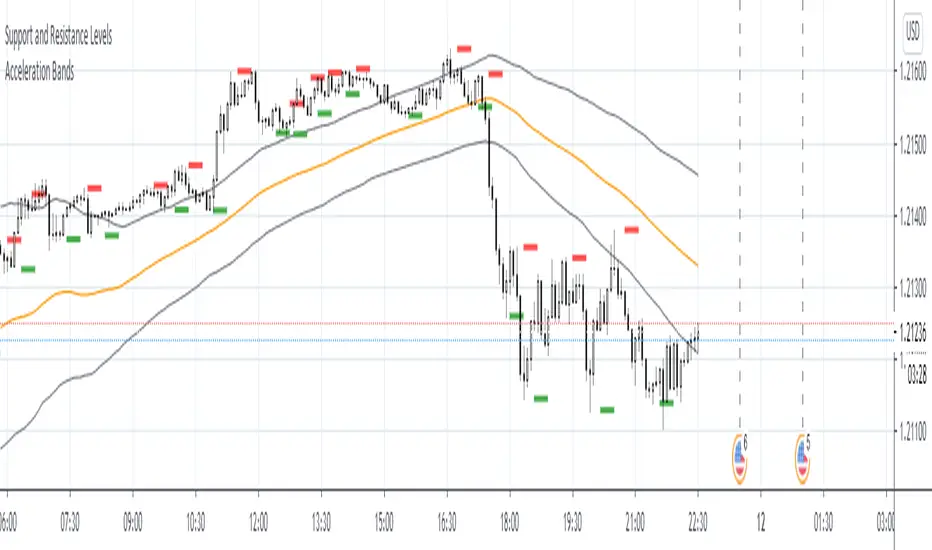
Acceleration BandsAcceleration Bands
Description:
Acceleration Bands serve as a trading envelope that factor in an assets typical volatility over standard settings of 20 or 80 bars. They can be used across any time period, though traders prefer to use them most across weekly and monthly timeframes as breakout indicators outside these bands.
Using the shorter time frames can define likely support and resistance levels at the lower and upper Acceleration Bands.
Entry is usually made at the breakout point. Once the price closes back within the Acceleration Bands, this is taken as a signal that the acceleration period is over and it’s best to close out the trade.
ATR BandsIt has happened to everybody. You enter the market, the position gets a stop loss, then later the market goes in the direction you originally planned. Worse yet - you enter a position, the market goes in your favor, gets near the target, and then it reverses and you get stopped.
We brazilians call this a "violinado", or getting violinated. It happens either because:
1. You put the stop loss too close, or the target too far
2. You entered in the right direction, but at a wrong time
While the second point cannot be programmly adressed, the first can. One popular way of setting a stop loss is by using the average of the true range, it even has a built-in indicator in TV. The problem with it is that you can still get violinated, since as the trend develops, the stop loss only goes up, never down. So if you enter at the wrong time, one slip can still take you out of the market.
Since I got sick of losing money using a conventional stop loss, I made these ATR bands. When you add this indicator to your graph, 6 lines are going to show up, 3 above the price, 3 below it. These lines are calculated from the ATR of the last 20 periods (can be configurated). The upper lines are the high of the last candle + the ATR * the multiplicator factor, the lower lines are the low - ATR * multiplicator factor. There are three multiplicator factors: 1.0, 1.618 and 2.0, and you change them to be whatever you want.
The logic behind it is that theses bands represents the region in which the market is more likely to stay. So if you enter the market at 50.00, you can't expect it to reach 500.00 in the next hour if the ATR is 5.00. And if you set the stop loss at 49.99, it is very likely that the market is going to stop you. By using the ATR bands, you can get a more reasonable price range, so you would set the stop loss at 45.00 and the take profit level at 60.00.
There are two types os ATR you can use: the regular, calculated with RMA, and another using a custom WMA, which puts greater emphasis on large amplitudes. By default, the average uses the past 20 true ranges. You can also choose to use either the closing price or the extremes of the candle as a basis.
Another thing I've added is the violation statistics, which shows the percentages of the times that a band was violated in the next 5 candles (can be configurated). With this, you can get a broader view on the probability of the bands actually being reached.
You may have notice that the bands are lagged by 1 period. I did this so that there is no way you can use future data. You can disable it or increase it, but I recommend just letting it be 1. These bands are the range in which the price is most likely to stay in, if you change the lag you are essentially breaking it's whole purpose.

Exponential Deviation Bands Width [ChuckBanger]This indicator is a compliment to Exponential Deviation Bands . It is the difference between the upper and the lower bands divided by the middle band. It is an easy way to visualize consolidation before price movements or periods of higher volatility.
How it works
During a period of high volatility, the distance between the two bands will widen and Exponential Deviation Bands width will increase. And the opposite occurs during a period of low volatility, the distance between the two bands will contract and Exponential Deviation Bands width will decrease. Meaning there is a tendency for bands to alternate between expansion and contraction.
When the bands are relatively far apart, that is often is a sign that the current trend is ending. When the distance between the two bands is relatively narrow that often is a sign that the market is about to initiate a bigger move in either direction.

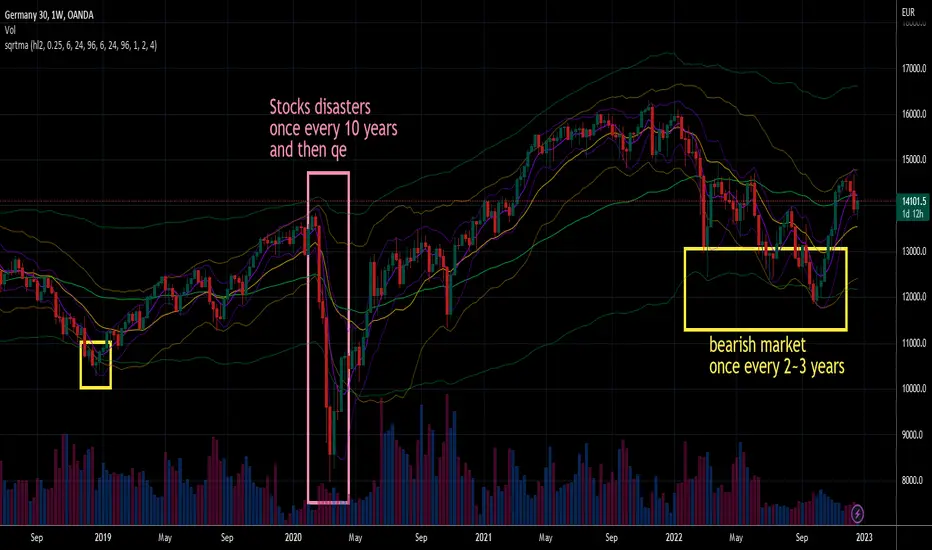
Square Root Moving AverageAbstract
This script computes moving averages which the weighting of the recent quarter takes up about a half weight.
This script also provides their upper bands and lower bands.
You can apply moving average or band strategies with this script.
Introduction
Moving average is a popular indicator which can eliminate market noise and observe trend.
There are several moving average related strategies used by many traders.
The first one is trade when the price is far from moving average.
To measure if the price is far from moving average, traders may need a lower band and an upper band.
Bollinger bands use standard derivation and Keltner channels use average true range.
In up trend, moving average and lower band can be support.
In ranging market, lower band can be support and upper band can be resistance.
In down trend, moving average and upper band can be resistance.
An another group of moving average strategy is comparing short term moving average and long term moving average.
Moving average cross, Awesome oscillators and MACD belong to this group.
The period and weightings of moving averages are also topics.
Period, as known as length, means how many days are computed by moving averages.
Weighting means how much weight the price of a day takes up in moving averages.
For simple moving averages, the weightings of each day are equal.
For most of non-simple moving averages, the weightings of more recent days are higher than the weightings of less recent days.
Many trading courses say the concept of trading strategies is more important than the settings of moving averages.
However, we can observe some characteristics of price movement to design the weightings of moving averages and make them more meaningful.
In this research, we use the observation that when there are no significant events, when the time frame becomes 4 times, the average true range becomes about 2 times.
For example, the average true range in 4-hour chart is about 2 times of the average true range in 1-hour chart; the average true range in 1-hour chart is about 2 times of the average true range in 15-minute chart.
Therefore, the goal of design is making the weighting of the most recent quarter is close to the weighting of the rest recent three quarters.
For example, for the 24-day moving average, the weighting of the most recent 6 days is close to the weighting of the rest 18 days.
Computing the weighting
The formula of moving average is
sum ( price of day n * weighting of day n ) / sum ( weighting of day n )
Day 1 is the most recent day and day k+1 is the day before day k.
For more convenient explanation, we don't expect sum ( weighting of day n ) is equal to 1.
To make the weighting of the most recent quarter is close to the weighting of the rest recent three quarters, we have
sum ( weighting of day 4n ) = 2 * sum ( weighting of day n )
If when weighting of day 1 is 1, we have
sum ( weighting of day n ) = sqrt ( n )
weighting of day n = sqrt ( n ) - sqrt ( n-1 )
weighting of day 2 ≒ 1.414 - 1.000 = 0.414
weighting of day 3 ≒ 1.732 - 1.414 = 0.318
weighting of day 4 ≒ 2.000 - 1.732 = 0.268
If we follow this formula, the weighting of day 1 is too strong and the moving average may be not stable.
To reduce the weighting of day 1 and keep the spirit of the formula, we can add a parameter (we call it as x_1w2b).
The formula becomes
weighting of day n = sqrt ( n+x_1w2b ) - sqrt ( n-1+x_1w2b )
if x_1w2b is 0.25, then we have
weighting of day 1 = sqrt(1.25) - sqrt(0.25) ≒ 1.1 - 0.5 = 0.6
weighting of day 2 = sqrt(2.25) - sqrt(1.25) ≒ 1.5 - 1.1 = 0.4
weighting of day 3 = sqrt(3.25) - sqrt(2.25) ≒ 1.8 - 1.5 = 0.3
weighting of day 4 = sqrt(4.25) - sqrt(3.25) ≒ 2.06 - 1.8 = 0.26
weighting of day 5 = sqrt(5.25) - sqrt(4.25) ≒ 2.3 - 2.06 = 0.24
weighting of day 6 = sqrt(6.25) - sqrt(5.25) ≒ 2.5 - 2.3 = 0.2
weighting of day 7 = sqrt(7.25) - sqrt(6.25) ≒ 2.7 - 2.5 = 0.2
What you see and can adjust in this script
This script plots three moving averages described above.
The short term one is default magenta, 6 days and 1 atr.
The middle term one is default yellow, 24 days and 2 atr.
The long term one is default green, 96 days and 4 atr.
I arrange the short term 6 days to make it close to sma(5).
The other twos are arranged according to 4x length and 2x atr.
There are 9 curves plotted by this script. I made the lower bands and the upper bands less clear than moving averages so it is less possible misrecognizing lower or upper bands as moving averages.
x_src : how to compute the reference price of a day, using 1 to 4 of open, high, low and close.
len : how many days are computed by moving averages
atr : how many days are computed by average true range
multi : the distance from the moving average to the lower band and the distance from the moving average to the lower band are equal to multi * average true range.
x_1w2b : adjust this number to avoid the weighting of day 1 from being too strong.
Conclusion
There are moving averages which the weighting of the most recent quarter is close to the weighting of the rest recent three quarters.
We can apply strategies based on moving averages. Like most of indicators, oversold does not always means it is an opportunity to buy.
If the short term lower band is close to the middle term moving average or the middle term lower band is close to the long term moving average, it may be potential support value.
References
Computing FIR Filters Using Arrays
How to trade with moving averages : the eight trading signals concluded by Granville
How to trade with Bollinger bands
How to trade with double Bollinger bands
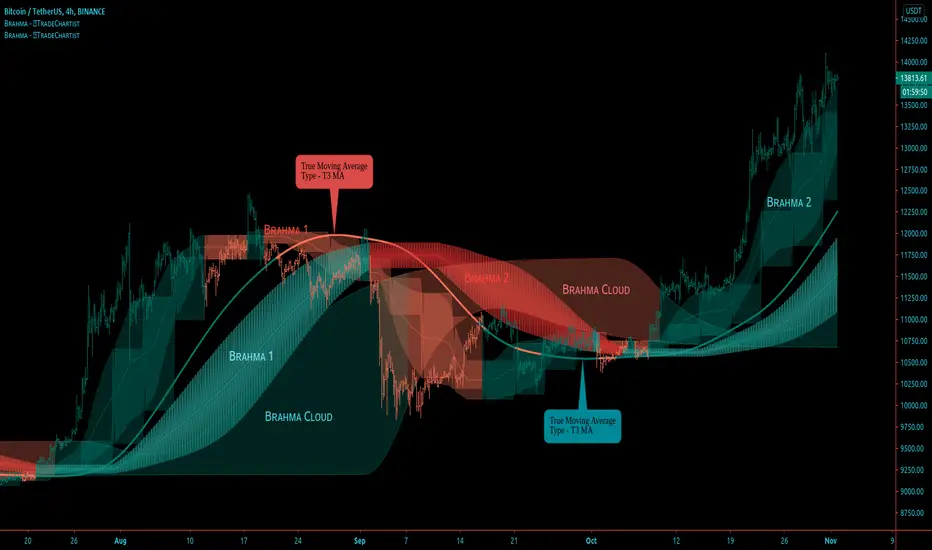
BRAHMA - Better Remodelled Adaptive Holistic Moving Average™𝗧𝗿𝗮𝗱𝗲𝗖𝗵𝗮𝗿𝘁𝗶𝘀𝘁 𝗕𝗥𝗔𝗛𝗠𝗔 (Better Remodelled Adaptive Holistic Moving Average) is an exceptionally versatile Moving Average, that can adapt, expand and transform into a better Moving Average system that consists of BRAHMA bands and BRAHMA steps, both emanating from a singular plot based on the source price and the lookback length. The system also consists of BRAHMA cloud which is based on the source price, the lookback length, the step length and the cloud factor. In addition to using the source price directly, the indicator offers 15 different Moving Average types that can be used on the source price for BRAHMA system to adapt to, offering several possibilities to visualize and trade the price action.
===================================================================================================================
™𝗧𝗿𝗮𝗱𝗲𝗖𝗵𝗮𝗿𝘁𝗶𝘀𝘁 𝗕𝗥𝗔𝗛𝗠𝗔 𝗨𝘀𝗲𝗿 𝗠𝗮𝗻𝘂𝗮𝗹
=====================================
Like any other moving average system, the source price and the lookback length determines the dynamic of BRAHMA . Source price can be selected from Sᴏᴜʀᴄᴇ dropdown and the lookback length can be enetered in the Bʀᴀʜᴍᴀ Lᴇɴɢᴛʜ input box. MA ᴛʏᴘᴇ dropdown is used to choose the type of moving average for BRAHMA to adapt to. To use the source price directly, Use Source must be selected from the dropdown.
In addition to this usual requirement, Bʀᴀʜᴍᴀ Wɪᴅᴛʜ and Bʀᴀʜᴍᴀ Sᴛᴇᴘ Lᴇɴɢᴛʜ are required to make BRAHMA moving average system complete, based on risk and reward expectations of the user.
===================================================================================================================
BRAHMA Bands and Steps
The Bands and the Steps are integral part of the BRAHMA system. When the Bʀᴀʜᴍᴀ Wɪᴅᴛʜ and Bʀᴀʜᴍᴀ Sᴛᴇᴘ Lᴇɴɢᴛʜ values are 1, the bands and steps lie dormant inside BRAHMA and they emanate from the main plot as the values are increased.
Bʀᴀʜᴍᴀ Wɪᴅᴛʜ impacts the Bands Mean line + expands or contracts the bands and Bʀᴀʜᴍᴀ Sᴛᴇᴘ Lᴇɴɢᴛʜ transforms the dormant step system (on minimum value of 1) from inside the BRAHMA bands into a powerful step/block like structure that helps find support/resistance levels and displays Bull and Bear zones based on price action in relation to the BRAHMA bands and BRAHMA steps .
Dɪsᴘʟᴀʏ Bʀᴀʜᴍᴀ Sᴛᴇᴘs plots the steps
Dɪsᴘʟᴀʏ Bʀᴀʜᴍᴀ Bᴀɴᴅs plots the bands
Enabling Cᴏʟᴏᴜʀ Bᴀʀs with Bands and Steps displayed will plot the Bull and Bear Zones on price bars and this dynamic is very different from the colouring of the bars based on the cloud as a standalone plot.
===================================================================================================================
BRAHMA Cloud
The cloud is a very useful part of this system and helps see the price action with the help of volatility of Bulls/Bears based on the lookback length, step length and the cloud factor. Price above or below the cloud helps visualize the strength of the trend along with the height/thickness of the cloud. Thinning of the cloud can signal reversals and can be used with another confirmator.
Cʟᴏᴜᴅ Fᴀᴄᴛᴏʀ (1 - 10) affects the cloud dynamic and can be changed to suit personal risk strategy and trade frequency. Cloud sensitivity is also affected by the Bʀᴀʜᴍᴀ Lᴇɴɢᴛʜ . Cloud can be used on its own with really low lookback length (even length of 1 works well).
Dɪsᴘʟᴀʏ Bʀᴀʜᴍᴀ Cʟᴏᴜᴅ plots the cloud
Enabling Bʀᴀʜᴍᴀ Cᴏʟᴏᴜʀ Bᴀʀs with Cloud displayed as the only standalone component of the indicator will plot the Bull and Bear Zones and this dynamic is very different from the colouring of the bars based on the Bands and Steps on chart. When the price enters the cloud from below after or during a period of downtrend will start painting Bull colour and when the price enters the cloud from above after or during a period of uptrend will start painting Bear colour on the price bars.
===================================================================================================================
BRAHMA Colour Scheme
The colours of the plots and fills can be changed based on user preference from the indicator settings.
There are three Themes to choose from Bʀᴀʜᴍᴀ Cᴏʟᴏᴜʀ Bᴀʀs Tʜᴇᴍᴇ (Simple, Chilli and Flame) dropdown to colour the price bars.
Enabling Bʀᴀʜᴍᴀ Cᴏʟᴏᴜʀ Bᴀʀs with Simple Theme colours the price bars based on Bull and Bear zones as explained in the sections above. Chilli and Flame themes colour the price bars with trend intensity for every bar based on the source price and lookback length.
===================================================================================================================
Alerts
Alerts can be created for Long and Short entries by using Once Per Bar Close as Alert Frequency. Entries are generated on Real time bars. It is recommended to wait for bar close before taking a position based on Trade Entries.
The indicator does not repaint and can be confidently used for alerts and trade entries without worrying about signals disappearing.
™TradeChartist BRAHMA can also be connected to ™TradeChartist Plug and Trade using 𝗕𝗥𝗔𝗛𝗠𝗔 𝗧𝗿𝗲𝗻𝗱 𝗜𝗱𝗲𝗻𝘁𝗶𝗳𝗶𝗲𝗿 as Oscillatory Signal to generate entries along with Targets, Stop Loss plots etc. Target and Stop Loss alerts can be created using Plug and Trade's Alerts system.
===================================================================================================================
Example Charts
1. The 15m chart below demonstrates how a Simple Moving Average can be transformed from a noisy pretty much untradeable MA plot to meaningful Moving Average Trade System using BRAHMA by adjusting the Width and the Step Length.
2. GBP-USD 1hr chart using 34 period Zero-Lag EMA with 21 width and 24 step length (24 hrs in a Daily candle - This helps choose length for HTF based levels)
3. NIFTY 1hr chart using 21 period TEMA (Triple Exponential MA) with 21 width and 24 step length.
4. XAU-USD Daily chart using 89 period TEMA with 24 width and 12 step length, enabling Chilli Theme based colour bars.
5. LINK-USDT 1hr chart using 21 period Hull MA with 24 width, 24 step length and cloud factor of 2 visualised using colour bars on cloud as standalone plot.
===================================================================================================================
Best Practice: Test with different settings first using Paper Trades before trading with real money
===================================================================================================================
This is not a free to use indicator. Get in touch with me (PM me directly if you would like trial access to test the indicator)
Premium Scripts - Trial access and Information
Trial access offered on all Premium scripts.
PM me directly to request trial access to the scripts or for more information.
===================================================================================================================
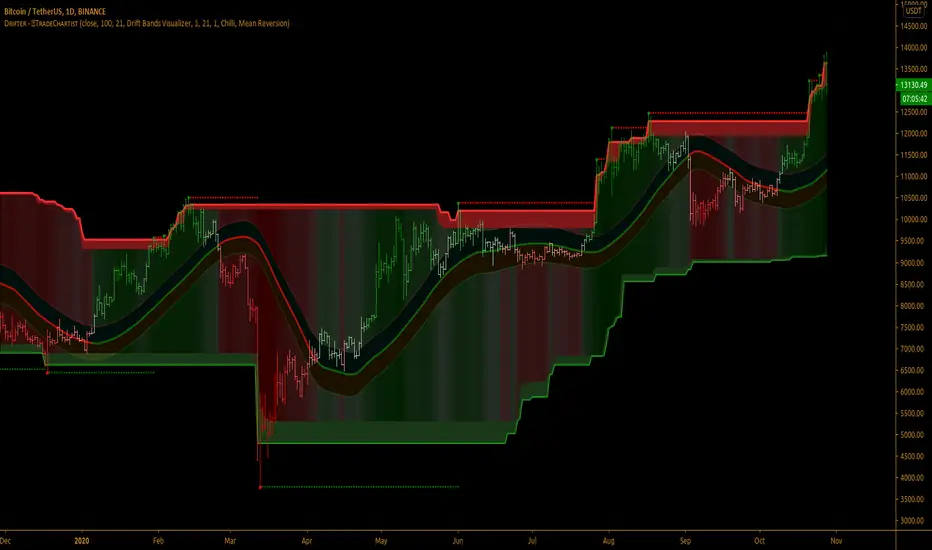
TradeChartist Drifter™𝗧𝗿𝗮𝗱𝗲𝗖𝗵𝗮𝗿𝘁𝗶𝘀𝘁 𝗗𝗿𝗶𝗳𝘁𝗲𝗿 is an adeptly designed, functional and a visual indicator that plots trend-following Support and Resistance walls by employing the concepts of Trend-based Support and Resistance, Momentum and Volatility, based on user defined lookback length, and includes three extremely useful Visualizers - Drift Bands Visualizer , Drift Strength Visualizer and Drifter AutoFibs Visualizer to help visualize the Price action in relation to the Support and Resistance Walls.
===================================================================================================================
™𝗧𝗿𝗮𝗱𝗲𝗖𝗵𝗮𝗿𝘁𝗶𝘀𝘁 𝗗𝗿𝗶𝗳𝘁𝗲𝗿 𝗨𝘀𝗲𝗿 𝗠𝗮𝗻𝘂𝗮𝗹
===================================
Concept of Drift
™TradeChartist Drifter combines concepts of Trend-based Support and Resistance, Momentum and Volatility to plot continuous Drifter Support and Resistance Walls that encloses the price action ( Drift ) within it (If the source price is price candle/bar based price like open,close,high,low,hl2,hl3 or ohlc4). In fact, these walls are generated by the price action ( Drift ) itself and helps the user see the price trend clearly as price makes higher highs/lows and lower highs/lows.
The Drifter walls are based on the user defined lookback length which can be changed in the Lᴇɴɢᴛʜ ғᴏʀ Dʀɪғᴛᴇʀ Wᴀʟʟs input box.
Drifter walls can be viewed or hidden by enabling or disabling 𝐒𝐡𝐨𝐰 𝐃𝐫𝐢𝐟𝐭𝐞𝐫 𝐖𝐚𝐥𝐥𝐬 .
Price Highs and Lows breaching the Drifter Walls can be viewed or hidden by enabling or disabling Sʜᴏᴡ Dʀɪғᴛᴇʀ Hɪɢʜs ᴀɴᴅ Lᴏᴡs .
Understanding and Visualizing ( Drift ) is important as it helps traders see the price action clearly. Price Volatility, Trend and Momentum are dependent on the period they are analysed. In order to visualize the drift, the user must enter the number of bars lookback in the Dʀɪғᴛ Lᴏᴏᴋʙᴀᴄᴋ input box.
===================================================================================================================
Three Types of Visualizers
One of the three types of Visualizers can be selected from Vɪsᴜᴀʟɪᴢᴇʀ Tʏᴘᴇ dropdown.
Drifter AutoFibs Visualizer is dependent on the Lᴇɴɢᴛʜ ғᴏʀ Dʀɪғᴛᴇʀ Wᴀʟʟs only as it fills the Drifter with Automatic Fibonacci Levels based on the distance between the Drifter Walls.
Drift Strength Visualizer is dependent on the Dʀɪғᴛ Lᴏᴏᴋʙᴀᴄᴋ only as it detects the Drift Strength based on Drift length. This Visualizer detects the Bull and the Bear zones based on the lookback. This helps visualize the Trend and Momentum clearly as the zones are filled with user selected theme based Bull and Bear colours.
Drift Bands Visualizer plots Drift Bands based on either Average True Range (ATR) or Standard Deviation along with the Bull or Bear Trend clearly shown using the color of the Mean or Basis line of the Drift Bands.
===================================================================================================================
╔═════════ 𝗗𝗿𝗶𝗳𝘁 𝗕𝗮𝗻𝗱𝘀 ══════════╗
Drift Bands are based on either ATR or Standard Deviation and consists of an Upper Band, a Lower Bands and a Mean or Basis Line. Drift Bands are extremely effective and highly useful in spotting the trend as the breakout from the upper or the lower band signals a change in the Drift based on the Dʀɪғᴛ Lᴏᴏᴋʙᴀᴄᴋ .
Note: The Mean or the Basis line of the Drift Bands depends only on the Dʀɪғᴛ Lᴏᴏᴋʙᴀᴄᴋ and Sᴏᴜʀᴄᴇ price. To plot Drift Bands based on external source, enable Usᴇ Sᴏᴜʀᴄᴇ Pʀɪᴄᴇ . The Width of the Bands is affected by ATR or Standard Deviation, based on the user preference.
ATR based Drift Bands
To plot ATR based Drift bands, enable 𝐀𝐓𝐑 𝐁𝐚𝐧𝐝𝐬 - Uɴᴄʜᴇᴄᴋ ғᴏʀ Sᴛᴀɴᴅᴀʀᴅ Dᴇᴠɪᴀᴛɪᴏɴ . ATR period is automatic. The ATR factor or the ATR multiplier can be changed in ATR Mᴜʟᴛɪᴘʟɪᴇʀ (ғᴏʀ ᴀᴛʀ ʙᴀsᴇᴅ ʙᴀɴᴅs (Default - 1, Min - 0.5, Max - 3). Higher ATR multiplier increases the width of the Drift Bands.
Note: In most cases, higher ATR multiplier of 2 or 3 increases Risk, but also results in increased Gains.
Standard Deviation based Drift Bands
To plot Standard Deviation bases Drift Bands, disable 𝐀𝐓𝐑 𝐁𝐚𝐧𝐝𝐬 - Uɴᴄʜᴇᴄᴋ ғᴏʀ Sᴛᴀɴᴅᴀʀᴅ Dᴇᴠɪᴀᴛɪᴏɴ . Both Sᴛᴀɴᴅᴀʀᴅ Dᴇᴠɪᴀᴛɪᴏɴ Lᴇɴɢᴛʜ (Default - 55, Min - 13) and Sᴛᴀɴᴅᴀʀᴅ Dᴇᴠɪᴀᴛɪᴏɴ Mᴜʟᴛɪᴘʟɪᴇʀ (Default - 1, Min - 0.236, Max - 2) affect the width of the Bands. Higher Standard Deviation Multiplier increases the Volatility of the Drift Bands.
Note: In most cases, higher Standard Deviation multiplier increases Risk, but also results in increased Gains.
Tip : To plot Bull and Bear Drift Zones, enable 𝐃𝐫𝐢𝐟𝐭 𝐙𝐨𝐧𝐞𝐬 𝐁𝐚𝐜𝐤𝐠𝐫𝐨𝐮𝐧𝐝 𝐅𝐢𝐥𝐥 and this can be used as Trade zones as this will be in sync with the trend colour of Mean line of the Drift Bands.
===================================================================================================================
╔═══════ 𝗗𝗿𝗶𝗳𝘁𝗲𝗿 𝗔𝗲𝘀𝘁𝗵𝗲𝘁𝗶𝗰𝘀 ═══════╗
There are two themes (Chilli and Flame) to choose from for the colour schemes of Drifter under 𝗗𝗿𝗶𝗳𝘁𝗲𝗿 𝗧𝗵𝗲𝗺𝗲 dropdown.
Dʀɪғᴛᴇʀ Bᴀᴄᴋɢʀᴏᴜɴᴅ Fɪʟʟ plots Bull and Bear strength based background fill between the Drifter walls. This is disabled for Drifter AutoFibs Visualizer .
There are two types of background fills namely, Mean Reversion and Trend Following and can be selected from Bᴀᴄᴋɢʀᴏᴜɴᴅ Fɪʟʟ Tʏᴘᴇ dropdown.
Enabling Dʀɪғᴛᴇʀ Cᴏʟᴏᴜʀ Bᴀʀs paints the price bars with the Drifter background fill.
Note: Trend Following fill is dependent on Dʀɪғᴛ Lᴏᴏᴋʙᴀᴄᴋ .
===================================================================================================================
Alerts
Alerts can be created for Long and Short entries by using Once Per Bar Close as Alert Frequency. Entries are generated on Real time bars based on Drift Bands Breakout conditions. It is recommended to wait for bar close before taking a position based on Drift Bands Trade Entries.
The indicator does not repaint and can be confidently used for alerts and trade entries without worrying about signals disappearing.
™TradeChartist Drifter can also be connected to ™TradeChartist Plug and Trade using 𝗗𝗿𝗶𝗳𝘁𝗲𝗿 𝗧𝗿𝗲𝗻𝗱 𝗜𝗱𝗲𝗻𝘁𝗶𝗳𝗶𝗲𝗿 as Oscillatory Signal to generate entries along with Targets, Stop Loss plots etc. Target and Stop Loss alerts can be created using Plug and Trade's Alerts system.
===================================================================================================================
There are several combinations of settings that can be tested on the security traded based on timeframe and risk/reward expectations. The indicator can be used for trade entries with various Drift Bands settings. Following are a few examples using the Drifter.
===================================================================================================================
Example Charts
1. SPX 1hr chart using Drifter AutoFibs Visualizer based on 100 period lookback for Drifter Walls.
2. SPX 1hr chart using Drift Strength Visualizer based on 100 period Drift Lookback.
3. SPX 1hr chart using 100 period ATR (Multiplier - 1) based Drift Bands Visualizer with Drift Zones Background Fill.
4. SPX 1hr chart using 50 period ATR (Multiplier - 1) based Drift Bands Visualizer with Drift Zones Background Fill.
5. SPX 1hr chart using 50 period Standard Deviation (Length - 21, Multiplier - 2) based Drift Bands Visualizer with Drift Zones Background Fill.
6. EUR-USD 1hr chart using 34 period ATR (Multiplier - 3) based Drift Bands Visualizer with Drift Zones Background Fill.
7. BTC-USD 5m chart using 34 period ATR (Multiplier - 3) based Drift Bands Visualizer connected to ™TradeChartist Intensity Equilibrium Line.
8. BTC-USD 5m chart using 34 period ATR (Multiplier - 3) based Drift Bands Visualizer connected to ™TradeChartist Intensity Equilibrium Line + Connected to ™TradeChartist Plug and Trade
===================================================================================================================
Best Practice: Test with different settings first using Paper Trades before trading with real money
===================================================================================================================
This is not a free to use indicator. Get in touch with me (PM me directly if you would like trial access to test the indicator)
Premium Scripts - Trial access and Information
Trial access offered on all Premium scripts.
PM me directly to request trial access to the scripts or for more information.
===================================================================================================================
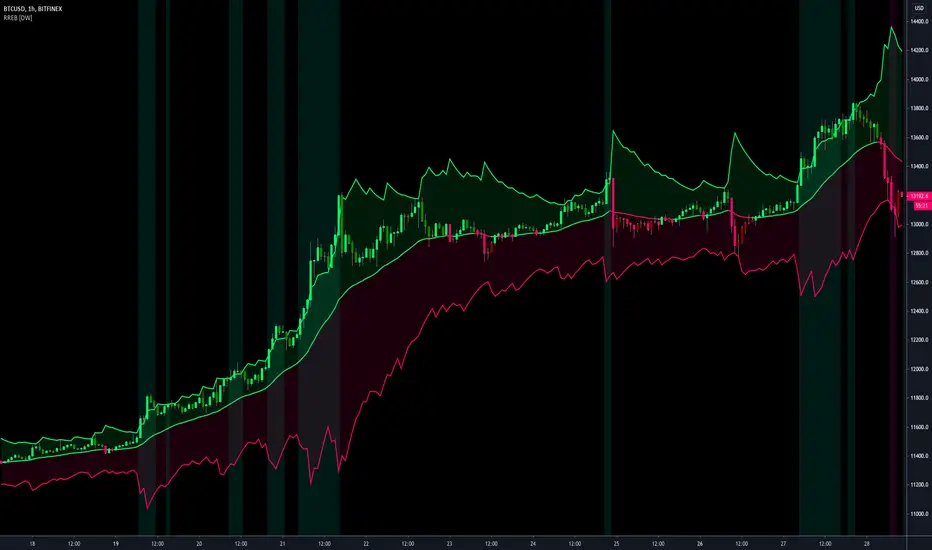
Resampling Reverse Engineering Bands [DW]This is an experimental study designed to reverse engineer price levels from centered oscillators at user defined sample rates.
This study aims to educate users on the process of oscillator reverse engineering, and to give users an alternative perspective on some of the most commonly used oscillators in the trading game.
Reverse engineering price levels from an oscillator is actually a rather simple, straightforward process.
Rather than plugging price values into a function to solve for oscillator values, we rearrange the function using some basic algebraic operations and plug in a specified oscillator value to solve for price values instead.
This process tells us what price value is needed in order for the oscillator to equal a certain value.
For example, if you wanted to know what price value would be considered “overbought” or “oversold” according to your oscillator, you can do that using this process.
In this study, the reverse engineering functions are used to calculate the price values of user defined high and low oscillator thresholds, and the price values for the oscillator center.
This allows you to visualize what prices will trigger thresholds as a sort of confidence interval, which is information that isn't inherently available when simply analyzing the oscillator directly.
This script is equipped with three reverse engineering functions to choose from for calculating the band values:
-> Reverse Relative Strength Index (RRSI)
-> Reverse Stochastic Oscillator (RStoch)
-> Reverse Commodity Channel Index (RCCI)
You can easily select the function you want to utilize from the "Band Calculation Type" dropdown tab.
These functions are specially designed to calculate at any sample rate (up to 1 bar per sample) utilizing the process of downsampling that I introduced in my Resampling Filter Pack.
The sample rate can be determined with any of these three methods:
-> BPS - Resamples based on the number of bars.
-> Interval - Resamples based on time in multiples of current charting timeframe.
-> PA - Resamples based on changes in price action by a specified size. The PA algorithm in this script is derived from my Range Filter algorithm.
The range for PA method can be sized in points, pips, ticks, % of price, ATR, average change, and absolute quantity.
Utilizing downsampled rates allows you to visualize the reverse engineered values of an oscillator calculated at larger sample scales.
This can be rather beneficial for trend analysis since lower sample rates completely remove certain levels of noise.
By default, the sample rate is set to 1 BPS, which is the same as bar-to-bar calculation. Feel free to experiment with the sample rate parameters and configure them how you like.
Custom bar colors are included as well. The color scheme is based on disparity between sources and the reverse engineered center level.
In addition, background highlights are included to indicate when price is outside the bands, thus indicating "overbought" and "oversold" conditions according to the thresholds you set.
I also included four external output variables for easy integration of signals with other scripts:
-> Trend Signals (Current Resolution Prices) - Outputs 1 for bullish and -1 for bearish based on disparity between current resolution source and the central level output.
-> Trend Signals (Resampled Prices) - Outputs 1 for bullish and -1 for bearish based on disparity between resampled source and the central level output.
-> Outside Band Signal (Current Resolution Prices) - Outputs 1 for overbought and -1 for oversold based on current resolution source being outside the bands. Returns 0 otherwise.
-> Outside Band Signal (Resampled Prices) - Outputs 1 for overbought and -1 for oversold based on resampled source being outside the bands. Returns 0 otherwise.
To use these signals with another script, simply select the corresponding external output you want to use from your script's source input dropdown tab.
Reverse engineering oscillators is a simple, yet powerful approach to incorporate into your momentum or trend analysis setup.
By incorporating projected price levels from oscillators into our analysis setups, we are able to gain valuable insights, make (potentially) smarter trading decisions, and visualize the oscillators we know and love in a totally different way.
I hope you all find this script useful and enjoyable!
Volume Bars and Regions of InterestThe bars are colored according to the volume traded. The volume weights were distributed logically for a better analysis.
<0.666 low volume
0.666 to 1.333 median volume
1,333 to 2,666 high volume
> 2,666 'institutional' volume
The moving average bands are the average of the highs and lows. They show a region of interest and not just a 'line'.

Ultimate VWAP Bands- Ultimate VWAP Bands is a script that helps to decide and further clarify areas of oversold and overbought conditions.
- For example, when the price is in the lowest band it is extremely oversold relative to the VWAP . Hence it should be considered a good place to buy with a high risk to reward payoff.
- Each band is set at a fixed offset away from the VWAP . The "VWAP Band Multiplier" adjusts this and is a key part of the script. This allows the indicator to be adjusted based on the assets volatility . For example, with Crypto. A multiplier of 1 would be strongly advised. Whilst a multiplier of 0.1-0.25 would be useful for currency pairs.
- This indicator can be used for all manners of trading. However, it is most effective when used for scalping and swing trading.

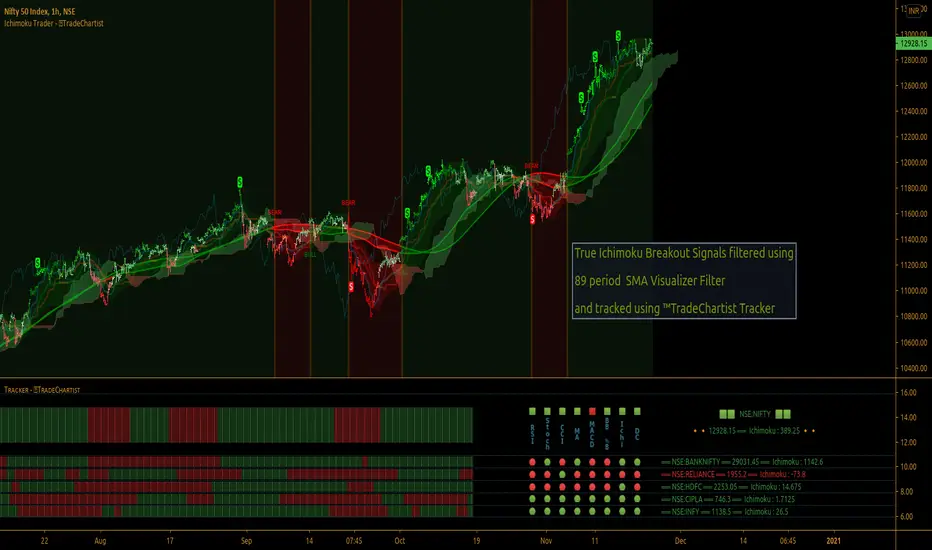
TradeChartist Ichimoku Trader ™TradeChartist Ichimoku Trader is an elegant and functional breakouts trading indicator that generates trade signals based on two types of breakouts - True Ichimoku Kumo Breakouts and Ichimoku Trade Bands Breakouts, which can be further filtered using ™TradeChartist MA Visualizer and/or using an external Filter.
===================================================================================================================
╔════════ 𝗖𝗹𝗼𝘂𝗱 𝗦𝗲𝘁𝘁𝗶𝗻𝗴𝘀 ═════════╗
Cloud Settings form the fundamental factor for this indicator to detect the breakouts. The settings for the Ichimoku Cloud is Automatic by default, but this can be changed based on the user preference from the settings under 𝐂𝐥𝐨𝐮𝐝 𝐓𝐲𝐩𝐞, which also includes a manual input option. Ichimoku traders can experiment different settings combinations under manual settings to suit their trading frequency and timeframe traded.
Ichimoku Cloud with its components can be displayed or hidden by enabling/disabling 𝐃𝐢𝐬𝐩𝐥𝐚𝐲 𝐈𝐜𝐡𝐢𝐦𝐨𝐤𝐮 𝐂𝐥𝐨𝐮𝐝. Also, Sʜᴏᴡ Iᴄʜɪᴍᴏᴋᴜ Cʀᴏssᴇs from the Cloud Settings plots tiny crosses on chart.
===================================================================================================================
╔═════════ 𝗕𝗮𝗻𝗱𝘀 𝗦𝗲𝘁𝘁𝗶𝗻𝗴𝘀 ════════╗
Even though the Ichimoku Trade Bands are derived from the Cloud Parameters, the Bᴀɴᴅ Wɪᴅᴛʜ (0.236 - 1) and Lᴏᴏᴋʙᴀᴄᴋ (5 - 200) influences the sensitivity and the width of the bands, which has an effect on the risk and reward expected from Ichimoku Trade Bands Breakout trade.
Trade Bands can be displayed or hidden by enabling/disabling 𝐃𝐢𝐬𝐩𝐥𝐚𝐲 𝐈𝐜𝐡𝐢𝐦𝐨𝐤𝐮 𝐓𝐫𝐚𝐝𝐞 𝐁𝐚𝐧𝐝𝐬. Also, the Bands mean line can be enabled or disabled using 𝐃𝐢𝐬𝐩𝐥𝐚𝐲 𝐓𝐫𝐚𝐝𝐞 𝐁𝐚𝐧𝐝𝐬 𝐌𝐞𝐚𝐧 𝐋𝐢𝐧𝐞 check box and its line width can be changed using Tʀᴀᴅᴇ Bᴀɴᴅs Mᴇᴀɴ Lɪɴᴇ Wɪᴅᴛʜ dropdown.
===================================================================================================================
╔═════════ 𝗠𝗔 𝗩𝗶𝘀𝘂𝗮𝗹𝗶𝘇𝗲𝗿 ═════════╗
MA Visualizer is a powerful and very useful original ™TradeChartist visual method to plot Moving Averages of the close price of the security for user specified look back period in a visually appealing style in the form of colour coded bands. MA Visualizer not only helps the trader spot the price action of the security relative to the moving average, but also paints a visual picture of the trend strength, which must be seen and used on chart to appreciate its elegance. One of 15 different types of Moving Averages can be used to visualize the price action.
Activate 𝗠𝗔 𝗩𝗶𝘀𝘂𝗮𝗹𝗶𝘇𝗲𝗿 and choose the MA type from MA Vɪsᴜᴀʟɪᴢᴇʀ Tʏᴘᴇ dropdown and entering the lookback period in MA Vɪsᴜᴀʟɪᴢᴇʀ ᴘᴇʀɪᴏᴅ input box. MA Visualizer colour theme can be be changed from MA Vɪsᴜᴀʟɪᴢᴇʀ Cᴏʟᴏʀ Sᴄʜᴇᴍᴇ dropdown.
The faster of the two set of bands that form the MA Visualizer reacts to price action faster and can be clearly seen from its change of colour from Bull Colour to Bear Colour or viceversa earlier than the slower set of bands. The fill colour between the bands also helps the user stay in a trade or exit a trade based on other confirmators.
===================================================================================================================
╔═══════ 𝗦𝗶𝗴𝗻𝗮𝗹𝘀 𝗮𝗻𝗱 𝗙𝗶𝗹𝘁𝗲𝗿𝘀 ═══════╗
Signal Type
True Ichimoku Kumo Breakout
Ichimoku traders mostly use the Kumo breakouts for trading based on several Bullish and Bearish conditions. For the sake of effective trade entries, trade entry plots for specific cloud events like Kumo twists, Tenkan Sen crossing Kijun Sen, price crossing cloud components etc have been intentionally ignored as Ichimoku traders often tend to visually trade them effectively.
Ichimoku Trade Bands Breakout
In addition to the True Kumo Breakouts, users of this script will be able to trade Ichimoku Trade Bands Breakouts. Ichimoku Trade Bands is an original ™TradeChartist model designed to detect early trend changes based on the Ichimoku settings. These bands are comprised of three plots - an upper band, a lower band and a mean line, namely and all are derived from the Ichimoku settings. The bands act as a filter and a breakout from bands' extreme boundaries signals a change in trend. The settings of the bands can be derived automatically or using manual input based on Ichimoku Cloud parameters, accessed from the indicator settings.
The Breakout Trade Entries can be further filtered by use of MA Visualizer or by using an external filter connected to the script.
===================================================================================================================
╔═════════ 𝗙𝗶𝗹𝘁𝗲𝗿 𝗦𝗲𝘁𝘁𝗶𝗻𝗴𝘀 ═════════╗
Filters are normally used to reduce noise in the Trade Entry Signals and they can be quite effective in helping the trader stay in trade and to minimize unproductive trade entries. Ichimoku Trader enables the user to use upto two trade filters - MA Visualizer and /or External Filter respectively.
Moving Averages are very effective trade filters and if the right Moving Average is used with right lookback period based on trade type and timeframe traded, they can be very effective in filtering trades.
Enabling 𝐔𝐬𝐞 𝐌𝐀 𝐕𝐢𝐬𝐮𝐚𝐥𝐢𝐳𝐞𝐫 𝐚𝐬 𝐓𝐫𝐚𝐝𝐞 𝐅𝐢𝐥𝐭𝐞𝐫 filters breakouts only when MA Visualizer agrees with the trend (which can be visualized using the fill colour between the MA Visualizer plots.
Enabling Fɪʟᴛᴇʀ Eᴀʀʟʏ Vɪsᴜᴀʟɪᴢᴇʀ Bʀᴇᴀᴋᴏᴜᴛs in addition filters breakouts even if price closed above the upper MA Visualizer plot without having to agree with fill colour.
In addition to MA Visualizer Filter, and external filter like RSI, MACD etc. can also be used by connecting to Ichimoku Trader under ╔═══ 𝗣𝗹𝘂𝗴 𝗙𝗶𝗹𝘁𝗲𝗿 𝗵𝗲𝗿𝗲 ═══ 🔌 dropdown by enabling 𝐔𝐬𝐞 𝐄𝐱𝐭𝐞𝐫𝐧𝐚𝐥 𝐅𝐢𝐥𝐭𝐞𝐫 𝐚𝐬 𝐓𝐫𝐚𝐝𝐞 𝐅𝐢𝐥𝐭𝐞𝐫. The external filter can be used as the only filter or in addition to MA Visualizer filter.
To get the external filter to work, Sɪɢɴᴀʟ Tʏᴘᴇ must be set right. For plots that are not oscillatory like Moving Averages, Super Trend etc., choose type as Non Oscillatory and for Oscillators like RSI, CCI, MACD etc., choose type as Oscillatory .
For Oscillators, levels must be specified for Fɪʟᴛᴇʀ Lᴇᴠᴇʟ ғᴏʀ ʟᴏɴɢs and Fɪʟᴛᴇʀ Lᴇᴠᴇʟ ғᴏʀ sʜᴏʀᴛs , especially if the Oscillator doesnt have 0 as mid line, like RSI. Even for 0 mid oscillators like CCI, filter levels like 100/-100 work effectively to filter noise.
Use 𝐓𝐫𝐚𝐝𝐞 𝐙𝐨𝐧𝐞𝐬 𝐁𝐚𝐜𝐤𝐠𝐫𝐨𝐮𝐧𝐝 𝐅𝐢𝐥𝐥 under 𝗨𝘀𝗲𝗳𝘂𝗹 𝗘𝘅𝘁𝗿𝗮𝘀 to paint the trade zones background. It helps visually see the effect of filters on the breakout entries and also the trade performance.
===================================================================================================================
╔═════════ 𝗨𝘀𝗲𝗳𝘂𝗹 𝗘𝘅𝘁𝗿𝗮𝘀 ═════════╗
Ichimoku Trader also includes the following useful extras
𝐓𝐫𝐚𝐝𝐞 𝐙𝐨𝐧𝐞𝐬 𝐁𝐚𝐜𝐤𝐠𝐫𝐨𝐮𝐧𝐝 𝐅𝐢𝐥𝐥 paints the trade zones in green and red as mentioned above.
Sʜᴏᴡ Hɪɢʜs ᴀɴᴅ Lᴏᴡs plots the highest highs of the Bull Zone and the lowest lows of the Bear Zone to help spot the wicks, support and resistance.
Tᴀᴋᴇ Pʀᴏғɪᴛ Bᴀʀs helps detect the volatility exhaustion prices and plots $ signs to help the trader take profits or move stop loss levels to secure gains or to reduce losses.
Vɪsᴜᴀʟɪᴢᴇʀ Cᴏʟᴏʀ Bᴀʀs paints the price bars with trend intensity and the user can opt from one of two themes under Bᴀʀ Cᴏʟᴏʀ Sᴄʜᴇᴍᴇ (Chilli and Flame).
The bar colors can be inverted by enabling Iɴᴠᴇʀᴛ Bᴀʀ Cᴏʟᴏʀs to see reverse bias with respect to the current trade direction.
===================================================================================================================
╔═════════ 𝗔𝗹𝗲𝗿𝘁𝘀 ═════════╗
Alerts can be created for Long and Short entries by using Once Per Bar Close as Alert Frequency. Entries are generated on Real time bars based on Breakout and filter conditions. It is recommended to wait for bar close before taking a position based on Ichimoku Trader Trade Entries.
The indicator does not repaint and can be confidently used for alerts and trade entries without worrying about signals disappearing.
™TradeChartist Ichimoku Trader 𝗧𝗿𝗲𝗻𝗱 𝗜𝗱𝗲𝗻𝘁𝗶𝗳𝗶𝗲𝗿 can also be connected to ™TradeChartist Plug and Trade to generate entries along with Targets, Stop Loss plots etc. Target and Stop Loss alerts can be created using Plug and Trade's Alerts system.
===================================================================================================================
There are several combinations of settings that can be tested on the security traded based on timeframe and risk/reward expectations. The indicator can be used for trade entries with filter combinations or can be used as standalone Visualizer for trend confirmations, levels etc. Following are a few examples using the Visualizer.
╔════════ 𝗘𝘅𝗮𝗺𝗽𝗹𝗲 𝗖𝗵𝗮𝗿𝘁𝘀 ════════╗
1. BTC-USDT 1hr True Ichimoku Kumo Breakout with no filters.
2. BTC-USDT 1hr Ichimoku Trade Bands (Default) Breakout with no filters.
3. BTC-USDT 1hr Ichimoku Trade Bands (Default) Breakout using 200 period Hull MA Visualizer filter.
4. AAPL 4hr Ichimoku Trade Bands (Default) Breakout using 200 period VIDYA MA Visualizer filter. Note: VIDYA is normally used for long term trades.
5. GBP-USD 5m True Ichimoku Kumo Breakout using 144 period TEMA MA Visualizer filter and Money Flow Index connected as external filter with 80/20 Filter values.
6. XAU-USD 1hr Ichimoku Trade Bands (Default) Breakout using 144 period TEMA MA Visualizer and Keltner Channels basis line as external non-oscillatory filter, connected to ™TradeChartist Plug and Trade using Ichimoku Trader 𝗧𝗿𝗲𝗻𝗱 𝗜𝗱𝗲𝗻𝘁𝗶𝗳𝗶𝗲𝗿.
7. SHITPERP 1hr Ichimoku Trade Bands (0.618 Band Width and Lookback 89 periods) using 50 period Zero-Lag EMA Visualizer Filter.
===================================================================================================================
Best Practice: Test with different settings first using Paper Trades before trading with real money
===================================================================================================================
This is not a free to use indicator. Get in touch with me (PM me directly if you would like trial access to test the indicator)
Premium Scripts - Trial access and Information
Trial access offered on all Premium scripts.
PM me directly to request trial access to the scripts or for more information.
===================================================================================================================
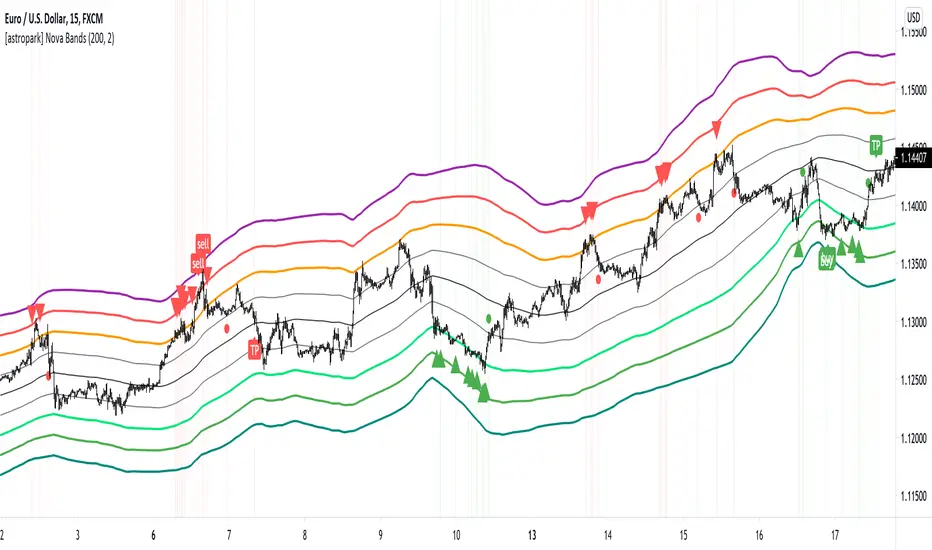
[astropark] Nova BandsDear followers,
today a new analysis and scalping tool for day trading on low timeframes (5-15 minutes) or to plan swing trades on hourly timeframes. It can be used also on high timeframes just for analysis current market trend.
The indicator plots a series of levels which create a nice bands flow.
The slope of levels make you easily understand when price is in consolidation, in uptrend or in downtrend.
The golden rule is always the same: buy low and sell high .
This indicator plots:
3 "price is low here" levels (from dark green to light green)
3 "price is average here" levels
3 "price is high here" levels (from purple to orange)
When bands are flat, price is in consolidation and this is best condition to trade with nova bands.
When price reaches higher bands, you will open a short position with targets below levels, fully closing your position when price hits the average level (black).
Here an example on Bitcoin on 15m using 1h resolution:
The same applies when price reaches lower bands, you will open a long position with targets above levels, fully closing your position when price hits the average level (black).
When bands get nearer and nearer is called "Bands Squeeze": price is next to a main breakout move, volatility is coming!
Here an example of SPX500: after long consolidation and bands getting nearer and neared, we had the breakout, downwards in this case.
In this screenshot you can see what signals algorithm provided:
Our suggestion is to play safe these kind of scenarios, no reason to FOMO buy/sell. Just wait for price consolidation / getting back inside the bands.
For example you would have skip first three buy signals, while you would have longed the last two as price came back inside bands after the big volatility which made price went below bands.
Another example is TSLA stock on 15m with 1h resolution:
Price touched the first bullish level and made a big move upwards, breaking bands with a +90% move.
In this case, you would have skipper first 2 sell signals, while you would have accepted next two with stoploss above recent high.
Acceptable also the other two sell signals, which you may have closed when price retraced to lower levels:
You can of course run trends like this buying on price hitting bullish/lower levels after a long consolidation and sell on price hitting middle and higher levels:
A trader who wants to be a winner must understand that money and risk management are very important, so manage your position size and always have a stop loss in your trades.
Here some examples how the indicator works on different markets:
EURUSD 15m with standard settings and 1h resolution
GOLD (XAUUSD) 15m with standard settings and 1h resolution
Facebook (FB) 15m with standard settings and 1h resolution
This is a premium indicator , so send me a private message in order to get access to this script.
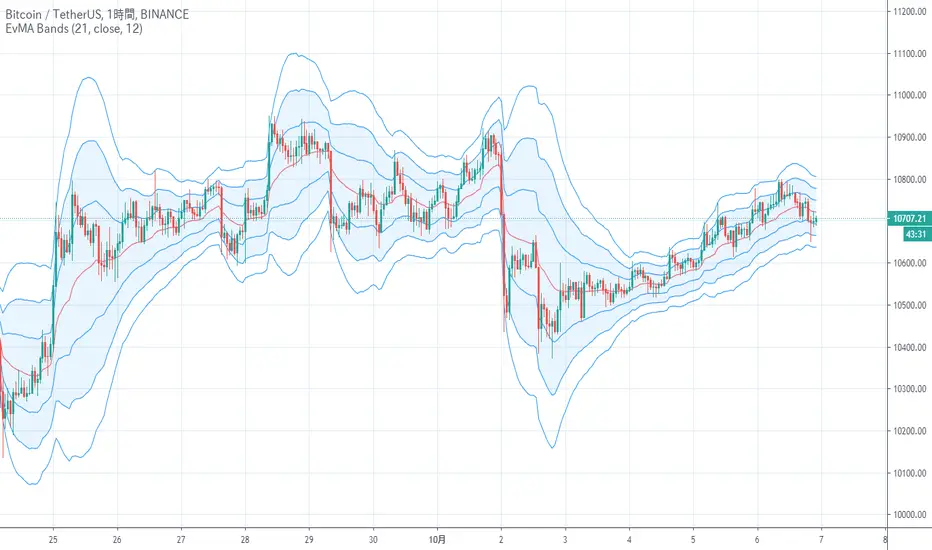
EvMA BandsIt is an index that looks like the final evolution by weighting the Bollinger band with exponential smoothing and volume.
The base Line is my EvMA as volume weighted EMA, so it is quite responsive.
The standard deviation is also exponentially smoothed, and the reaction is too good to handle, so it is further smoothed by EMA.
Charts without volume are not weighted with volume as 1.
It seems that the usage in trading is the same as the Bollinger band
ボリンジャーバンドを指数平滑出来高加重し、最終進化したような指標です
中央線は拙作のEvMAで出来高加重EMAなのでかなり反応が良いです
標準偏差も指数平滑出来高加重して反応が良すぎて扱いにくいのでさらにEMAで平滑化しています
出来高の無いチャートは出来高を1として加重しないようにしています
トレードでの使い方はボリンジャーバンドと同じで良いと思われます
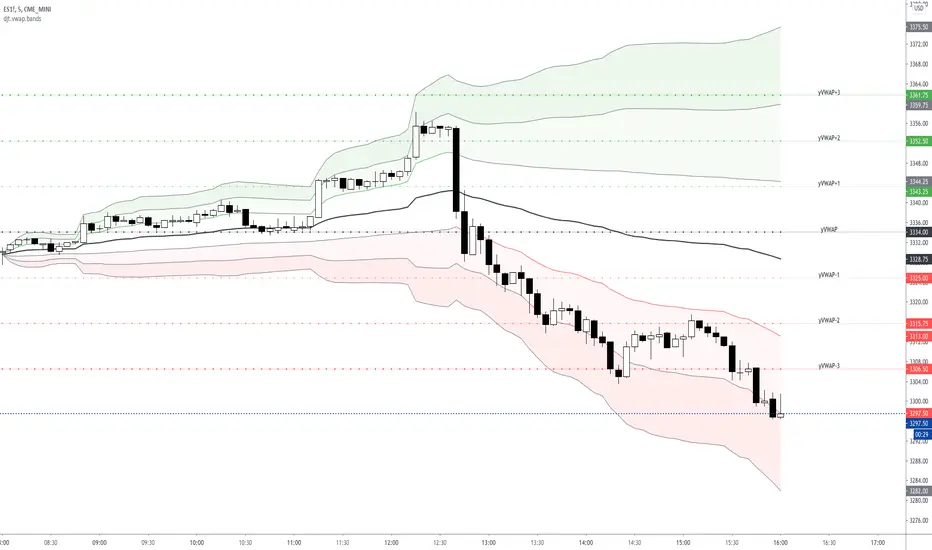
VWAP Standard Deviation Bands w/History & LabelsThis is my bread and butter when trading futures .
- 3 Standard Deviation Bands (Above and Below)
- Yesterday's VWAP and Band Levels
- Labels to help keep track of levels
- Ability to define resolution (I use Daily for my intraday scalping and Weekly/Monthly for context)
EMA Keltner Channel 1D100/200 EMAs, along with Keltner Bands based off them. Colors correspond to actions you should be ready to take in the area. Use to set macro mindset.
Uses the security function to display only the 1D values.
Red= Bad
Orange = Not as Bad, but still Bad.
Yellow = Warning, might also be Bad.
Purple = Dip a toe in.
Blue = Give it a shot but have a little caution.
Green = It's second mortgage time.