BOLLY BandsThis is a strategy using Bollinger Bands. The strategy is predicated around having low volatility in price action and then looking to capture a move when price starts to trend outside of the Bollinger bands. This strategy has only been backtested for 1 month but it has promising results so I will be sharing it looking for feedback. I run this strategy on the ERUSD 1 min chart.
النطاقات والقنوات

Channels Strategy [JoseMetal]============
ENGLISH
============
- Description:
This strategy is based on Bollinger Bands / Keltner Channel price "rebounds" (the idea of price bouncing from one band to another).
The strategy has several customizable options, which allows you to refine the strategy for your asset and timeframe.
You can customize settings for ALL indicators, Bollinger Bands (period and standard deviation), Keltner Channel (period and ATR multiplier) and ATR (period).
- AVAILABLE INDICATORS:
You can pick Bollinger Bands or Keltner Channels for the strategy, the chosen indicator will be plotted as well.
- CUSTOM CONDITIONS TO ENTER A POSITION:
1. Price breaks the band (low below lower band for LONG or high above higher band for SHORT).
2. Same as 1 but THEN (next candle) price closes INSIDE the bands.
3. Price breaks the band AND CLOSES OUT of the band (lower band for LONG and higher band for SHORT).
4. Same as 3 but THEN (next candle) price closes INSIDE the bands.
- STOP LOSS OPTIONS:
1. Previous wick (low of previous candle if LONG and high or previous candle if SHORT).
2. Extended band, you can customize settings for a second indicator with larger values to use it as STOP LOSS, for example, Bollinger Bands with 2 standard deviations to open positions and 3 for STOP LOSS.
3. ATR: you can pick average true ratio from a source (like closing price) with a multiplier to calculate STOP LOSS.
- TAKE PROFIT OPTIONS:
1. Opposite band (top band for LONGs, bottom band for SHORTs).
2. Moving average: Bollinger Bands simple moving average or Keltner Channel exponential moving average .
3. ATR: you can pick average true ratio from a source (like closing price) with a multiplier to calculate TAKE PROFIT.
- OTHER OPTIONS:
You can pick to trade only LONGs, only SHORTs, both or none (just indicator).
You can enable DYNAMIC TAKE PROFIT, which updates TAKE PROFIT on each candle, for example, if you pick "opposite band" as TAKE PROFIT, it'll update the TAKE PROFIT based on that, on every single new candle.
- Visual:
Bands shown will depend on the chosen indicator and it's settings.
ATR is only printed if used as STOP LOSS and/or TAKE PROFIT.
- Recommendations:
Recommended on DAILY timeframe , it works better with Keltner Channels rather than Bollinger Bands .
- Customization:
As you can see, almost everything is customizable, for colors and plotting styles check the "Style" tab.
Enjoy!
============
ESPAÑOL
============
- Descripción:
Esta estrategia se basa en los "rebotes" de precios en las Bandas de Bollinger / Canal de Keltner (la idea de que el precio rebote de una banda a otra).
La estrategia tiene varias opciones personalizables, lo que le permite refinar la estrategia para su activo y temporalidad favoritas.
Puedes personalizar la configuración de TODOS los indicadores, Bandas de Bollinger (periodo y desviación estándar), Canal de Keltner (periodo y multiplicador ATR) y ATR (periodo).
- INDICADORES DISPONIBLES:
Puedes elegir las Bandas de Bollinger o los Canales de Keltner para la estrategia, el indicador elegido será mostrado en pantalla.
- CONDICIONES PERSONALIZADAS PARA ENTRAR EN UNA POSICIÓN:
1. El precio rompe la banda (mínimo por debajo de la banda inferior para LONG o máximo por encima de la banda superior para SHORT).
2. Lo mismo que en el punto 1 pero ADEMÁS (en la siguiente vela) el precio cierra DENTRO de las bandas.
3. El precio rompe la banda Y CIERRA FUERA de la banda (banda inferior para LONG y banda superior para SHORT).
4. Igual que el 3 pero ADEMÁS (siguiente vela) el precio cierra DENTRO de las bandas.
- OPCIONES DE STOP LOSS:
1. Mecha anterior (mínimo de la vela anterior si es LONGy máximo de la vela anterior si es SHORT).
2. Banda extendida, puedes personalizar la configuración de un segundo indicador con valores más extensos para utilizarlo como STOP LOSS, por ejemplo, Bandas de Bollinger con 2 desviaciones estándar para abrir posiciones y 3 para STOP LOSS.
3. ATR: puedes elegir el average true ratio de una fuente (como el precio de cierre) con un multiplicador para calcular el STOP LOSS.
- OPCIONES DE TAKE PROFIT:
1. Banda opuesta (banda superior para LONGs, banda inferior para SHORTs).
2. Media móvil: media móvil simple de las Bandas de Bollinger o media móvil exponencial del Canal de Keltner .
3. ATR: se puede escoger el average true ratio de una fuente (como el precio de cierre) con un multiplicador para calcular el TAKE PROFIT.
- OTRAS OPCIONES:
Puedes elegir operar sólo con LONGs, sólo con SHORTs, ambos o ninguno (sólo el indicador).
Puedes activar el TAKE PROFIT DINÁMICO, que actualiza el TAKE PROFIT en cada vela, por ejemplo, si eliges "banda opuesta" como TAKE PROFIT, actualizará el TAKE PROFIT basado en eso, en cada nueva vela.
- Visual:
Las bandas mostradas dependerán del indicador elegido y de su configuración.
El ATR sólo se muestra si se utiliza como STOP LOSS y/o TAKE PROFIT.
- Recomendaciones:
Recomendada para temporalidad de DIARIO, funciona mejor con los Canales de Keltner que con las Bandas de Bollinger .
- Personalización:
Como puedes ver, casi todo es personalizable, para los colores y estilos de dibujo comprueba la pestaña "Estilo".
¡Que lo disfrutes!

[Sniper] SSL Hybrid + QQE MOD + Waddah Attar StrategyHi. I’m DuDu95.
**********************************************************************************
This is the script for the series called "Sniper".
*** What is "Sniper" Series? ***
"Sniper" series is the project that I’m going to start.
In "Sniper" Series, I’m going to "snipe and shoot" the youtuber’s strategy: to find out whether the youtuber’s video about strategy is "true or false".
Specifically, I’m going to do the things below.
1. Implement "Youtuber’s strategy" into pinescript code.
2. Then I will "backtest" and prove whether "the strategy really works" in the specific ticker (e.g. BTCUSDT) for the specific timeframe (e.g. 5m).
3. Based on the backtest result, I will rate and judge whether the youtube video is "true" or "false", and then rate the validity, reliability, robustness, of the strategy. (like a lie detector)
*** What is the purpose of this series? ***
1. To notify whether the strategy really works for the people who watched the youtube video.
2. To find and build my own scalping / day trading strategy that really works.
**********************************************************************************
*** Strategy Description ***
This strategy is from "SSL QQE MOD 5MIN SCALPING STRATEGY" by youtuber "Daily Investments".
"Daily Investments" claimed that this strategy will make you some money from 100 trades in any ticker in 5 minute timeframe.
### Entry Logic
1. Long Entry Logic
- close > SSL Hybrid Baseline.
- QQE MOD should turn into blue color.
- Waddah Attar Explosion indicator must be green.
2. Short Entry Logic
- close < SSL Hybrid Baseline
- QQE MOD should turn into red color.
- Waddah Attar Explosion indicator must be red.
### Exit Logic
1. Long Exit Logic
- When QQE MOD turn into red color.
2. Short Entry Logic
- When QQE MOD turn into blue color.
### StopLoss
1. Can Choose Stop Loss Type: Percent, ATR, Previous Low / High.
2. Can Chosse inputs of each Stop Loss Type.
### Take Profit
1. Can set Risk Reward Ratio for Take Profit.
- To simplify backtest, I erased all other options except RR Ratio.
- You can add Take Profit Logic by adding options in the code.
2. Can set Take Profit Quantity.
### Risk Manangement
1. Can choose whether to use Risk Manangement Logic.
- This controls the Quantity of the Entry.
- e.g. If you want to take 3% risk per trade and stop loss price is 6% below the long entry price,
then 50% of your equity will be used for trade.
2. Can choose How much risk you would take per trade.
### Plot
1. Added Labels to check the data of entry / exit positions.
2. Changed and Added color different from the original one. (green: #02732A, red: #D92332, yellow: #F2E313)
3. SSL Hybrid Baseline is by default drawn on the chart.
4. If you check EMA filter, EMA would be drawn on the chart.
5. Should add QQE MOD and Waddah Attar Explosion indicator manually if you want to see QQE MOD.
**********************************************************************************
*** Rating: True or False?
### Rating:
→ 1.5 / 5 (0 = Trash, 1 = Bad, 2 = Not Good, 3 = Good, 4 = Great, 5 = Excellent)
### True or False?
→ False
→ Doesn't Work on 5 minute timeframe. Also, it doesn't work on crypto.
### Better Option?
→ Use this for Day trading or Swing Trading, not for Scalping. (Bigger Timeframe)
→ Although the result was bad at 5 minute timeframe, it was profitable in 1h, 2h, 4h, 8h, 1d timeframe.
→ BTC, ETH was ok.
→ The result was better when I use EMA filter (only on longer timeframe).
### Robust?
→ So So. Although result was bad in short timeframe (e.g. 30m 15m 5m), backtest result was "consistently" profitable on longer timeframe.
→ Also, MDD was not that bad under risk management option on.
**********************************************************************************
*** Conclusion?
→ Don't use this on short timeframe.
→ Better use on longer timeframe with filter, stoploss and risk management.

Trend #4 - ATR+EMA channelOverview:
This strategy use ATR to take-profit, Red-EMA to stop-loss, Blue-EMA channel to judgment breakout.
This strategy use commission setting is 0.05%, slippage setting is 2 ticks, you can set the appropriate value size in the properties page.
What it does:
This strategy detects when a trend is emerging and buy or sell.
How it does it:
When the price breaks through the blue EMA channel, the trend is judged to be strong in the short term, strategy generates a buy or sell order.
After buying or selling,, if the price moves in the expected direction, uses ATR to determine the appropriate spread to take profit, otherwise use red EMA for stop loss.
How to use it:
Start Date and Stop Date - This parameter adjusts the time range used by the strategy.
Stoploss - This parameter adjusts the stop loss amount after each order is placed.
Blue EMA length - This parameter adjusts the length of the channel.
Blue EMA multy - This parameter adjusts the width of the top and bottom of the channel.
ATR Period - This parameter adjusts the number of candles used by the ATR.
ATR mult - This parameter adjusts the upper and lower widths of the ATR. Lowering this parameter can improve the win rate, but not necessarily the profitability.
Red EMA length - This parameter adjusts the number of candles used by the red EMA .
Long - This switch is used to turn Long position on or off.
Short - This switch is used to turn short position on or off.

CONSOLIDATION BAND BREAKOUT [5MIN TF]CONSOLIDTION BREAKOUT STRATEGY for 5 minute Time-Frame , that has the time condition adjustable for Indian Markets.
// ══════════════════════════════════════════════════════════════════════════ //
Unlike the Free Scripts - Risk Management , Position Sizing , Partial Exit etc. are also included .
Message to know more about the strategy.
// ══════════════════════════════════════════════════════════════════════════ //
The Timing can be changed to fit other markets, scroll down to "TIME CONDITION" to know more.
The commission is also included in the strategy .
The basic idea is when ,
1) Price crosses above upper Level ,indicated by Red Line, is a Long condition .
2) Price crosses below lower Level ,indicated by Green Line , is a Short condition .
3) Candle close crosses above ema1 , is a part of the Long condition .
4) Candle close crosses below ema1 , is a part of the Short condition .
5) Allowed hours specifies the trade entry timing.
6) ATR STOP is the stop-loss value on chart , can be adjusted in INPUTS.
7) Target 1 is the 1st target value on chart , can be adjusted in INPUTS.
8) RISK is Maximum Risk per trade for the intraday trade can be changed .
9) Total Capital used can be adjusted under INPUTS.
10) ATR TRAIL is used for trailing after entry, as mentioned in the inputs below.
11) Check trades under the list of trades .
12) Trade only in liquid stocks .
13) Risk only 1-5% of total capital.
14) Inputs can be changed for better back-test results, but also manually check the trades before setting alerts
15) SQUARE OFF TIME - As you change the time frame , also change the square-off time to that candle's closing time.
Eg: For 3min Time-frame , Hour = 2Hrs | Minute = 57min
16) Strategy stops for the day if you have a loss .
*The input values and the results are mentioned under "BACKTEST RESULTS" below*
// ══════════════════════════════ //
// ————————> RISK MANAGEMENT <——————— //
// ══════════════════════════════ //
Risk management is done based on max loss per trade and can be adjusted in the INPUTS.
// ═══════════════════════════ //
// ————————> POSITION SIZE <——————— //
// ═══════════════════════════ //
Quantity of each trade is different based on the loss
// ═════════════════════════ //
// ————————> PROPERTIES <——————— //
// ═════════════════════════ //
COMMISSION , SLIPPAGE ,RECALCULATE is already mentioned .
COMMISSION can be charges , based on the broker charges.
// ═══════════════════════════════//
// ————————> TIME CONDITION <————————— //
// ═══════════════════════════════//
The time can be changed in the INPUT.
The Indian Markets open at 9:15am and closes at 3:30pm.
The 'Allowed hours' under Inputs specifies the time at which Entries should happen .
"Close All" function closes all the trades before 3pm , at the open of the next candle.
To change the time to close all trades , check INPUT.
All open trades get closed at 3pm , because some brokers don't allow you to place fresh intraday orders after 3pm .
// ═══════════════════════════════════════════════ //
// ————————> BACKTEST RESULTS ( 123 CLOSED TRADES )<————————— //
// ═══════════════════════════════════════════════ //
INPUTS can be changed for better Back-Test results.
The strategy applied to NSE:TCS (5 min Time-Frame and with a capital of 1,00,000 ) gives us 77% profitability , as shown below
It was tested for a period a 1 year with a Profit Factor of 2.143 ,net Profit of 10,886 Rs .
The Initial Capital and Risk can be increased for better results.
The graph has a Linear Curve with Consistent Profits.
The INPUTS are as follows,
1) LENGTH ——————————————> 79
2) MUT_STDEV ————————————> 2.3
3) ALLOWED HRS ———————————> 9:25 TO 14:30
4) ATR STOP ——————————————> 2.2
5) RISK ——————————————————> 400
6) ATR TRAIL ———————————————> 2.6
7) TARGET 1 ————————————————> 2.1
8) MAX POSITION VALUE ——————————> 1,00,000
8) MAX DRAWDOWN —————————————> 2,000
8) SQUARE-OFF ————————————————> 14:55
NSE:TCS
Apply it to your charts Now !!
Send us a message to know more about this strategy
Thank You ☺ NSE:TCS

[DuDu95] SSL 4C MACD Laugerre RSI StrategyHello Guys! Nice to meet you all!
Before I start, my nickname has changed to 'DuDu95'!!
This is the Strategy introduced by youtube channel.
I made this based on the open source indicator by kevinmck100, vkno422, KivancOzbilgic. Thank you All!
### Entry Logic
1. Long Entry Logic
- close > SSL Hybrid baseline upper k (keltner channel)
- macd signal > 0 and current MACD value > previous MACD value
- Laguerre RSI < overbought Line.
2. short Entry Logic
- close < SSL Hybrid baseline lower k (keltner channel)
- macd signal < 0 and current MACD value < previous MACD value
- Laguerre RSI > overbought Line.
### Exit Logic
1. Long Exit Logic
- close < SSL Hybrid baseline lower k (keltner channel)
- macd signal < 0
2. short Entry Logic
- close > SSL Hybrid baseline upper k (keltner channel)
- macd signal > 0
### StopLoss
1. Can Choose Stop Loss Type: Percent, ATR, Previous Low / High.
2. Can Chosse inputs of each Stop Loss Type.
### Take Profit
1. Can set Risk Reward Ratio for Take Profit.
- To simplify backtest, I erased all other options except RR Ratio.
- You can add Take Profit Logic by adding options in the code.
2. Can set Take Profit Quantity.
### Risk Manangement
1. Can choose whether to use Risk Manangement Logic.
- This controls the Quantity of the Entry.
- e.g. If you want to take 3% risk per trade and stop loss price is 6% below the long entry price,
then 50% of your equity will be used for trade.
2. Can choose How much risk you would take per trade.
### Plot
1. Added Labels to check the data of entry / exit positions.
2. Changed and Added color different from the original one. (green: #02732A, red: #D92332, yellow: #F2E313)

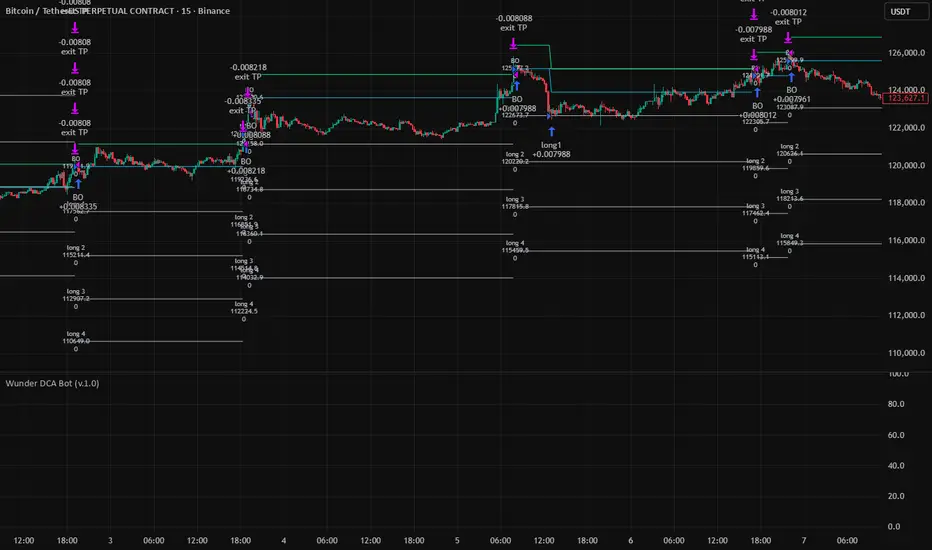
Wunder DCA BotThe bot is based on the DCA system.
1. DCA is the investment method in which you buy a certain portion of the asset after the determined price deviation.
2. For entry, we evaluate the maximum and minimum levels for a given period that you can adjust in the script. The bot enters when price rebound from the specified levels.
3. For the exit, the bot will use the take profit percentage that you will specify in settings.
It is also possible to choose how the take profit is calculated either from the average entry price or from the entry order (first order).
4. DCA uses the following settings:
- Base order Volume: Volume of your first order on entry signal
- Subsequent orders volume: The volume of all subsequent orders except the first
- DCA orders count: This parameter will determine how many entries your overall strategy will have. For example: If you will put 3, that will mean that including your initial position you will have 2 additional orders.
- DCA order price deviation:
This is the value in % which determines the deviation of the additional entries from the entry price. Example: If you go long and the price of the asset is 100$ and you put an order price deviation of 1% that will mean that the first additional entry will occur when the price will drop by 1%, and the second entry will be triggered when the overall price will drop by 2% (as the interval between the first and the second additional entry will be 1%).
- DCA Order Volume Multiplier:
This parameter will determine the amount that you put into each additional position. If this parameter is equal to 1 that means that each additional entry will be equal to the initial amount. The extra volume will be added to your position from the second DCA entry. Example: Your initial position was 10$ and your Volume Multiplier is set to 2. When you reach your 1st DCA target your additional order will have the same volume of 10$. When you reach your 2nd DCA target your additional order will be 20$ (previous position volume * multiplier). Your 3rd DCA target will place the order of 40$.
- DCA order price Deviation Multiplier:
This value will increase the price deviation between each additional entry. It is calculated as the price deviation multiplied by the deviation multiplier. For example: if you enter long at the price 100$ and have a price deviation of 1% with the price deviation multiplier of 2 that will mean that the first additional entry will occur when the price will drop to 99$ however the second will occur when the price will go to 97$. The third additional position will be entered at 94$
5. For full automation of the bot, you should set your comments to the input in the bot settings in the "LONG" and "SHORT" fields. You also need to create an alert signal and set a Webhook to send signals.
IMPORTANT!!!
1. Position calculation should take into account several factors: your deposit, leverage, the number of DCA orders, the distance to the last DCA order;
2. When choosing leverage, it is important to correctly calculate the possible drawdown. If you set a high leverage value, then liquidation awaits and the bot will not be able to take profits and will exit the position ahead of time;
3. The size of the position must be determined in accordance with all risks and take into account the size of your deposit;
4. This DCA Bot is able to earn consistently with the correct calculated money management.
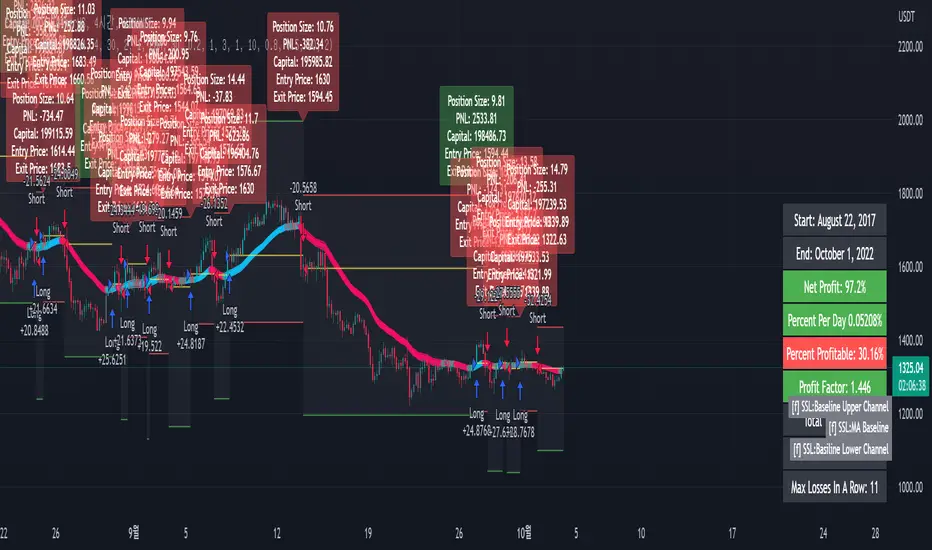
[fpemehd] SSL Baseline StrategyHello Guys! Nice to meet you all!
This is my third script!
This Logic is trend following logic, This detects long & short trends based on SSL Hybrid Baseline.
This fits to the longer time frame like 4hr and 1d.
### Long Condition
1. close > SSL Hybrid baseline upper k
- Baseline is the ma of close price. (You can choose ma type and length)
- Upper k is the upper Keltner Channel.
### Short Condition
1. close < SSL Hybrid baseline lower k
- Baseline is the ma of close price. (You can choose ma type and length)
- Lower k is the lower Keltner Channel.
### Etc
1. Added Stoploss based on highest high or lowest low with lookback.
2. Strategy Template is based on @kevinmck100 template. Thank you!
GT 5.1 Strategy═════════════════════════════════════════════════════════════════════════
█ OVERVIEW
People often look an indicator in their technical analysis to enter a position. We may also need to look at the signals of one or more indicators to verify the signals given by some indicators. In this context, I developed a strategy to test whether it really works by choosing some of the indicators that capture trend changes with the same characteristics. Also, since the subject is to catch the trend change, I thought it would be right to include an indicator using the heikin ashi logic. By averaging and smoothing the market noise, Heiken Ashi makes it easier to detect the direction of the trend helps to see possible reversal points on the chart. However, it should be noted that Heiken Ashi is a lagging indicator.
I picked 5 different indicators (but their purpose are similar) and combined them to produce buy and sell signals based on your choice(not repaint). First of all let's get some information about our indicators. So you will understand me why i picked these indicators and what is the meaning of their signals.
1 — Coral Trend Indicator by LazyBear
Coral Trend Indicator is a linear combination of moving averages, all obtained by a triple or higher order exponential smoothing. The indicator comes with a trend indication which is based on the normalized slope of the plot. the usage of this indicator is simple. When the color of the line is green that means the market is in uptrend. But when the color is red that means the market is in downtrend.
As you see the original indicator it is simple to find is it in uptrend or downtrend.
So i added a code to find when the color of the line change. When it turns green to red my script giving sell signals, when it turns red to green it gives buy signals.
I hide the candles to show you more clearly what is happening when you choose only Coral Strategy. But sometimes it is not enough only using itself. Even if green dots turn to red it continues in uptrend. So we need a to look another indicator to approve our signal.
2 — SSL channel by ErwinBeckers
Known as the SSL , the Semaphore Signal Level channel is an indicator that combines moving averages to provide you with a clear visual signal of price movement dynamics. In short, it's designed to show you when a price trend is forming. This indicator creates a band by calculating the high and low values according to the determined period. Simply if you decide 10 as period, it calculates a 10-period moving average on the latest 10 highs. Calculate a 10-period moving average on the latest 10 lows. If the price falls below the low band, the downtrend begins, if the price closes above the high band, the uptrend begins. Lets look the original form of indicator and learn how it using.
If the red line is below and the green band is above, it means that we are in uptrend, and if it is on the opposite side, it means that we are in downtrend. Therefore, it would be logical to enter a position where the trend has changed. So i added a code to find when the crossover has occured.
As you see in my strategy, it gives you signals when the trend has changed. But sometimes it is not enough only using this indicator itself. So lets look 2 indicator together in one chart.
Look circle SSL is saying it is in downtrend but Coral is saying it has entered in uptrend. if we just look to coral signal it can misleads us. So it can be better to look another indicator for validating our signals.
3 — Heikin Ashi RSI Oscillator by JayRogers
The Heikin-Ashi technique is used by technical traders to identify a given trend more easily. Heikin-Ashi has a smoother look because it is essentially taking an average of the movement. There is a tendency with Heikin-Ashi for the candles to stay red during a downtrend and green during an uptrend, whereas normal candlesticks alternate color even if the price is moving dominantly in one direction. This indicator actually recalculates the RSI indicator with the logic of heikin ashi. Due to smoothing, the bars are formed with a slight lag, reflecting the trend rather than the exact price movement. So lets look the original version to understand more clearly. If red bars turn to green bars it means uptrend may begin, if green bars turn to red it means downtrend may begin.
As you see HARSI giving lots of signal some of them is really good but some of them are not very well. Because it gives so much signals Now i will change time period and lets look same chart again.
Now results are better because of heikin ashi's logic. it is not suitable for day traders, it gives more accurate result when using the time period is longer. But it can be useful to use this indicator in short time periods using with other indicators. So you may catch the trend changes more accurately.
4 — MACD DEMA by ToFFF
This indicator uses a double EMA and MACD algorithm to analyze the direction of the trend. Though it might seem a tough task to manage the trades with the help of MACD DEMA once you know how the proper way to interpret the signal lines, it will be an easy task.
This indicator also smoothens the signal lines with the time series algorithm which eventually makes the higher time frame important. So, expecting better results in the lower time frame can result in big losses as the data reading from the MACD DEMA will not be accurate. In order to understand the function of this indicator, you have to know the functions of the EMA also.
The exponential moving average tends to give more priority to the recent price changes. So, expecting better results when the volatility is very high is a very risky approach to trade the market. Moreover, the MACD has some lagging issues compared to the EMA, so it is super important to use a trading method that focuses on the higher time frame only. What does MACD 12 26 Close 9 mean? When the DEMA-9 crosses above the MACD(12,26), this is considered a bearish signal. It means the trend in the stock – its magnitude and/or momentum – is starting to shift course. When the MACD(12,26) crosses above the DEMA-9, this is considered a bullish signal. Lets see this indicator on Chart.
When the blue line crossover red line it is good time to buy. As you see from the chart i put arrows where the crossover are appeared.
When the red line crossover blue line it is good time to sell or exit from position.
5 — WaveTrend Oscillator by LazyBear
This is a technical indicator that creates high and low bands between two values. It then creates a trend indicator that draws waves with highs and lows within these boundaries. WaveTrend is a widely used indicator for finding direction of an asset.
Calculation period: number of candles used to calculate WaveTrend, defaults to 10. Averaging period: number of candles used to average WaveTrend, defaults to 21.
As you see in chart when the lines crossover occured my strategy gives buy or sell signals.
═════════════════════════════════════════════════════════════════════════
█ HOW TO USE
I hope you understand how the indicators I mentioned above work and what they are used for. Now, I will explain in detail how to use the strategy I have created.
When you enter the settings section, you will see 5 types of indicators. If you want to use the signals of the indicators, simply tick the box next to the indicators. Also, under each option there is an area where you can set the "lookback". This setting is a field that will make the signals overlap when you select more than one option. If you are going to trade with only one option, you should make sure that this field is 0. Otherwise, it may continue to generate as many signals as you choose.
Lets see in chart for easy understanding.
As you see chart, if i chose only HARSI with lookback 0 (HARSI and CORAL should be 1 minumum because of algorithm-we looking 1 bar before, others 0 because we are looking crossovers), it will give signals only when harsı bar's color changed. But when i changed Lookback as 7 it will be like this in chart.
Now i will choose 2 indicator with settings of their lookback 0.
As you see it will give signals when both of them occurs same time. But HARSI is an indicator giving very early signal so we can enter position 5-6 bars after the first bar color change. So i will change HARSI Lookback settings as 7. Lets look what happens when we use lookback option.
So it wil be useful to change lookback settings to find best signals in each time period and in each symbol. But it shouldnt be too high. Because you can be late to catch trend's starting.
this is an image of MACD and WAVE trend used and lookback option are both 6.
Now lets see an example with 3 options are chosen with lookback option 11-1-5
Now lets talk about indicators settings. After strategy options you will see each indicators settings, you can change their settings as you desired. So each indicators signal will be changed according to your adjustment.
I left strategy options with default settings. You can change it manually as if you want.
═════════════════════════════════════════════════════════════════════════
█ LIMITATIONS: Don't rely on non-standard charts results. For example Heikin Ashi is a technical analysis method used with the traditional candlestick chart.Heikin Ashi vs. Candlestick Chart: The decisive visual difference between Heikin Ashi and the traditional chart is that Heikin Ashi flattens the traditional candlestick chart using a modified formula.
The primary advantage of Heikin Ashi is that it makes the chart more reader-friendly and helps users identify and analyze trends .
Because Heikin Ashi provides averaged price information rather than real-time price and reacts slowly to volatility — not suitable for scalpers and high-frequency traders. I added HARSI indicator as a supportive signal because it is useful with using CORAL and SSL channel indicators. If you change your candle types to Heikin Ashi , your profit will change in good way but dont rely on it.
═════════════════════════════════════════════════════════════════════════
█ THANKS:
Special thanks to authors of the scripts that i used.
@LazyBear and @ErwinBeckers and @JayRogers and @ToFFF
═════════════════════════════════════════════════════════════════════════
█ DISCLAIMER
Any trade decisions you make are entirely your own responsibility.

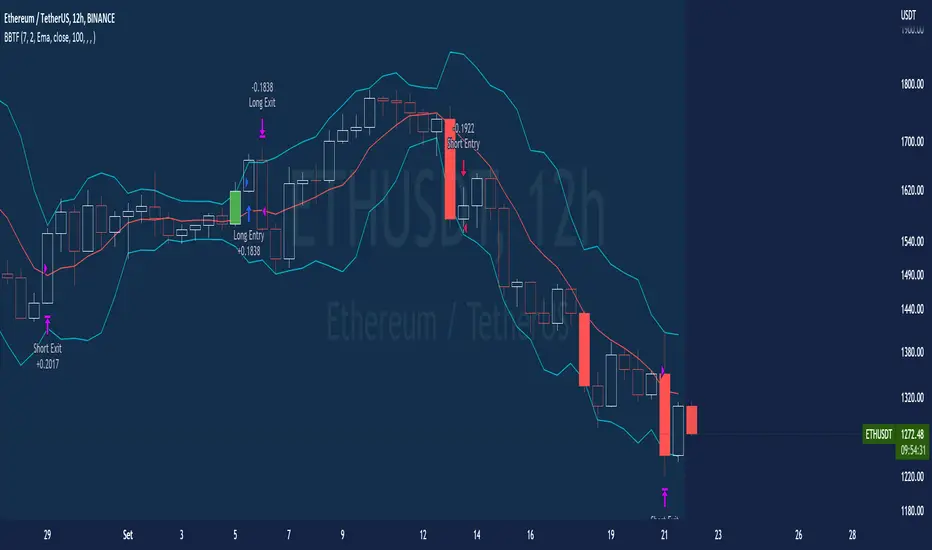
BT-Bollinger Bands - Trend FollowingEsse script foi criado para estudo de Backtest.
O script usa as Bandas de Bollinger para indicar o início de uma tendência, a entrada é configurada quando o preço abre abaixo e fecha acima da banda superior ou para venda quando o preço abre acima e fecha abaixo da banda inferior.
Não há um stop fixo e nem alvo fixo a saída se dá quando o preço toca a média da banda.
Você pode usar uma média móvel como filtro combinado com a estratégia.
O Script também pode ser usado com algum serviço de bot como 3commas.io , basta colocar as mensagens de entrada e saída para o bot.
Autor : Credsonb - Nick: M4TR1X_BR
Neste gráfico estou usando as seguintes configurações:
Bandas Bollinger: 7
Desvio Padrão: 1.5
Time Frame: 12hs
Ticker: ETH
This script was created for Backtest study.
script uses Bollinger Bands to indicate the start of a trend, entry is set when price opens below and closes above the upper band or for short when price opens above and closes below the lower band.
There is no fixed stop and no fixed target, the exit occurs when the price touches the average of the band.
You can use a moving average as a filter combined with the strategy.
The Script can also be used with some bot service like 3commas. io , just put the input and output messages to the bot.
Author : Credsonb - Nick: M4TR1X_BR
supertrend advanceHELLO FRIENDS ...............THIS IS SUPERTREND ADVANCE WITH HENKIASHI CANDLE ...I got so many request on supertrend with henkiashi. This is for all of them ..I am making it open for all so you can change its coding according to your need
SOME IMPONTENT UPDATE IN THIS SUPERTRNED
1) You Can Use It for option trading ...you can do algo option trading using this strategy
2) YOU CAN USE CUSTOME SYNTAX TO ALGO TRADE IN STOCK,FOREX,COMMODITY AND CRYPTO
3) YO CAN USE IT IN INTRADAY TIME PERIOD ALSO U CAN SET ITS ENTRY AND EXIT TIME
4) YOU CAN USE HENKIASHI SUPERTREND ON NORMAL CANDLE STICK CHART
5) YOU CAN USE ITS QUNTITY FEATURE .BY THIS WAY U CAN DOUBLE YOUR QUNTITY SIZE ON LOSSING TRADE AND WHEN PROIFT TRADE OCCUR ITS QUNTITY AGAIN AUTOMATICALLY SHIFTED TO NORMAL QUNTITY ....THIS FEATURE ONLY HELP TRADER WITH MORE MARGIN....USE THIS FEATURE PROPERLY.THIS FEATURE BEST WORK ON ONE SIDE MEANS ONLY BUY SIDE TRADE OR SELL SIDE TRADE
6)YOU CAN SET YOUR TARGET AND STOPLOSS IN POINTS AND IN PERCENTAGE
7) YOU CAN CHOSE ONE SIDE TO TRADE ONLY BUY SIDE OR SELL SIDE
HOPE THIS FEARTURES HELPS EVERY ONE
ALL THE BEST FOR SUCESSFULL TRADING

Bollinger Pair TradeNYSE:MA-1.6*NYSE:V
Revision: 1
Author: @ozdemirtrading
Revision 2 Considerations :
- Simplify and clean up plotting
Disclaimer: This strategy is currently working on the 5M chart. Change the length input to accommodate your needs.
For the backtesting of more than 3 months, you may need to upgrade your membership.
Description:
The general idea of the strategy is very straightforward: it takes positions according to the lower and upper Bollinger bands.
But I am mainly using this strategy for pair trading stocks. Do not forget that you will get better results if you trade with cointegrated pairs.
Bollinger band: Moving average & standard deviation are calculated based on 20 bars on the 1H chart (approx 240 bars on a 5m chart). X-day moving averages (20 days as default) are also used in the background in some of the exit strategy choices.
You can define position entry levels as the multipliers of standard deviation (for exp: mult2 as 2 * standard deviation).
There are 4 choices for the exit strategy:
SMA: Exit when touches simple moving average (SMA)
SKP: Skip SMA and do not stop if moving towards 20D SMA, and exit if it touches the other side of the band
SKPXDSMA: Skip SMA if moving towards 20D SMA, and exit if it touches 20D SMA
NoExit: Exit if it touches the upper & lower band only.
Options:
- Strategy hard stop: if trade loss reaches a point defined as a percent of the initial capital. Stop taking new positions. (not recommended for pair trade)
- Loss per trade: close position if the loss is at a defined level but keeps watching for new positions.
- Enable expected profit for trade (expected profit is calculated as the distance to SMA) (recommended for pair trade)
- Enable VIX threshold for the following options: (recommended for volatile periods)
- Stop trading if VIX for the previous day closes above the threshold
- Reverse active trade direction if VIX for the previous day is above the threshold
- Take reverse positions (assuming the Bollinger band is going to expand) for all trades
Backtesting:
Close positions after a defined interval: mark this if you want the close the final trade for backtesting purposes. Unmark it to get live signals.
Use custom interval: Backtest specific time periods.
Other Options:
- Use EMA: use an exponential moving average for the calculations instead of simple moving average
- Not against XDSMA: do not take a position against 20D SMA (if X is selected as 20) (recommended for pairs with a clear trend)
- Not in XDSMA 1 DEV: do not take a position in 20D SMA 1*standart deviation band (recommended if you need to decrease # of trades and increase profit for trade)
- Not in XDSMA 2 DEV: do not take a position in 20D SMA 2*standart deviation band
Session management:
- Not in session: Session start and end times can be defined here. If you do not want to trade in certain time intervals, mark that session.(helps to reduce slippage and get more realistic backtest results)

HHLL Strategy This is simple Highest high and Lowest low strategy.
Buy when break HH+offset
Sell when break LL+offset
Offset = (HH-LL)/2

wAvE-Catcher v20 qqeqwAvE-Catcher v20 qqe wAvE-Catcher v20 qqewAvE-Catcher v20 qqewAvE-Catcher v20 qqewAvE-Catcher v20 qqewAvE-Catcher v20 qqewAvE-Catcher v20 qqewAvE-Catcher v20 qqe


CCI+Hammer_5 mini am using a Hammer + CCI trading Strategy, which can determine the Long and Short postion


Price change scalping short and long strategyPrice change scalping Short and Long strategy uses a rate of change momentum oscillator to calculate the percent change in price between a period of time. Rate of change calculation takes the current price and compares it to a price of "n" periods while the period of time can be defined by a user. The calculated rate of change value is then compared to the upper threshold and the lower threshold values to determine if a position should be opened. If the threshold is crossed and filtering conditions are met a strategy position will be triggered. Entry, take profit, and stop loss prices are calculated and displayed on the chart as well as positions directions. Once the entry price is crossed, a long or short position is created and once the take profit price is crossed, the stop loss price will begin to trail behind the price action using the close of the previous bar. Once the trailing stop price is crossed, the position is closed. If the entry price is not crossed and the price action crosses the stop level, the trade setup is cancelled. The strategy is enhanced by DCA algorithm which allows to average entry price with safety orders. The script also allows to use Martingale coefficient to increase averaging power
Advantages of this script:
Strategy has high net profit of 293% at backtests
Backtests show high accuracy around 71%
High frequency and low duration of trades
Can be used with short-term timeframes ranging from 5 to 60 minutes
Strategy is sustainable to market slumps due to DCA implementation
Can be used for short and long positions (can be adjusted to long only, short only or both)
Can be applied to any market and quote currency
Easy to configure user interface settings
Built in detailed statistic menu
How to use?
1. Apply the strategy to a trading pair your are interested in using 5 to 60 minutes timeframe chart
2. Configure the strategy: change layer values, order size multiple and take profit/stop loss values according to current market cycle stage
3. Set up a TradingView alert to trigger when strategy conditions are met
4. Strategy will send alerts when to enter and when to exit positions which can be applied to your portfolio using external trading platforms
5. Update settings once market conditions are changed using backtests on a monthly period

Ichimoku Cloud and Bollinger Bands (by Coinrule)The Ichimoku Cloud is a collection of technical indicators that show support and resistance levels, as well as momentum and trend direction. It does this by taking multiple averages and plotting them on a chart. It also uses these figures to compute a “cloud” that attempts to forecast where the price may find support or resistance in the future.
The Ichimoku Cloud was developed by Goichi Hosoda, a Japanese journalist, and published in the late 1960s. It provides more data points than the standard candlestick chart. While it seems complicated at first glance, those familiar with how to read the charts often find it easy to understand with well-defined trading signals.
The Ichimoku Cloud is composed of five lines or calculations, two of which comprise a cloud where the difference between the two lines is shaded in.
The lines include a nine-period average, a 26-period average, an average of those two averages, a 52-period average, and a lagging closing price line.
The cloud is a key part of the indicator. When the price is below the cloud, the trend is down. When the price is above the cloud, the trend is up.
The above trend signals are strengthened if the cloud is moving in the same direction as the price. For example, during an uptrend, the top of the cloud is moving up, or during a downtrend, the bottom of the cloud is moving down.
The Bollinger Bands are among the most famous and widely used indicators. A Bollinger Band is a technical analysis tool defined by a set of trendlines plotted two standard deviations (positively and negatively) away from a simple moving average ( SMA ) of a security's price, but which can be adjusted to user preferences. They can suggest when an asset is oversold or overbought in the short term, thus providing the best time for buying and selling it.
This strategy combines the Ichimoku Cloud with Bollinger Bands to better enter trades.
Long orders are placed when these basic signals are triggered.
Long Position:
Tenkan-Sen is above the Kijun-Sen
Chikou-Span is above the close of 26 bars ago
Close is above the Kumo Cloud
The closing price is greater than the upper standard deviation of the Bollinger Bands
Short Position:
Tenkan-Sen is below the Kijun-Sen
Chikou-Span is below the close of 26 bars ago
Close is below the Kumo Cloud
The upper standard deviation of the Bollinger Band is greater than the closing price
The script is backtested from 1 January 2022 and provides good returns.
The strategy assumes each order is using 30% of the available coins to make the results more realistic and to simulate you only ran this strategy on 30% of your holdings. A trading fee of 0.1% is also taken into account and is aligned to the base fee applied on Binance.
This script also works well on BTC 30m/1h, ETH 2h, MATIC 2h/30m, AVAX 1h/2h, SOL 45m timeframes

BB Strategy toobabollinger bands strategy with added upper basis and lower line on the chart.
when we use BB strategy in trading view unfortunately the upper, lower and basis line did not display.
so we solve the problem with just a little script codes and bring back the lines to the chart

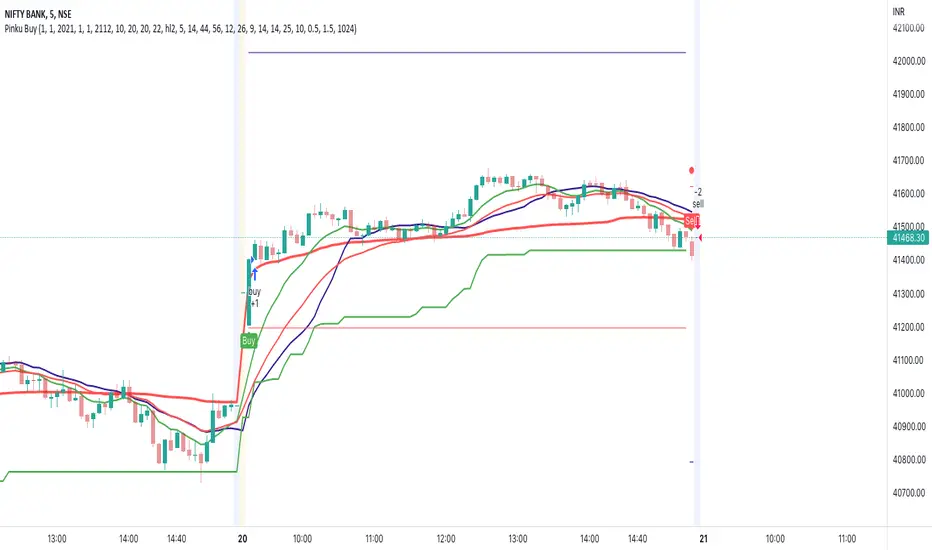
Consolidation Breakout [Indian Market Timing]OK let's get started ,
A Day Trading (Intraday) Consolidation Breakout Indication Strategy that explains time condition for Indian Markets .
The commission is also included in the strategy .
The basic idea is ,
1) Price crosses above upper band , indicated by a color change (green) is the Long condition .
2) Price crosses below lower band , indicated by a color change (red) is the Short condition .
3) ATR is used for trailing after entry
// ═══════════════════════════════//
// ————————> TIME CONDITION <————————— //
// ═══════════════════════════════//
The Indian Markets open at 9:15am and closes at 3:30pm.
The time_condition specifies the time at which Entries should happen .
"Close All" function closes all the trades at 2:57pm.
All open trades get closed at 2:57pm , because some brokers dont allow you to place fresh intraday orders after 3pm.
NSE:NIFTY1!
// ═══════════════════════════════════════════════ //
// ————————> BACKTEST RESULTS ( 114 CLOSED TRADES )<————————— //
// ═══════════════════════════════════════════════ //
LENGTH , MULT (factor) and ATR can be changed for better backtest results.
The strategy applied to NIFTY (3 min Time-Frame and contract size 5) gives us 60% profitability , as shown below
It was tested for a period a 8 months with a Profit Factor of 2.2 , avg Trade of 6000Rs profit and Sharpe Ratio : 0.67
The graph has a Linear Curve with consistent profits.
NSE:NIFTY1!
Save it favorites.
Apply it to your charts Now !!
Thank me later ;)
