VaCs, Trade Indic## 🎛 **MAIN PRICE CHART (Primary Panel)**
Overlay on the main candlestick chart:
* 200 EMA + 50 EMA trend ribbons
* Parabolic SAR
* Logarithmic Growth Curves (LGC / LGH)
* Stock-to-Flow (S2F) bands
* Linear, Log, and Polynomial Regression Channels
* Liquidity mapping:
* Buyside liquidity
* Sellside liquidity
* Fair Value Gaps (FVG)
* Order Blocks
* Imbalance Zones
* Smart Money Concepts (SMC):
* HH, HL, LH, LL structure
* BOS (Break of Structure)
* CHOCH (Change of Character)
* Whale Accumulation Layers:
* Wallet cohorts (1–10 / 10–100 / 100–1K / 1K–10K)
* Whale inflow/outflow
* Exchange net positions
* On-chain macro layers:
* NUPL
* MVRV
* SOPR
* Realized price bands
* Miner Position Indicator
* Hash Ribbons
* Market cycle markers:
* Halving cycles
* Accumulation, Markup, Distribution, Markdown phases
* Fundamental macro overlays:
* Fed interest rate events
* CPI releases
* ETF inflow/outflow markers
* Major global news catalysts
---
## 📊 **SUB-PANEL #1 — Momentum Oscillators**
Add a clearly separated lower panel containing:
* MACD (standard)
* RSI (14) **with divergence lines**
* Stochastic RSI
* MFI (Money Flow Index)
This panel must be independent and **not overlayed** on the main chart.
---
## 📊 **SUB-PANEL #2 — Volume & Flow Analytics**
A second independent lower panel showing:
* Volume Profile
* On-Balance Volume (OBV)
* **VWAP** (Volume Weighted Average Price)
* Must be clean, visible, and used for trend confirmation
* Use logic equivalent to TradingView Pine Script v6 **ta.vwap()**
* Represents a stable VWAP line across the full dataset
* Funding Rate
* Open Interest (OI)
* CVD (Cumulative Volume Delta)
---
## 📊 **SUB-PANEL #3 — On-Chain Analytics Panel**
Add a dedicated panel for:
* Exchange inflow/outflow
* Miner flow
* Realized profits vs realized losses
* Stablecoin Supply Ratio (SSR)
* Any high-frequency on-chain volatility signals
---
النطاقات والقنوات
XRP CrossChain Momentum EngineThis is a strategy with stop loss 3% , leverage 4 and no pyramiding. It works great with XRP and other coins with similar price, but i suggest XRP. Profit in 1 year around 900% and profit in 2 years around 2000% as you can see in the pictures. I have initial capital 1000 but it can change.

Dynamic Fair-Value Ribbon Pro @darshakssc1. What This Indicator Is (In Simple Terms)
The Dynamic Fair-Value Ribbon Pro is a visual tool that helps you see how price behaves around a statistically derived “fair-value zone”:
A colored ribbon/cloud marks a central “fair” area.
Areas above the ribbon are labeled as “Unfair High Zone”.
Areas below the ribbon are labeled as “Unfair Low Zone”.
A small state panel tells you where price currently sits relative to this ribbon.
All calculations are based only on historical price, volume, and volatility.
It does not predict future price, does not give buy/sell signals, and is not financial advice.
2. Adding the Indicator
Open a chart on TradingView.
Click on Indicators .
Search for “Dynamic Fair-Value Ribbon Pro” .
Click to add it to your chart.
You will see:
A cloud/ribbon around price.
Colored bars when price is outside the ribbon.
A panel in the top right describing the current state.
3. Core Concept: Fair vs Unfair Zones (Analytical Only)
The indicator tries to answer a descriptive question:
“Where is price trading relative to a historically derived central area?”
It does this by:
Calculating a central value (“fair mid”).
Building a band around that mid.
Coloring the chart depending on whether price is inside or outside that band.
It is not claiming that:
Price “must” return to the band.
Price is “overvalued” or “undervalued”.
Any state is good or bad.
It is simply a visual classification tool .
4. Engine Modes — How the Ribbon Is Calculated
Under “Fair-Value Engine” you can choose:
4.1 Mode 1: Range
Looks back over a chosen number of bars (default: 100).
Finds the highest high and lowest low in that window.
Defines a central “slice” of that range as the fair-value ribbon :
Range Mode: Lower Percent → bottom boundary of the slice (e.g., 30%).
Range Mode: Upper Percent → top boundary of the slice (e.g., 70%).
Effect:
The ribbon represents a middle portion of the historical range .
Above the ribbon = “Unfair High Zone” (analytical label only).
Below the ribbon = “Unfair Low Zone”.
This is purely statistical — it does not mean price is wrong or will revert.
4.2 Mode 2: VWAP + Stdev
In this mode, the central value is based on VWAP :
VWAP (Volume-Weighted Average Price) is used as the midline.
A standard deviation envelope is built around VWAP:
VWAP Mode: Stdev Multiplier controls how wide that envelope is.
Effect:
The ribbon shows where price is trading relative to a volume-weighted average .
Again, areas above and below are just described as “unfair” zones in a visual, analytical sense , not a predictive one.
5. ATR Adaptive Width — Making the Ribbon React to Volatility
Under “ATR Adaptive Width” :
Use ATR Adaptive Width:
On: the band width scales with volatility.
Off: band width stays fixed based on Range or VWAP settings.
ATR Length: how many bars to use for ATR.
Reference ATR (% of price): a reference level for normal volatility.
Min Width Scale / Max Width Scale: clamps the scaling so that the band doesn’t get too narrow or too wide.
What this does (analytically):
When volatility (ATR) is higher than the reference, the band can become wider .
When volatility is lower , the band can become narrower .
This is a mathematical rescaling only and does not imply any optimal levels or performance.
6. Visual Elements — What You See on the Chart
6.1 Fair-Value Ribbon (Cloud)
The cloud between Fair Ribbon Low and Fair Ribbon High is the fair zone .
Color can be changed via “Fair Ribbon Color” .
6.2 Midline
If “Show Center Line” is enabled:
A line runs through the middle of the ribbon.
In Range mode, this is the average of the upper and lower band.
In VWAP mode, it’s essentially the VWAP-based mid.
This line is for visual reference only and makes no claims about support, resistance, or reversion.
6.3 Bar Colors
Unfair High Zone: bars are colored with Unfair High Bar Color.
Unfair Low Zone: bars are colored with Unfair Low Bar Color.
Inside the ribbon:
If “Fade Bars Inside Fair Zone” is ON, bars may be more faded/neutral.
These colors are simply classification highlights ; they do not tell you what to do.
6.4 State Panel (Top Right)
If “Show State Panel” is enabled, you’ll see a small box that displays:
Current engine:
Range or VWAP+Stdev.
Current price state:
Inside Ribbon (Fair Zone)
Above Ribbon (Unfair High Zone)
Below Ribbon (Unfair Low Zone)
This is a quick summary of where price sits relative to the computed ribbon.
7. Typical Ways to Use It (Informational Only)
The indicator can help you visually:
See when price is spending time inside a historically defined central zone.
Notice when price is frequently trading outside that zone.
Compare different timeframes (e.g., 5m vs 1h vs 4h) to see how the fair zone shifts.
Experiment with:
Range length (shorter vs longer lookback).
VWAP vs Range mode.
ATR adaptation on/off.
Important:
Any interpretation of these visuals is entirely up to the user.
The script does not tell you to buy, sell, hold, or do anything specific.
8. Limitations and Important Notes
All calculations use past data only (price, volume, volatility).
The ribbon does not guarantee:
that price will revert,
that zones will hold,
or that any outcome will occur.
There are no built-in signals such as “long/short” or automatic entries/exits.
The script is best used as a supporting, visual layer alongside other tools or methods you choose.
9. Disclaimer
This indicator is:
Strictly informational and educational.
Not a trading system or strategy.
Not financial advice or a recommendation.
Not guaranteed to be accurate, complete, or suitable for any specific purpose.
Users should always perform their own research and due diligence.
Past behavior of any visual pattern or zone does not guarantee future behavior.

RRE HARSI4951✅ Buy Signal
RSI crosses above 49
Heikin Ashi green (ha_close > ha_open)
✅ Sell Signal
RSI crosses below 51
Heikin Ashi red (ha_close < ha_open)
Everything else in your code remains unchanged.

RSI Driven ATR Trend [NeuraAlgo]
RSI Driven ATR Trend
Dynamic Trend Detection and Strength Analysis
Unlock the market’s hidden rhythm with the RSI Driven ATR Trend , a sophisticated tool designed to measure trend direction and strength using a combination of RSI momentum and ATR-based volatility . This indicator provides real-time insights into bullish and bearish phases, helping traders identify potential turning points and optimize entry and exit decisions.
1.Core In Logic:
Dynamically calculates trend levels based on RSI and ATR interactions.
Highlights trend direction with intuitive color coding: green for bullish, red for bearish.
Displays trend strength as a percentage to quantify momentum intensity.
Automatic visual cues for potential trend reversals with “Turn Up” and “Turn Down” labels.
Advanced smoothing and dynamic gating ensure responsive yet stable trend detection.
Compatible with all timeframes and instruments.
2.Inputs Explained:
Rsi Factor: Adjusts the sensitivity of the RSI in trend calculation. Higher values make the trend detection more responsive to momentum changes.
Multiplier: Multiplies the effect of Rsi Factor to fine-tune trend responsiveness.
Bar Back: Number of bars used for peak and dip calculations, determining how far back the indicator looks for trend changes.
Period: Lookback period used in trend gating and ATR calculations.
Source: Price source for calculations (default is close).
Main Colors: Customize bullish and bearish trend colors.
3.How it Works:
The indicator calculates RSI values and ATR-based dynamic ranges to determine upper and lower trend levels.
Trend direction is determined by price crossing above (bullish) or below (bearish) the dynamic trend line.
Trend strength is expressed as a percentage relative to the trend line, helping you assess momentum intensity.
Visual cues like "Turn Up" and "Turn Down" labels indicate potential trend reversals.
Bars are colored dynamically based on trend direction for quick interpretation.
Ideal for traders seeking a clear, actionable view of market trends without the clutter of multiple indicators. RSI Driven ATR Trend translates complex price behavior into an easy-to-read visual guide, helping you make smarter trading decisions.
Happy Trading!

Delta Zones Smart Money Concept (SMC) UT Trend Reversal Mul.Sig.🚀 What's New in This Version (V5 Update)
This version is a major overhaul focused on improving trade entry timing and risk management through enhanced UT Bot functionality:
Integrated UT Trailing Stop (ATR-based): The primary trend filter and moving stop-loss mechanism is now fully integrated.
Pre-Warning Line: A revolutionary feature that alerts traders when the price penetrates a specific percentage distance (customizable) from the UT Trailing Stop before the main reversal signal fires.
"Ready" Signal: Plots a "Ready" warning label on the chart and triggers an alert condition (UT Ready Long/Short) for pre-emptive trade preparation.
V5 Compatibility: All code has been optimized for Pine Script version 5, utilizing the modern array and type structures for efficient Order Block and Breaker Block detection.
💡 How to Use This Indicator
This indicator works best when confirming signals across different components:
1. Identify the Trend Bias (UT Trailing Stop)
Uptrend: UT Trailing Stop line is Green (Focus only on Buy/Long opportunities).
Downtrend: UT Trailing Stop line is Red (Focus only on Sell/Short opportunities).
2. Prepare for Entry (Warning Line)
Action: When you see the "Ready" label or the price hits the Pre-Warning Line (Dotted Orange Line), this is your alert to prepare for a trend flip, or to tighten the stop on your current trade.
3. Confirm the Entry (Multi-Signals)
Look for a primary entry signal that aligns with the desired trend:
High-Conviction Entry: Wait for the UT Buy/Sell label (confirmed trend flip) AND a Combined Buy/Sell arrow (confirmed by your selected Oscillator settings).
High-Liquidity Entry: Look for a Delta Zone Box forming near an active Order Block or Breaker Block (SMC zones), and then confirm with a UT or Combined Signal.
4. Manage Risk (Trailing Stop)
Always set your initial Stop Loss (SL) either just outside the opposite Order Block or at the UT Trailing Stop level itself.
If the price closes back across the UT Trailing Stop, exit your position immediately, as the trend bias has officially shifted.
Features & Components
1. Delta Zones (Liquidity/Wick Pressure)
Identifies periods of extreme buying or selling pressure based on wick-to-body ratios and standard deviation analysis.
Plots colored pressure boxes (Buy/Sell) to highlight potential exhaustion points or institutional activity.
2. Smart Money Concepts (SMC)
Automatically detects and plots Order Blocks (OBs) and Breaker Blocks (BBs) based on confirmed Market Structure Breaks (MSBs).
Includes Chop Control logic to remove less reliable Breaker Blocks.
3. UT Bot Trailing Stop & Warning Line
UT Trailing Stop (ATR-based): Plots a dynamic trend line (Green/Red) that acts as a moving stop-loss and primary trend filter.
Ready/Warning Signals: Alerts traders (via the "Ready" label and orange lines) when the price enters a "Pre-Reversal Zone" near the Trailing Stop.
4. Multi-Indicator Confirmation (Filters)
Includes customizable signals based on the crossover/crossunder of RSI, CCI, and Stochastic indicators against configurable Overbought/Oversold levels.
Allows selection of combination signals (e.g., RSI & CCI, All Combined, etc.) for high-conviction entries.

Rider Algo 5 & 6 Strategies - RSI Extreme Trading [Rider Algo]Rider Algo 5 & 6 Strategies – RSI Extreme Trading
This script combines two of my favorite RSI concepts into a single price-based framework:
Strategy 5 (S5): Extreme Continuation
Strategy 6 (S6): Strength & Weakness Reversal
Everything is plotted directly on the price chart using an “inverse RSI” model that shows where price would be if RSI were at specific levels (default 70/30).
Core Idea – RSI Price Bands
The script builds two dynamic price bands:
Upper RSI Band → price level where RSI = upper level (70)
Lower RSI Band → price level where RSI = lower level (30)
These bands show when the market is operating in RSI overbought/oversold conditions directly on the candles.
Optional markers:
“Exit OB” and “Exit OS” show when price returns inside the band.
Strategy 6 – Strength & Weakness Reversal (S6)
Goal:
Fade exhaustion after a sustained RSI extreme.
Two independent extreme lines:
RSI Extreme Line WEAKNESS (S6) → 70
RSI Extreme Line STRENGTH (S6) → 30
Bearish “Weakness (S6)” signal
RSI trades above the Weakness line for ≥3 bars.
RSI crosses back below.
→ Red Weakness (S6) arrow above price.
Bullish “Strength (S6)” signal
RSI trades below the Strength line for ≥3 bars.
RSI crosses back above.
→ Green Strength (S6) arrow below price.
These are counter-trend reversal setups after extreme RSI stretches.
Strategy 5 – Extreme Continuation (S5)
Goal:
Trade continuation after an extreme breakout, entering on the first clean retest of the extreme line.
Uses:
Same RSI bands/extreme lines
EMA15 as a filter
Long (S5) – Extreme Continuation Long
Price breaks above the upper band.
Price touches EMA15 at least once.
First wick retest of the upper band with close back above → “Long (S5)” with exact entry level.
Short (S5) – Extreme Continuation Short
Mirror logic:
Break below the lower band.
Touch of EMA15.
First wick retest of the lower band with close back below → “Short (S5)”.
Why EMA15 filter?
It forces a cooldown, avoiding rapid-fire continuation signals during a single vertical leg.
Non-repainting logic
All signals use closed bars only.
S6 3-bar regimes use historical bars.
S5 retests are validated after breakout bars close.
EMA15 uses closed candles.
No repainting of historical markers.
Inputs & Customization
Base RSI & Bands
RSI Length – 14
RSI Source – close
Upper/Lower RSI Levels – adjustable (default 70/30)
Strategy 6 – Extreme Reversal
Adjustable Weakness/Strength levels
Toggle signals on/off
Strategy 5 – Extreme Continuation
Toggle Long/Short markers
Optional Exit OB/OS markers
Visual Style
Custom band colors, width, and fill transparency.
Alerts
Master on/off
OB/OS
Band exits
Weakness / Strength
Long (S5) / Short (S5)
How I like to use it
S6 for counter-trend entries after clear extremes.
S5 for continuation when the market is explosive and pulls back to the extreme line after touching EMA15.
Ideas:
Stop-loss beyond the extreme line.
Combine with HTF structure, liquidity or volume.
Works well on assets with expansion characteristics: crypto, indices, FX.
Disclaimer
This script is for educational purposes only.
It is not financial advice.
Test everything in demo and use proper risk management.
Tagging it as:
“Rider Algo 5 & 6 – RSI Extreme Trading”
helps others find it.

Tactical Deviation🎯 TACTICAL DEVIATION - Volume-Backed VWAP Deviation Analysis
What Makes This Different?
Unlike basic VWAP indicators, Tactical Deviation combines:
• Multi-timeframe VWAP deviation bands (Daily/Weekly/Monthly)
• Volume spike intelligence - signals only appear with volume confirmation
• Pivot reversal detection at deviation extremes
• Optional multi-VWAP confluence system
• Smart defaults for quality over quantity
This unique combination filters weak setups and identifies high-probability entries at extreme price deviations from fair value.
📊 DEFAULT SETTINGS (Ready to Use)
✅ Daily VWAP with ±2σ deviation bands
✅ Volume spike detection (1.5x average required)
✅ 2σ minimum deviation for signals
❌ Weekly/Monthly VWAPs (enable for multi-timeframe)
❌ Pivot reversal requirement (enable for stronger signals)
❌ Fill zones (optional visual enhancement)
Why: Daily VWAP is most relevant for intraday trading. 2σ bands catch meaningful moves. Volume spikes ensure conviction. Clean chart focuses on what matters.
🚀 HOW TO USE
BASIC USAGE:
• Green triangles (below bars) = Long signals at oversold deviations
• Red triangles (above bars) = Short signals at overbought deviations
SIGNAL QUALITY:
• Normal size, bright colors = Volume spike (best quality)
• Small size, lighter colors = Volume momentum
• Tiny size = No volume confirmation
DEVIATION ZONES:
• ±2σ = Extreme deviation (signals appear here)
• ±1σ to ±2σ = Extended but not extreme
• Within ±1σ = Normal range
TRADING APPROACHES:
Mean Reversion:
→ Enter when price reaches ±2σ with volume spike
→ Target: Return to VWAP or opposite band
→ Stop: Beyond extreme deviation
Trend Continuation:
→ Use bands to identify pullbacks
→ Enter pullback to VWAP in trending market
→ Volume confirms continuation
Reversal Trading:
→ Enable "Require Pivot Reversal" for stronger signals
→ Signals only when deviation + pivot reversal occur
→ Higher probability, fewer signals
⚙️ EXPLORE SETTINGS FOR FULL USE
VWAP SETTINGS:
• Show Weekly/Monthly VWAP = Multi-timeframe context
• Show ±1σ Bands = Normal deviation range
• Show ±3σ Bands = Extreme extremes (rare but powerful)
SIGNAL SETTINGS:
• Min Deviation: 1σ (more signals) | 2σ (default) | 3σ (fewer, extreme only)
• Require Pivot Reversal: OFF (default) | ON (stronger but fewer)
• Volume Spike Threshold: 1.5x (default) | 2.0x+ (major spikes) | 1.2x (more signals)
CONFLUENCE SETTINGS:
• Require Multi-VWAP Confluence: OFF (default) | ON (2+ VWAPs must agree)
• Min VWAPs: 2 (Daily + Weekly/Monthly) | 3 (all must agree)
VISUAL SETTINGS:
• Show Fill Zones = Shaded areas between bands
• Fill Opacity = Transparency adjustment
• Line Widths = Customize thickness
💡 PRO TIPS
1. Start with defaults, then enable features as you learn
2. Volume spike requirement filters weak moves - keep it enabled
3. Enable Weekly/Monthly VWAPs for higher timeframe context
4. Enable confluence for swing trading setups
5. Pivot reversals: ON for reversals, OFF for continuations
6. Check top-right info table for current deviation levels
🎨 VISUAL GUIDE
• Cyan Line = Daily VWAP (fair value)
• Cyan Bands = Daily deviation zones
• Orange Line = Weekly VWAP (if enabled)
• Purple Line = Monthly VWAP (if enabled)
• Green Triangle = Long signal (oversold)
• Red Triangle = Short signal (overbought)
⚠️ IMPORTANT
Educational purposes only. Always use proper risk management. Signals are based on statistical deviation, not guarantees. Volume confirmation improves quality but doesn't guarantee outcomes. Combine with your own analysis.
The unique combination of VWAP deviation analysis, volume profile confirmation, pivot identification, and multi-timeframe confluence in a single clean interface makes Tactical Deviation different from basic VWAP indicators.
Happy Trading! 📈

Volume Spike & Second Entry (Fast Scalping)this indicator puts volume spikes on your chart which gives a good indicator of a large move

smartAitrade Complete FocusTrendPajinko-SmartAiTrade Complete is an all-in-one price-action technical system designed for high-precision entries, intelligent trade management, and fully automated exit logic.
The system combines RSI swings, advanced divergence detection, ATR-based PJK Bands, smart retest logic, swing-break POI zones, trend filters (ADX), and automated breakeven/TP management into a single integrated indicator.
It is built to support traders who want structured, rule-based entries with minimal discretion, while still maintaining the flexibility of price-action behavior.
🔍 Core Components
1. RSI System
Standard RSI for overbought/oversold levels.
RSI Swing High/Low detection (using pivots).
Used for:
momentum confirmation
swing structure alignment
divergence detection filters
2. Advanced Divergence Engine
The indicator features a high-accuracy divergence module that detects:
• Bullish Divergence
Price makes a lower low
RSI makes a higher low
Pivot distances must fall within a valid bar-range
Optional filter: RSI must be in oversold zone
• Bearish Divergence
Price makes a higher high
RSI makes a lower high
Optional filter: RSI must be in overbought zone
You can choose to draw divergence lines on either:
RSI only
Price chart
Both
This system is optimized for low repaint and filters weak divergence signals.
3. ATR-Based PJK Bands System
A volatility-adaptive band system similar to Keltner/Bollinger hybrids:
Middle line uses SMA/EMA/VWMA
Upper/lower bands = middle ± ATR × multiplier
Bands detect:
momentum breakouts
band touch signals
high-probability reversal zones
Buy signal:
Price touches lower band and shifts upward
Sell signal:
Price touches upper band and shifts downward
4. Smart Retest System
After a momentum breakout or band touch signal:
A “smart retest zone” is created
The system waits for price to come back to the zone
If retest occurs within a user-defined timeout window, the signal is validated
Used to avoid chasing entries and reduce false breakouts
5. Swing Break & POI Zones
The indicator automatically detects price-swing structure:
Swing High Break → Sell POI box created
Swing Low Break → Buy POI box created
POI zones:
Represent potential liquidity pockets
Drawn with customizable height and width
Work as target areas or confirmation zones
6. ADX Trend Filter
ADX trend strength filter ensures signals are valid only when:
Trend strength > threshold (default 20)
Avoids signals in flat, low-volatility markets
7. Auto Trade Management (Breakeven System)
Fully automated exit logic:
TP1 distance set in pips
Once TP1 is reached → move Stop Loss to breakeven + offset
Additional option:
Close all open positions automatically when trend bias changes
Everything works even with multiple open trades.
8. Dashboard & Visual Interface
The indicator includes a clean dashboard showing:
Trend condition
RSI status
Advanced divergence status
Band and swing conditions
Active signals
Breakeven status
Total signals statistics
All visual components can be enabled/disabled individually.
🎯 Trading Philosophy
The system is built on three core principles:
1. Confirm Trend
ADX + ATR Bands define direction and strength.
2. Identify High-Probability Reversal or Continuation Zones
Smart Retest + Swing Structure + POI + Divergence.
3. Automate the Exit
Breakeven, TP1, and automatic closing keep emotions out of the decision.

盯盘-平均K线图This is a Pine Script v6 indicator/strategy designed to assist traders with clear, configurable trend and momentum signals. It combines adaptive filters and volatility-aware logic to highlight high‑quality entries and exits, includes optional multi‑timeframe confirmation, and supports risk controls such as stop loss/target levels. Signals are visualized directly on the chart with arrows/labels and can trigger TradingView alerts for real‑time notifications. The tool offers smoothing and sensitivity settings to tune responsiveness, overlay mode for price action, and strategy mode for backtesting performance. It’s built to be lightweight, transparent, and easy to adjust, helping traders streamline decision‑making while maintaining control over parameters and risk.

Gold Magic 1. Watch for the Icon
When you see the 💰 icon appear above or below the Bollinger Bands, it’s your first signal.
• An icon above the upper band means price has broken out to the upside.
• An icon below the lower band means price has broken out to the downside.
2. Wait for the Fair Value Gap
After the icon appears, the indicator will highlight the first Fair Value Gap (FVG) that forms.
• The FVG will show you exactly where a potential entry point is.
• It will also mark the suggested stop-loss level on the chart.
3. Prepare to Enter the Market
With the FVG and stop-loss levels in place, you have a clear idea of where to buy or sell and where to place your stop.
• This makes it easier to enter the market with confidence.

Guardian Entry Signal - FreeYou’ll instantly see big green triangles under the candles when all conditions line up. That’s your entry.
Set an alert and it will ping your phone the second one fires.

Carlos Money Printer (CMP 4.5)⭐ Carlos Money Printer (CMP 4.5) – Overview
Designed for precision day trading, swing filtering, and high-accuracy scalping.
Carlos Money Printer (CMP) 4.5 is a next-generation trading system engineered to identify high-probability trend expansions and disciplined exits using a multi-layer confirmation engine. CMP is built for traders who want clean visual signals, reduced noise, and a systematic approach that avoids emotional decision-making.
What CMP 4.5 Does
CMP analyzes market structure across multiple dimensions and automatically highlights:
🔥 1. High-Accuracy Entry Zones
CMP detects early-stage price expansions using a proprietary volatility engine (“BAM” signals) plus directional confirmation, giving traders visibility into explosive trend opportunities before most indicators react.
📈 2. Trend Direction & Strength
CMP reads trend behavior using a dynamic trend spine, allowing the system to clearly distinguish between pullbacks, trend continuation, and early reversal conditions.
🧠 3. Multi-Timeframe Confirmation
The built-in 6-timeframe dashboard shows whether higher-timeframes agree with the chart you're trading — giving you a fast snapshot of market alignment without flipping charts.
🎯 4. Sniper Entry System (Full/Moderate Modes)
CMP 4.5 offers two confluence-based entry models:
FULL Sniper Mode – highest confidence, strongest confluence
MOD Sniper Mode – more frequent entries with controlled risk
Both modes emphasize clean structure and avoid low-quality signals.
🚀 5. Intelligent Exit Engine (5m-Based)
CMP includes a hybrid exit model that combines:
Trend deceleration
Momentum reversal
Volatility exhaustion
Structural flip signals
This gives you objective, systematic exit points — no guessing, no chasing.
📊 6. Built-In Tools for Traders
ORB High/Low Zones (first 15 minutes)
ADR / ADT Daily Range Tracking
VWAP
Trend coloring
Clean chart-optimized visuals
Everything is integrated so you can trade from a single indicator.
🌟 Why Traders Like CMP
CMP is engineered to remove noise from the chart and show only the most useful information:
No clutter
No complicated settings
No lagging confirmation
No hype indicators
Just clean trend signals, controlled entries, and disciplined exits.
⚠️ Important Notice
CMP 4.5 is proprietary and licensed exclusively under the K&T Trust.
This is a private-use system intended for educational and non-commercial analysis.
Reproduction or redistribution of the source code is prohibited.
⚠️ Disclaimer
The Carlos Money Printer (CMP 4.5) indicator is a technical analysis tool designed for educational and informational purposes only. It does not constitute financial advice, investment advice, or trading recommendations. Like all trading indicators, CMP 4.5 cannot guarantee future performance, profitability, or accuracy. Markets involve risk, including the potential loss of capital.
By using CMP 4.5, the trader acknowledges and agrees that:
All trading decisions are made at their own risk,
Past performance does not guarantee future results,
CMP 4.5 is not a substitute for personal research or professional financial advice,
Neither the creator, K&T Trust, nor any affiliates are responsible for losses, damages, or outcomes resulting from its use.
CMP 4.5 is a tool — powerful, refined, and more advanced than many indicators — but it is not a promise, not a guarantee, and not liability-bearing.
Use it with proper risk management, discipline, and personal judgment.
Damo's Custom EMA Bands 1.0I was making these manually for a long time. They just give me more peace of mind when I'm using EMAs. They feel more like a net catching price. These are easy to make. All they are is 3 EMAs with the Source at High, Low and (H+L)/2 for the midpoint.
I find on a 3-Day chart on BTC the 100 EMA is great for telling what trend we're are in.
i.postimg.cc
NeuraAlgo - Market DynamicsNeuraAlgo – Market Dynamics
Simplyfying the Market Dynamics
Unlock the complexity of financial markets with NeuraAlgo – Market Dynamics. Designed for traders and investors alike, this intelligent tool distills the chaos of price movements, volume fluctuations, and trend directions into clear, actionable insights. With advanced algorithms working behind the scenes, it simplifies market dynamics so you can focus on making informed decisions, spotting opportunities, and managing risk with confidence.
Behind this simple overlay lies a powerful, complex algorithm.
Main Settings -Main Algorithm
Timeframe – Choose the chart timeframe that the indicator will analyze. It adapts the calculations to the selected interval for precise market insights.
Preset – Select the operating mode:
Main Trend: Focuses on the dominant market trend.
Multi Trend: Analyzes multiple trend layers for a broader perspective.
Sensitivity – Adjusts the indicator’s responsiveness to price changes. Higher values make the system more reactive to market fluctuations, while lower values smooth out minor noise.
Smooth Tuner – Controls the smoothing of the underlying calculations, helping to reduce false signals and provide cleaner trend visualization.
Orderflow Statistics – Toggle to display detailed order flow statistics directly on the chart for deeper market analysis.
Performance Statistics – Toggle to enable backtesting tables, showing historical performance metrics of the indicator for strategy evaluation.
2.Art Settings -Change Visuals
Color Scheme – Select a pre-defined visual theme for your charts:
Bright Light – High-contrast, vibrant colors for maximum clarity.
Freezer Mode – Cool-toned palette for calm, visually comfortable analysis.
Standard Mode – Balanced, neutral colors for everyday use.
Delta Mode – Highlights key differences and movements with distinct colors.
Custom – Fully customize the colors of bullish, bearish, and range elements.
Green / Red / Range (Custom Colors) – When “Custom” is selected, these options allow you to define the colors for bullish (Green), bearish (Red), and neutral/range areas (Range) according to your preference.
Candle Coloring Type – Choose how candles are highlighted based on market signals:
Confirmation Simple – Basic signal-based coloring for clear, direct visualization.
Confirmation Gradient – Smooth gradient-based coloring for more dynamic and aesthetic signal representation.
3.Dashboard -Market Statistics
The Dashboard provides a compact, at-a-glance overview of key market conditions and indicator metrics, helping traders make faster and more informed decisions.
Functionality & Layout – The dashboard dynamically displays multiple sections:
Optimal Scale ⚖️ – Shows key market scaling metrics like volatility for better decision-making.
Risk Manager 📊 – Indicates the active risk management strategy (e.g., Risk-Reward, Partial Exits, or Trailing Stop Loss).
Orderflow Statistics 📈 – Displays market sentiment, footprint strength, and delta trends for precise order flow analysis.
Market Status 🌐 – Highlights current trend conditions and trend strength across different timeframes.
Bias Scores 🎯 – Provides trend strength percentages across multiple timeframes (5min, 15min, 30min, 1H, 4H, 1D) to quickly gauge market bias.
Backtest Performance -A summary panel showing the overall performance of the strategy.
Deposit -The starting capital used for backtesting.
Win Trades -Total number of profitable trades.
Winrate -Percentage of winning trades out of all trades.
Max DD -Maximum drawdown — the largest peak-to-trough loss.
PnL -Net profit or loss generated by the strategy.
Return -Percentage growth of the account during the test.
Profit Factor -Ratio of total profits to total losses.
The dashboard uses color-coded indicators (green for bullish, red for bearish, yellow for neutral) and merged cells for a clean and organized display.
It’s designed to simplify complex market dynamics into a visually intuitive interface, giving traders real-time insights without cluttering the chart.
4.Neura Engineering – Enhancements
This section provides advanced filtering options to fine-tune market analysis, reduce noise, and highlight meaningful trends.
Noise Filter – Smoothens minor price fluctuations to reduce false signals.Noise Sensitivity helps Adjust how aggressively the filter suppresses noise.
Gap Filter – Detects and smooths price gaps to improve trend clarity.Gap Sensitivity helps Controls the responsiveness of the gap filter.
Range Filter – Filters out small-range price movements to focus on significant market swings.helps Adjusts how tightly the filter defines meaningful ranges.
Volatility Filter – Highlights periods of high market volatility while filtering less active periods.helps Sets the threshold for what constitutes high volatility.
Trend Filter – Focuses analysis on strong trends by filtering out weaker signals.helps Determines the minimum strength required for a trend to be considered valid.helps Uses Average True Range to dynamically adjust trend filtering based on market movement.
These enhancement tools allow traders to customize signal clarity, reduce noise, and focus on meaningful market dynamics, creating a cleaner and more actionable charting experience.
5.Neura Overlays – Market Visual Enhancements
These overlays add visual intelligence to your chart, helping you instantly understand trend behavior, sentiment shifts, and price structure.
Reversal Cloud - Highlights potential reversal zones where price may change direction.Reversal Sensitivity helps Controls how quickly the cloud reacts to shifts in momentum.
Sentiment Cloud -Maps the underlying market mood—bullish, bearish, or neutral—directly onto the chart.Sentiment Sensitivity helps Adjusts how sensitive the sentiment readings are.
Price Steps -Draws structured “price steps” that reveal hidden market rhythm, impulse strength, and trend flow.Price Step Depth helps Determines the size and spacing of these steps.
Market Bias -Shows directional bias based on deeper trend pressure and underlying orderflow.Bias Sensitivity helps Controls how strict or lenient the bias detection is.
6.Risk Management Settings – Intelligent Trade Control
This module controls how your trades manage themselves after entry. Choose between traditional Risk/Reward exits, partial profit-taking, or an adaptive trailing stop system.
RiskReward
A classic risk-to-reward exit system.You set a risk multiple (e.g., 1:2), and the indicator automatically sets one Stop Loss and one Take Profit based on that ratio.
Partials
Scales out your position at multiple take-profit levels.Instead of closing the entire trade at once, the system secures profits gradually at TP1, TP2, and TP3 while keeping the remainder running.
TrailingStop
Uses a dynamic stop loss that follows price as it moves in your favor.There is no fixed Take Profit; instead, the trailing stop locks in profit and exits the trade automatically when momentum reverses.
7.Automatic Alert System
This is the System that organizes all settings related to the automatic webhook alert creator inside the indicator.
Rule No. 1 is never lose money. Rule No. 2 is never forget Rule No. 1.
Warren Buffet
NeuraAlgo – Market Dynamics transforms complex market behavior into clear, actionable insights for smarter trading decisions.

Shareline Normalized Momentum Indicator V1.1Normalized Momentum Indicator with Grimes MACD and CVD and VSI.


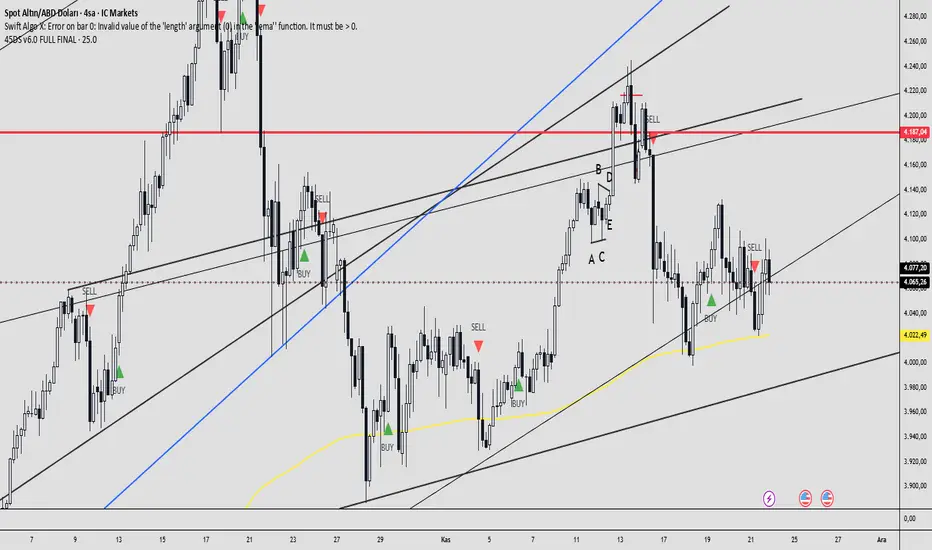
45DS v6.0 FULL FINAL1-5-15-30-60 dakıkalık zaman dlimlerinde sculp indikatörü . Başarısına inanamayacalsınız..
Market Range OracleMarket Range Oracle is an advanced volatility-adaptive projection tool designed to help traders anticipate future price behaviour, identify probabilistic ranges, and understand how markets historically expand or contract from the price open.
📊 By analysing historical bar-to-bar performance, ATR-filtered volatility, and fast-RSI momentum, the indicator creates a complete forward-looking range map for any timeframe.
📈 What Market Range Oracle Does
Calculates Expected Price Movement From the Open for any selected timeframe, the indicator measures thousands of past bars (or your chosen lookback) to determine:
Average % Gain
Average % Loss
Max Adjusted Gain (ATR-filtered projected peaks)
Max Adjusted Loss (ATR-filtered projected troughs)
Rate of green and red candle closes in the selected lookback period
Projected price levels for all of the above
These projections are then plotted directly on the chart or drawn as offset lines with detailed labels, all the colours, text size, show/hide elements are customisable from the indicator dashboard.
🧠 How does work and how to use it
The indicator computes projections across three independent timeframes:
Plots Timeframe — where visual projection bands are drawn
Lines & Labels Timeframe — creates separate-TF projection levels & labels
Forecast Timeframe — allows forward bar forecasting for the next candle
Forecast projections (when enabled) can be used to show the next future candle of any timeframe.
Example 1: Plots Timeframe set to current timeframe and the Forecast Timeframe option to the same timeframe, this will show an adaptive range moving with the price for current timeframe.
Example 2 : Find the potential Future range long term, the current timeframe is an weekly and we set the Forecast Timeframe to 2 weeks, as want to see potential top and bottom range for the next 2 weeks
Example 3 : Scalping with Market Range Oracle - Set the Bands to current timeframe and set the Projections lines and labels to a higher timeframe (in our case 15 minutes and a 4h)
⚡ Momentum Overlay (Fast RSI Hybrid)
A fast-RSI (RSI-2) colour code system measures short-term momentum and the top and bottom of the ranges display momentum.
Also the middle RSI 50 value equivalent EMA shows directional bias visualized with colour-shifting dashed line on the chart to help traders with clear trend direction.
🔔 Built-In Alert System
Alerts trigger on Price-Level Events and on momentum shift:
Price reaches projected Avg Loss
Price reaches projected Max Gain
Price reaches projected Max Loss
Midpoint Cross Events
Price crosses above mid-range
Price crosses below mid-range
Fast RSI bullish momentum
Fast RSI bearish momentum
Fast RSI strong bullish spike
Fast RSI strong bearish spike
🧩 Market Range Oracle is ideal for scalping, day-trading, swing trading, and position traders.
💬 Notes
Market Range Oracle does not predict future price — it projects statistically probable ranges based on historical behaviour and volatility. It is a decision-support tool to help traders navigate expected expansion from the open.


MA200 Parallel ChannelDynamic MA100 Parallel Bands – Precision S/R Levels
This indicator builds a clean, parallel channel around the 100-period moving average using a fixed ±4 offset.
Because the offset mirrors the short-term MA1 fluctuations, the channel reveals highly accurate support and resistance zones that react instantly to market micro-structure.
Unlike Bollinger Bands—which expand with volatility—this tool stays perfectly parallel and trend-aligned, making breakouts and pullbacks incredibly easy to spot.
How it works:
Centerline: 100-period moving average (MA100)
Upper Band: MA100 + 4
Lower Band: MA100 – 4
MA1 used as a sensitivity reference for micro-trend behavior
Parallel structure ensures stable, predictable levels
Why it’s powerful:
The ±4 channel creates extremely precise S/R zones
Price respecting the lower band = dynamic support
Price rejecting the upper band = dynamic resistance
A clean break above or below the bands highlights strong momentum shifts
Perfect for intraday traders needing structure without noise
Perfect for:
Identifying high-probability bounce levels
Spotting early trend continuation
Confirming MA100 breakouts
Filtering weak signals and fake volatility spikes
If you want razor-sharp support & resistance levels that stay consistent across all timeframes, these MA100 parallel bands deliver exceptional clarity.
SwRp - TWMA + Multi BBSwRp – TWMA + Multi Bands combines a Time-Weighted Moving Average with multi-standard-deviation bands to create a smooth, adaptive structure for tracking trend strength and volatility. The entire calculation is timeframe-aware, allowing you to shift the logic to any higher or lower timeframe while still viewing it on your chart.
This tool includes seven source modes, including a unique High + Low + HL2 option that plots three separate TWMA centres with their own deviation bands. You can switch between single-source, pair mode, or triple-source visualization depending on what you want to study.
Key Features
• TWMA smoothing: Adjustable weighted percentage for stronger trend clarity.
• Up to 5 deviation bands: Multi-level Bollinger-style bands for each source.
• Triple-source mode: High, Low, and HL2 each generate their own centres and bands.
• Pair mode controls: Show only centres, only a chosen σ level, or both.
• Flexible fills:
– Fill all levels up to a chosen deviation
– Or fill only one specific band
– Separate centre-fill when viewing TWMA pairs
• Timeframe-aware computing: Use any custom timeframe for the TWMA and band calculations.
Support & Resistance Visualization
The multiple deviation layers act as dynamic support and resistance zones.
Price often reacts, stalls, or reverses around these bands. The script makes it easy to see:
• Which band the price is respecting
• Whether volatility is compressing or expanding
• Where pullbacks are finding support
• Where rallies are facing resistance
• How the High, Low, and HL2 structures behave relative to each other
This makes it especially helpful for identifying high-probability entries, reversals, and continuation points.
Best For
• Intraday and swing traders
• Nifty, BankNifty, indices, futures.
