Watermark | Bar Time | Average Daily RangeMulti Info Panel & Watermark
Multi Info Panel & Watermark is a utility indicator that displays several pieces of chart information in a single, customizable panel. It is designed to support intraday and swing analysis by making key data—such as symbol details, date, and average daily range—easy to see at a glance, as well as providing simple tools for notes and backtesting.
Features
Watermark / Custom Note
Optional text overlay that can be used as a watermark or personal note.
Can display a strategy name, reminder, or any other user-defined label on the chart.
Ticker Info
Shows information about the currently active symbol on the chart (for example, symbol name and other basic details depending on the inputs).
Helps keep track of which market or pair is being analyzed, especially when using multiple charts.
Current Date
Displays the current date directly on the chart.
Useful for screenshots, journaling, and documenting analysis.
Average Daily Range (ADR)
Calculates the average daily range of the active symbol over a user-defined number of recent days.
Helps visualize how much price typically moves in a day, which can support position sizing, target setting, or volatility awareness within your own trading approach.
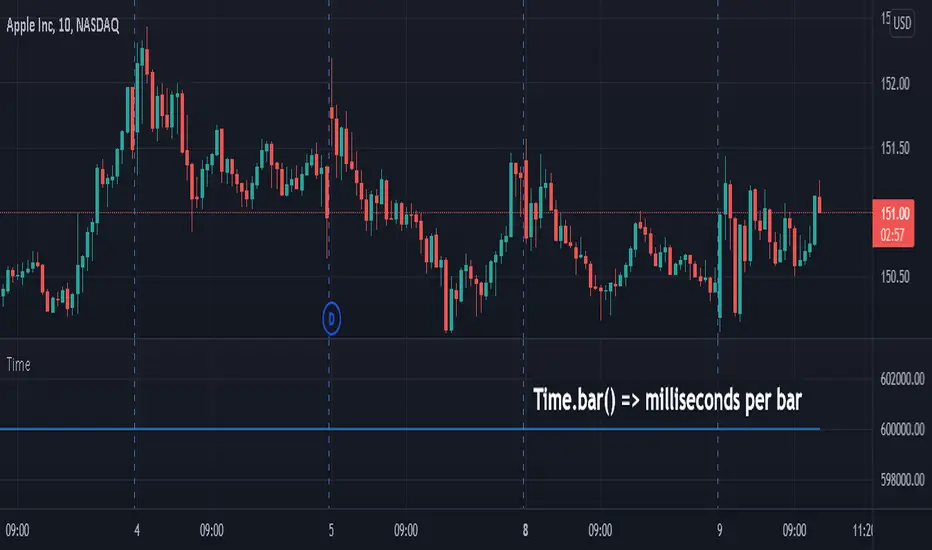
Open Bar Time Marker
Marks the open time of a selected bar (for example, a session open or a specific reference bar).
Primarily intended as a visual aid for manual backtesting and reviewing historical price action.
Usage
Use the watermark and ticker info to keep your charts labeled and organized.
Refer to the ADR readout to understand typical daily volatility of the instrument you are studying.
Use the date and open bar time marker when creating screenshots, trade journals, or when replaying historical sessions for review.
This script does not generate trading signals and does not guarantee any performance or results. It is provided solely as an informational and visualization tool. Always combine it with your own analysis, risk management, and decision-making. Nothing in this indicator or description should be considered financial advice.
Bartime

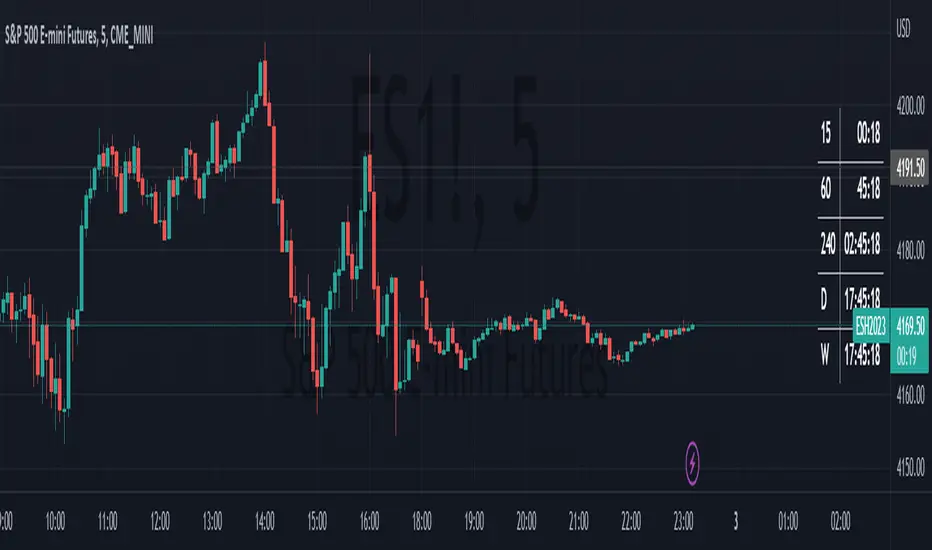
HTF Bar Close CountdownThis simple indicator displays a countdown for the amount of time left until a bar of your chosen timeframe closes.
Displays up to 5 different HTF countdowns.
Fully Customizable to fit any style, change the text colors, background colors, frame colors, display size and border & frame widths.
Flat display option for a sleek look to mesh with your charts.
Notes/Tips:
Higher Time Frames only! This is only intended to view HTF countdowns, will not work when trying to use a timeframe lower than your current chart's.
Some weird timeframes do not work, you'll know when.
Only works on live charts! Will display "Closed" when on an inactive chart.
Does not work for replay! A countdown is pretty pointless on a replay that is not real-time anyways...
Enjoy!