Smart Trader,Episode 1, by Ata Sabanci | Unified Matrix⚠️ **CRITICAL: READ BEFORE USING** ⚠️
This strategy is **100% VOLUME-BASED** and requires **Lower Timeframe (LTF) intrabar data** for accurate calculations. Please understand the following limitations before using:
**📊 DATA ACCURACY LEVELS:**
• **1T (Tick)** — Most accurate, real volume distribution per tick
• **1S (1 Second)** — Reasonably accurate approximation
• **15S (15 Seconds)** — Good approximation, longer historical data available
• **1M (1 Minute)** — Rough approximation, maximum historical data range
**⚠️ BACKTEST & REPLAY LIMITATIONS:**
• TradingView's Strategy Tester uses historical LTF data which may be limited depending on your subscription plan
• Replay mode results may differ from live trading due to data availability
• For longer backtest periods, use higher LTF settings (15S or 1M)
• Not all symbols/exchanges support tick-level data
• Crypto and Forex typically have better LTF data availability than stocks
**💡 A NOTE ON TOOLS:**
Successful trading requires proper tools. Higher TradingView plans provide access to more historical intrabar data, which directly impacts the accuracy of volume-based calculations. More precise volume data leads to more reliable signals. Consider this when evaluating your trading infrastructure.
**WHY "EPISODE 1"?**
This strategy is titled "Episode 1" because it focuses exclusively on **Highest Buyers (HB)** — a single but powerful concept in volume analysis.
**The Philosophy:**
A single high-volume buying event can tell us a story about market psychology:
• Where did the biggest buyers enter?
• How much of their power remains?
• Are sellers consuming their advantage?
• At what rate is the balance shifting?
By focusing on just ONE aspect of volume analysis, traders can deeply understand how a buying surge affects future price action before moving to more complex multi-factor analysis.
**The Reality:**
This script alone is approximately **2000 lines of code** — and it only analyzes buyers. A comprehensive system covering all aspects (sellers, combined analysis, multi-timeframe correlation) would be significantly larger and computationally heavier. Breaking this into focused modules allows for:
• Deeper understanding of each component
• Lighter, more responsive scripts
• Educational progression from simple to complex
**OVERVIEW**
Smart Trader EP1 is a volume-based trading strategy that tracks the balance of power between buyers and sellers through the lens of the **Highest Buyers event**. Unlike traditional indicators that rely on price patterns or mathematical formulas, this strategy analyzes *actual volume flow* to identify who is in control of the market.
The core philosophy is simple: **markets move when one side (buyers or sellers) exhausts their power while the opposing side accumulates strength.** By measuring this power shift in real-time, the strategy identifies high-probability entry and exit points.
**HOW IT WORKS**
**1. Volume Engine**
The strategy splits each candle's volume into buying volume and selling volume using intrabar data. In *Intrabar (Precise)* mode, it uses actual tick-by-tick or second-by-second data to calculate the exact buy/sell distribution. In *Geometry* mode, it approximates based on candle structure (close position within the range).
**2. Event Detection**
Within the lookback window, the strategy identifies key events:
• **HB (Highest Buyers)** — The candle with maximum buying volume (potential resistance when exhausted)
• **HS (Highest Sellers)** — The candle with maximum selling volume (potential support when exhausted)
• **LB (Lowest Buyers)** — The candle with minimum buying volume (buyer absence)
• **LS (Lowest Sellers)** — The candle with minimum selling volume (seller absence)
These events create dynamic support and resistance levels based on actual volume, not arbitrary price levels.
**3. Power Tracking (Attrition Model)**
For the Highest Buyers event (HB), the strategy tracks:
• **Start Power (X)** — The initial buying volume at the HB event
• **Consumed Power (Y)** — How much selling volume has accumulated since the event
• **Remaining Power (Z)** — Start Power minus Consumed Power (X - Y)
• **Opponent Dominance** — When Remaining Power goes negative (Z < 0), sellers have overtaken buyers
Think of it like a battle: buyers establish a position (HB), and sellers gradually consume their power. When buyers' power is exhausted (Remaining Power ≤ 0), sellers have taken control.
**4. Depletion Markers**
Visual markers appear on the chart when power reaches critical thresholds:
• **🔋** — Buyers consumed 100% (Remaining = 0)
• **🚨** — Buyers consumed 200% (Opponent Dominance = 100%)
• **🪫** — Sellers consumed 100%
• **⚠️** — Sellers consumed 200%
**5. Cumulative Delta**
Beyond tracking power at specific events, the strategy calculates the cumulative buy volume minus sell volume since the HB event. This shows the *net flow* of money:
• **Positive Delta** — More buying than selling since HB (bullish pressure)
• **Negative Delta** — More selling than buying since HB (bearish pressure)
**6. Trend Channel**
A 5-point linear regression channel identifies the current trend:
• **UPTREND** — Both upper and lower channel lines slope upward
• **DOWNTREND** — Both lines slope downward
• **RANGING** — Mixed or flat slopes
The strategy also tracks where the HB event occurred within this channel (TOP, UPPER, MIDDLE, LOWER, BOTTOM) to contextualize the signal.
**7. Nearest Event Analysis**
The strategy identifies which event is closest to the current candle and analyzes the price action *after* that event:
• How many bullish vs bearish candles followed?
• Does post-event momentum confirm or contradict the event type?
This prevents false signals when, for example, a bearish event occurs but is immediately followed by strong bullish candles.
**SIGNAL LOGIC**
**🟢 LONG Signal Conditions:**
• Uptrend with positive cumulative delta and buyers accumulating
• At channel bottom/lower with strong buyer power remaining
• After a bearish event (HS) with bullish post-event momentum (reversal signal)
• Ranging market with positive delta and strong power
**🔴 SHORT Signal Conditions:**
• Downtrend with negative cumulative delta and sellers in control
• Opponent Dominance (buyer power exhausted) with bearish momentum
• Buyer Trap: HB at TOP in uptrend but power exhausted and delta negative
• After a bullish event (HB) with bearish post-event momentum (trap signal)
**⏳ NO_TRADE Conditions:**
• Conflicting signals (e.g., bearish event but bullish post-momentum)
• Ranging market without clear direction
• Mixed power readings
• Price position contradicts signal direction
**STRATEGY EXECUTION**
**Entry Rules:**
• Enter LONG when signal is "LONG" and conditions are valid
• Enter SHORT when signal is "SHORT" and conditions are valid
• **Pyramid**: Up to 2 entries allowed in the same direction (configurable)
• Each entry uses 10% of equity by default
• Only one entry per confirmed candle (prevents multiple fills)
**Stop Loss (Event Line Based):**
• **LONG positions**: Stop Loss placed below the HS line (seller support level)
• **SHORT positions**: Stop Loss placed above the HB line (buyer resistance level)
• A small buffer percentage is added to prevent premature stops
**Take Profit (Event Line Based):**
• **LONG positions**: Take Profit near the HB line (buyer resistance target)
• **SHORT positions**: Take Profit near the HS line (seller support target)
• A small buffer percentage ensures realistic fill expectations
**Exit Rules:**
• Exit LONG when signal changes to SHORT
• Exit SHORT when signal changes to LONG
• **NO_TRADE signal = HOLD** (do not exit, wait for clear direction)
• SL/TP orders remain active regardless of signal changes
**SETTINGS GUIDE**
**⚙️ General Settings:**
• *Calculation Method* — Choose between Intrabar (Precise) or Geometry (approximation)
• *Intrabar Resolution* — LTF for volume data (1T, 1S, 15S, 1M)
• *Lookback Length* — Window for scanning events (10-150 bars)
• *Timezone Offset* — Adjust clock display to your local time
**📊 Matrix Display Settings:**
• *Show Unified Matrix* — Toggle the information dashboard
• *Show Event Lines* — Toggle horizontal lines at event prices
• *Panel Size/Position* — Customize dashboard appearance
• *Projection Bars* — Extend event lines into the future
• *Depletion Threshold* — Percentage for depletion markers (default: 100%)
**🏷️ Rank Labels Settings:**
• *Show Rank Labels (HB/HS)* — Display labels on highest volume candles
• *Show Low Labels (LB/LS)* — Display labels on lowest volume candles
• *Ranks Count* — Number of rankings to display (1-5)
**📐 Trend Channel Settings:**
• *Show Trend Channel* — Toggle the 5-point regression channel
• *Line Color/Fill/Width/Style* — Customize channel appearance
**🎯 Trade Signal Settings:**
• *Long: Min Remaining Power %* — Minimum buyer power for LONG signal (default: 50%)
• *Short: Max Remaining Power %* — Maximum power for SHORT signal (default: 30%)
• *Opponent Dominance Threshold* — When to consider power "exhausted" (default: 0%)
• *Max Decay Angle* — Maximum consumption rate for valid entries (default: 60°)
**📈 Strategy Execution Settings:**
• *Enable Strategy* — Turn automatic trading on/off
• *Allow LONG/SHORT* — Enable or disable specific directions
• *Max Pyramid Entries* — Maximum entries in same direction (1-3)
• *SL Buffer %* — Distance below/above event line for stop loss (default: 0.15%)
• *TP Buffer %* — Distance from event line for take profit (default: 0.05%)
**VISUAL ELEMENTS**
**Chart Labels:**
• **#1 HB** — Highest Buyers (rank label on candle high)
• **#1 HS** — Highest Sellers (rank label on candle low)
• **#1 LB** — Lowest Buyers (rank label on candle high)
• **#1 LS** — Lowest Sellers (rank label on candle low)
• **🔋 / 🚨** — Buyer power depletion markers
• **🪫 / ⚠️** — Seller power depletion markers
**Event Lines:**
• **Blue horizontal lines** — HB price levels (buyer entry points)
• **Red horizontal lines** — HS price levels (seller entry points)
• **Cyan lines** — LB price levels
• **Orange lines** — LS price levels
• **Dashed extensions** — Projected levels into future bars
**Trend Channel:**
• **Orange lines** — Upper and lower channel boundaries (5-point regression)
• **Orange fill** — Channel area (90% transparency)
**Matrix Dashboard (6 rows):**
• Row 1: Header with symbol, LTF setting, and local clock
• Row 2: Volume snapshot (Total, Buy, Sell, Delta)
• Row 3: Column headers
• Row 4: Highest Buyers data (Age, Start Power, Consumed, Remaining, Decay, ETA)
• Row 5: Highest Sellers data
• Row 6: Signal Evaluation (Trend, Zone, Nearest Event, Signal, Reason)
**Strategy Markers:**
• **Green triangle up** — LONG entry
• **Red triangle down** — SHORT entry
• **Faded triangles** — Pyramid entries
• **Colored lines** — SL (red) and TP (green) levels when in position
**BEST PRACTICES**
**For Maximum Accuracy:**
1. Use **1T (tick)** or **1S** intrabar resolution when available
2. Trade liquid markets with good volume data (crypto majors, forex majors, high-volume stocks)
3. Use smaller lookback length (20-30) to ensure all bars have valid LTF data
4. Monitor the "Intrabar Valid Bars" counter in the matrix header
5. If you see data warnings, reduce lookback or increase LTF resolution
**For Longer Backtests:**
1. Use **15S or 1M** intrabar resolution for more historical data
2. Increase lookback length if needed
3. Understand that accuracy decreases with higher LTF settings
4. Consider using Geometry mode for very long backtests (approximation but always available)
**Understanding the Signals:**
• Pay attention to the signal *reasoning* shown in the matrix — it explains WHY
• **NO_TRADE** means the system sees conflicting factors — respect this caution
• Event lines act as dynamic S/R — they update as new volume events occur
• Cumulative Delta (Δ) often provides early warning of trend changes
**Risk Management:**
• The default 10% per entry with max 2 pyramids = 20% maximum exposure
• Event-line-based SL/TP provides logical levels based on actual volume events
• Always verify signals with your own analysis before trading
**INTERPRETING THE MATRIX**
**Power Status Examples:**
• *Remaining Power: 75%* — Buyers still have most of their strength
• *Remaining Power: 25%* — Buyers nearly exhausted, watch for reversal
• *Opponent Dominance: -50%* — Sellers have consumed 150% of buyer power (strong bearish)
**Decay Angle:**
• *Low angle (0-30°)* — Slow consumption, power lasting longer
• *High angle (60-90°)* — Rapid consumption, expect quick exhaustion
**ETA to Parity:**
• Shows estimated bars until Remaining Power reaches zero
• *"Overtaken"* with 🚨 means sellers have already dominated
**LIMITATIONS & DISCLAIMER**
**Technical Limitations:**
• Requires sufficient historical LTF data (varies by TradingView plan and symbol)
• Intrabar (Precise) mode may show invalid data warnings on symbols with limited history
• Strategy tester may not have access to the same LTF data as live trading
• Maximum 500 lines and 500 labels (TradingView platform limits)
**Important Notes:**
• This strategy focuses on **Highest Buyers only** — it does not analyze all market factors
• Past performance does not guarantee future results
• Volume data quality varies significantly between symbols and exchanges
• The strategy's signals are analytical tools, not trading recommendations
**Risk Disclaimer:**
This strategy is provided for **educational and informational purposes only**. Trading involves substantial risk of loss and is not suitable for all investors.
• Always use proper risk management
• Never risk more than you can afford to lose
• Backtest results may differ significantly from live trading
• You are solely responsible for your trading decisions
**TECHNICAL SPECIFICATIONS**
• Pine Script Version: 6
• Calculation: calc_on_every_tick=true, use_bar_magnifier=true
• Default Capital: 10,000
• Default Position Size: 10% of equity
• Maximum Lines: 500
• Maximum Labels: 500
• External Library: TradingView/ta/10 (for requestUpAndDownVolume)
*Smart Trader EP1 — Understanding Volume, One Event at a Time*
Besttradingindicator

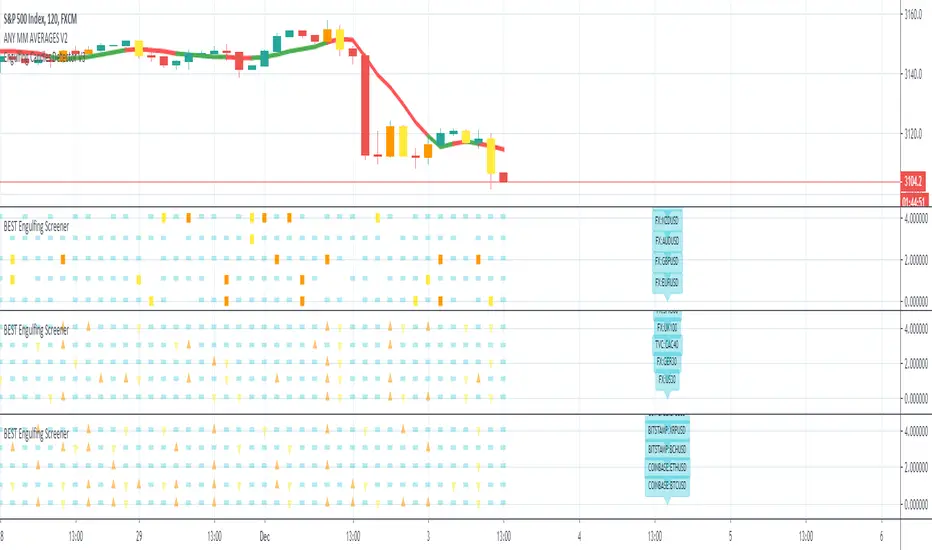
BEST Ultimate Engulfing ScreenerHello traders
Continuing deeper and stronger with the screeners serie. I keep getting requests private messages and requests saying that screeners aren't possible with TradingView.
My answer is always... "Reallyyy ??" (I never find a better answer than that...)
I'll publish a few screeners just for everyone to understand what can be done with Pinescript. We don't have to wait for TradingView to allow screener based on custom indicator - we can build our own ^^
I - What is an engulfing pattern
Let's start with a screener to check for a very famous candlestick pattern called engulfing
Engulfing candles tend to signal a reversal of the current trend in the market. This specific pattern involves two candles with the latter candle ‘engulfing’ the entire body of the candle before it.
The engulfing candle can be bullish or bearish depending on where it forms in relation to the existing trend
Source and more info here
These engulfing candles indicate a strong shift in direction, and when combined with observation of the price-trending direction that precedes it, this shift creates the opportunity for a trading strategy.
II - How did I set the screener
I added an optional filter being Price vs SMA. The idea is to select only the engulfing whenever the price also breaks an SMA - this usually translates a stronger move - but could sometimes give the signal too late (#meh #trading #ain't #easy)
The visual signals are as follow:
- square: whenever the engine detects an engulfing and an SMA breakout
- triangle: the engine only detects an engulfing
- dash: none of the above
Then the colors are:
- orange when bullish
- yellow when bearish
- aqua/dash when none of the above
Cool Hacks
"But sir... what can we do with only 5 instruments for a screener?" I agree not much but...
even if I allow only 5 instruments per indicator - nothing prevents you from adding multiple times the same indicator and changing the selected instruments for each. I also show why the SPX500 gave a yellow triangle (bearish engulfing) and how to match it with the screener.
=> imgur.com
Wishing you all the BEST trading
Dave
Customizable MACD (how to detect a strong convergence)Helloooo traders
I wondered once if a MACD was based on an EMA/EMA/SMA or SMA/SMA/EMA (or WHATEVA/WHATEVA/WHATEVA).
Seems they're so many alternatives out there.
I decided to empower my audience more by choosing the type of moving averages you want for your MACD.
More options doesn't always mean better performance - but who knows - some might find a config that they like with it for their favorite asset/timeframe.
I added also a multi-timeframe component because I'm a nice guy ^^
Convergence is my BEST friend
An oscillator (like MACD) is to measure how strong a momentum is - generally, traders use those indicators to confirm a trend.
So understand that a MACD (or any other indicator not based on convergence ) won't likely be sufficient for doing great on the market.
Combined with your favorite indicator, however, you may get great results.
My indicators fav cocktail is mixing :
1) an oscillator (momentum confirmation)
2) a trendline/key level break (momentum confirmation)
3) adding-up on a different trading method but still converging with the first entry.
The reason I'm deep with convergence detection is because I'm obsessed with removing those fakeout signals. You know which ones I'm talking about :)
Those trades when the market goes sideways but our capital goes South (pun 100% intended) - 2 days later, the price hasn't changed much but some lost some capital due to fees, being overexposed, buying the top/selling the bottom of a range they didn't identify.
It's publicly known that ranges are the worst traders' enemy. It's boring, not fun, and .... end up moving in the direction we expected when we go to sleep or outside.
NO ONE/BROKER/EX-GF is tracking your computer - I checked also for mine as it happened for me way too often in the past.
I surely preferred blaming a few external unknown conditions than improving my TA back in the days #bad #dave
But my backtest sir...
Our backtests show what they're being told to show . A backtest without a stop-loss/hard exit logic will show incredible results.
Then trying that backtest with live trading is like in the Matrix movie - discovering the real world is tough and we must choose between the blue pill (learning how to evaluate properly risk/opportunity caught) and the red pill (increasing the position sizing, not setting a stop loss, holding the positions hoping for the best)
Last few words
Convergences aren't invented because it's cool to mix indicators with others. (it is actually and even fun)
They're created to remove most of the fakeouts . For those that can't be removed - a strong risk management would cut most of the remaining potential big losses.
No system works 100% of the time - so a convergence system needs a back-up plan in case the converged signal is wrong (could be stop-loss, hard exit, reducing position sizing, ...)
Wishing you the BEST and happy beginning of your week
Daveatt

Any MA bands (TMA bands V2)Hi everyone
Website will be opening very shortly :) Sorting out the last details and we're so excited to finally roll-out our different Algorithm Builders for you guys
Forewords
This present script is an evolution of the TMA bands . I would never have expected that script to become so popular to be honest
This is not only a study or idea but a really proven method and I'm glad that many of you are using it already. But please, whenever you see a new script out there, even if it looks cool and promising, please test it on a demo account for a week or on a LIVE account but with tiny amounts every time.
Many times, what you see on the chart is not what will happen in reality. I know that most of you will agree and I know exactly why we see this behavior... I'll give more details in a later post
I have plenty of methods like that one and I'll detail them on my website (and a bit on TradingView) starting next month
TMA bands on steroids
Someone asked me privately to make a generic version of the TMA bands and make it compatible with other standards Moving Average types. That's it for the specifications really as I didn't do much than re-using some piece of my own code
Suggested (but not mandatory) methodology
1) The Take Profit 1 is the middle line, Take Profit 2 is the opposite band.
2) Once the TP1 is hit, set your Stop Loss to breakeven
3) Once the TP2 is hit, if you still want to stay in the trade, set your Stop Loss to the TP1
It will be a powerful tool in your arsenal for some scalp/intraday trades
Wishing you all of you a great and profitable day
PS
It's strictly forbidden to republish this script without my explicit approval. All my posts are copyrighted from now on
Obviously you can use but not republish and get the credit or even worse... some money from your own clients
Dave
____________________________________________________________
Be sure to hit the thumbs up. Building those indicators take a lot of time and likes are always rewarding for me :) (tips are accepted too)
- If you want to suggest some indicators that I can develop and share with the community, please use my personal TRELLO board
- I'm an officially approved PineEditor/LUA/MT4 approved mentor on codementor. You can request a coaching with me if you want and I'll teach you how to build kick-ass indicators and strategies
Jump on a 1 to 1 coaching with me
- You can also hire for a custom dev of your indicator/strategy/bot/chrome extension/python
Disclaimer:
Trading involves a high level of financial risk, and may not be appropriate because you may experience losses greater than your deposit. Leverage can be against you.
Do not trade with capital that you can not afford to lose. You must be aware and have a complete understanding of all the risks associated with the market and trading. We can not be held responsible for any loss you incur.
Trading also involves risks of gambling addiction.
Please notice I do not provide financial advice - my indicators, strategies, educational ideas are intended to provide only some source code for anyone interested in improving their trading
The proprietary indicators and strategies developed by Best Trading Indicator, the object of intellectual property rights are and remain the exclusive property of Best Trading Indicator, at the exclusion of images and videos and texts free of rights or provided by the Company or external legal or physical person.
No assignment of intellectual property rights is carried out through these Terms and Conditions.
Any total or partial reproduction, modification or use of these properties for any reason whatsoever is strictly prohibited without the express written authorization of the Company.
