My Exclusive Support & Resistance Strategyndicator Name:
Market Maker Pro: Multi-TF S&R & Hidden Signals (CALL/PUT)
Description:
This is a professional-grade institutional trading indicator designed to identify "Market Maker" entries by combining Volume-Weighted Average Price (VWAP), EMA Crossovers, and Multi-Timeframe Support & Resistance levels.
The indicator is optimized for traders who seek high-probability entries (CALL/PUT) on any timeframe, from 1-minute scalping to 4-hour swing trading.
Key Features:
Institutional Support & Resistance (4H & 1H): Automatically plots high-impact levels from the 4-hour and 1-hour charts. These appear as short, clean lines (12 bars) to keep the chart clutter-free.
Hidden Market Maker Logic: Uses a background combination of EMA 20 and EMA 50 crossovers, filtered by the VWAP (the "Fair Value" for big banks).
Precision Signals (CALL/PUT): * CALL Signal: Triggered only when EMA 20 crosses above EMA 50 while the price is trading above the VWAP.
PUT Signal: Triggered only when EMA 20 crosses below EMA 50 while the price is trading below the VWAP.
Multi-Timeframe Adaptive: Seamlessly works across all timeframes (1m, 5m, 15m, 1h, 4h).
Visual Confidence: High-visibility labels and background highlights ensure you never miss a confirmed institutional entry.
How to Trade:
Identify the Wall: Look for the thick lines (4H levels) to identify major reversal zones.
Wait for the Signal: Look for the CALL or PUT label.
Confirm with VWAP: The signal only appears if the price is on the correct side of the institutional volume (VWAP), giving you a "Market Maker" edge.
مؤشرات بيل ويليامز

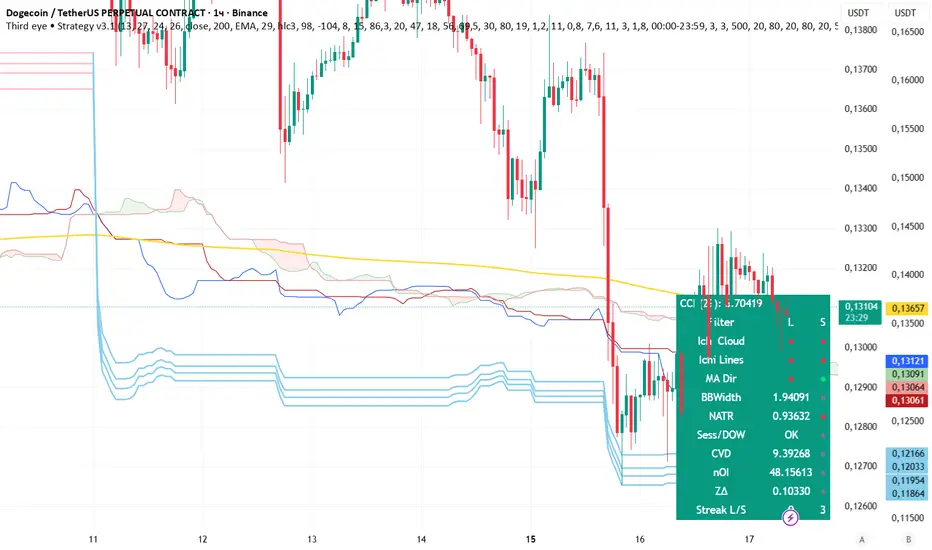
Third eye Strategy v3.1 DogeThird eye • Strategy v3.1 Doge Third eye • Strategy v3.1 Doge Third eye • Strategy v3.1 Doge
Volume MAs Oscillator | Lyro RS// This Pine Script® code is subject to the terms of the Mozilla Public License 2.0 at mozilla.org
// © LyroRS
//@version=6
indicator("Volume MAs Oscillator | Lyro RS")
import LyroRS/LMAs/1 as DynamicMAs
//─────────────────────────────────────────────────────────────────────────────────────────────────────────────
//─██████─────────████████──████████─████████████████───██████████████───────████████████████───██████████████─
//─██░░██─────────██░░░░██──██░░░░██─██░░░░░░░░░░░░██───██░░░░░░░░░░██───────██░░░░░░░░░░░░██───██░░░░░░░░░░██─
//─██░░██─────────████░░██──██░░████─██░░████████░░██───██░░██████░░██───────██░░████████░░██───██░░██████████─
//─██░░██───────────██░░░░██░░░░██───██░░██────██░░██───██░░██──██░░██───────██░░██────██░░██───██░░██─────────
//─██░░██───────────████░░░░░░████───██░░████████░░██───██░░██──██░░██───────██░░████████░░██───██░░██████████─
//─██░░██─────────────████░░████─────██░░░░░░░░░░░░██───██░░██──██░░██───────██░░░░░░░░░░░░██───██░░░░░░░░░░██─
//─██░░██───────────────██░░██───────██░░██████░░████───██░░██──██░░██───────██░░██████░░████───██████████░░██─
//─██░░██───────────────██░░██───────██░░██──██░░██─────██░░██──██░░██───────██░░██──██░░██─────────────██░░██─
//─██░░██████████───────██░░██───────██░░██──██░░██████─██░░██████░░██───────██░░██──██░░██████─██████████░░██─
//─██░░░░░░░░░░██───────██░░██───────██░░██──██░░░░░░██─██░░░░░░░░░░██───────██░░██──██░░░░░░██─██░░░░░░░░░░██─
//─██████████████───────██████───────██████──██████████─██████████████───────██████──██████████─██████████████─
//─────────────────────────────────────────────────────────────────────────────────────────────────────────────
// LyroRS v1.0
// Groups
ma_g = "𝗠𝗢𝗩𝗜𝗡𝗚 𝗔𝗩𝗘𝗥𝗔𝗚𝗘"
bands_g = "𝗕𝗔𝗡𝗗"
display_g = '𝗗𝗜𝗦𝗣𝗟𝗔𝗬'
// Inputs
// -- Moving Average
source = input.source(close, "Source", group= ma_g, tooltip= "Select where the data originates (open, high, low, close, etc..).")
ma_type = input.string("EMA", "Select Moving Average", options= , group=ma_g, tooltip="Choose a moving average type to apply to the price multiplied by volume. VWMA already incorporates volume directly.")
ma_length = input.int(30, "Moving Average Length", group= ma_g, tooltip= "Defines the length or period of the selected moving average.")
// -- Bands
band_length = input.int(27, "Band Length", group=bands_g, tooltip="Number of bars used to calculate standard deviation.")
band_smoothing = input.float(0.8, "Band Smoothing", group=bands_g, minval=0, tooltip="Smooths the band edges to reduce noise.")
pbm = input.float(1.8, "Positive Band Multiplier", group=bands_g, minval=0, tooltip="Multiplier for the upper band distance.")
nbm = input.float(-0.85, "Negative Band Multiplier", group=bands_g, maxval=0, tooltip="Multiplier for the lower band distance.")
// Color Inputs
signal_type = input.string("Trend", "Select Signal Type", options= , group=display_g, tooltip="Select which way to use the indicator.")
ColMode = input.string("Mystic", "Custom Color Palette", inline="drop", options= , display=display.none, group= display_g, tooltip="Select a predefined color scheme for the indicator display. (Major Themes color mode automatically switches colors based on the major asset you picked for valuation analysis.)")
cpyn = input.bool (true, "Use Custom Palette", group= display_g, display=display.none, tooltip="Enables custom color selection for signals.")
cp_UpC = input.color (#00ff00, "Custom Up", inline = "Custom Palette", group= display_g, display=display.none, tooltip="")
cp_DnC = input.color (#ff0000, "Custom Down", inline = "Custom Palette", group= display_g, display=display.none, tooltip="User specifed bullish and bearish colors.")
d_obos_sigs = input.bool (true, "Display Oversold/Overbought Signs", group= display_g, display=display.none, tooltip="Enables triangle signs to be displayed.")
d_signs = input.bool (true, "Display Signs", group= display_g, display=display.none, tooltip="Enables signs for Trend mode.")
d_bgcol = input.bool (true, "Display Background Color", group= display_g, display=display.none, tooltip="Enables background color for Reversion & Valuation mode.")
// Colors
color UpC = na
color DnC = na
// -- Predefined Colors
switch ColMode
"Classic" =>
UpC := #00E676
DnC := #880E4F
"Mystic" =>
UpC := #30FDCF
DnC := #E117B7
"Accented" =>
UpC := #9618F7
DnC := #FF0078
"Royal" =>
UpC := #FFC107
DnC := #673AB7
// -- Custom Colors
if cpyn
UpC := cp_UpC
DnC := cp_DnC
// Coloring Function for Valuation
coloring(src) =>
color.from_gradient(src, ta.lowest(src, band_length), ta.highest(src, band_length), UpC, DnC)
// Moving Average Switch
float ma = na
switch ma_type
"SMA" => ma := DynamicMAs.SMA(source * volume, ma_length) / DynamicMAs.SMA(volume, ma_length)
"EMA" => ma := DynamicMAs.EMA(source * volume, ma_length) / DynamicMAs.EMA(volume, ma_length)
"WMA" => ma := DynamicMAs.WMA(source * volume, ma_length) / DynamicMAs.WMA(volume, ma_length)
"VWMA" => ma := DynamicMAs.VWMA(source, volume, ma_length) // Already Volume Based MA
"DEMA" => ma := DynamicMAs.DEMA(source * volume, ma_length) / DynamicMAs.DEMA(volume, ma_length)
"TEMA" => ma := DynamicMAs.TEMA(source * volume, ma_length) / DynamicMAs.TEMA(volume, ma_length)
"RMA" => ma := DynamicMAs.RMA(source * volume, ma_length) / DynamicMAs.RMA(volume, ma_length)
"HMA" => ma := DynamicMAs.HMA(source * volume, ma_length) / DynamicMAs.HMA(volume, ma_length)
"LSMA" => ma := DynamicMAs.LSMA(source * volume, ma_length, 0) / DynamicMAs.LSMA(volume, ma_length, 0)
"SMMA" => ma := DynamicMAs.SMMA(source * volume, ma_length) / DynamicMAs.SMMA(volume, ma_length)
"ALMA" => ma := DynamicMAs.ALMA(source * volume, ma_length, 0, 20) / DynamicMAs.ALMA(volume, ma_length, 0, 20)
"ZLSMA" => ma := DynamicMAs.ZLSMA(source * volume, ma_length) / DynamicMAs.ZLSMA(volume, ma_length)
"FRAMA" => ma := DynamicMAs.FRAMA(source * volume, ma_length) / DynamicMAs.FRAMA(volume, ma_length)
"KAMA" => ma := DynamicMAs.KAMA(source * volume, ma_length) / DynamicMAs.KAMA(volume, ma_length)
"JMA" => ma := DynamicMAs.JMA(source * volume, ma_length, 0) / DynamicMAs.JMA(volume, ma_length, 0)
"T3" => ma := DynamicMAs.T3(source * volume, ma_length, 0.5) / DynamicMAs.T3(volume, ma_length, 0.5)
price_diff = ((source - ma) / ma) * 100 // Percentage Difference between Source and the Moving Average of the source
// Calculations for the Bands
std = ta.stdev(price_diff, band_length)
upperBandRaw = std * pbm
lowerBandRaw = std * nbm
var float upperBand = na
var float lowerBand = na
// Smooth
upperBand := upperBandRaw * band_smoothing + nz(upperBand ) * (1 - band_smoothing)
lowerBand := lowerBandRaw * band_smoothing + nz(lowerBand ) * (1 - band_smoothing)
// Plot Color
var color pc = na
var color uB_color = na
var color lB_color = na
var int signal = 0
if signal_type == "Trend"
uB_color := UpC
lB_color := DnC
if price_diff > upperBand
pc := UpC
signal := 1
if price_diff < lowerBand
pc := DnC
signal := -1
if signal_type == "Reversion"
uB_color := DnC
lB_color := UpC
if price_diff > upperBand
pc := DnC
signal := -1
else if price_diff < lowerBand
pc := UpC
signal := 1
else
pc := color.gray
signal := 0
if signal_type == "Valuation"
uB_color := UpC
lB_color := DnC
pc := coloring(price_diff)
// Plot
plot(price_diff, color= pc, linewidth = 2, title= "Volume MAs Oscillator")
plot(upperBand, color= color.new(uB_color, 50), title= "Upper Band")
plot(lowerBand, color= color.new(lB_color, 50), title= "Lower Band")
plot(0, color= color.new(pc, 60), linewidth = 2, display= display.pane, title= "Mid Line")
plot(0, color= color.new(pc, 75), linewidth = 5, display= display.pane, title= "Mid Line Glow 1")
plot(0, color= color.new(pc, 85), linewidth = 10, display= display.pane, title= "Mid Line Glow 2")
plotchar(upperBand + 0.5, char='▼', color= ta.crossunder(price_diff, upperBand) ? DnC : na, location=location.absolute, title= "Overbought Signal", display= d_obos_sigs ? display.pane : display.none, size= size.tiny)
plotchar(lowerBand - 0.5, char='▲', color= ta.crossover(price_diff, lowerBand) ? UpC : na, location=location.absolute, title= "Oversold Signal", display= d_obos_sigs ? display.pane : display.none, size= size.tiny)
reversion_enable = signal_type == "Reversion"
valuation_enable = signal_type == "Valuation"
bgcolor(d_bgcol and ((valuation_enable and price_diff > upperBand) or (reversion_enable and ta.crossunder(price_diff, upperBand))) ? color.new(DnC, 85) : na, title= "BG Color OB")
bgcolor(d_bgcol and ((valuation_enable and price_diff > upperBand) or (reversion_enable and ta.crossunder(price_diff, upperBand))) ? color.new(DnC, 85) : na, title= "BG Color OB Overlay", force_overlay = true)
bgcolor(d_bgcol and ((valuation_enable and price_diff < lowerBand) or (reversion_enable and ta.crossover(price_diff, lowerBand))) ? color.new(UpC, 85) : na, title= "BG Color OS")
bgcolor(d_bgcol and ((valuation_enable and price_diff < lowerBand) or (reversion_enable and ta.crossover(price_diff, lowerBand))) ? color.new(UpC, 85) : na, title= "BG Color OS Overlay", force_overlay = true)
plotshape(ta.crossover(signal, 0), title="Buy Signal", location=location.belowbar,
style=shape.labelup, text="𝓛𝓸𝓷𝓰", textcolor=#000000, size=size.small,
color=UpC, force_overlay=true, display= signal_type == "Trend" and d_signs == true ? display.pane : display.none)
plotshape(ta.crossunder(signal, 0), title="Sell Signal", location=location.abovebar,
style=shape.labeldown, text="𝓢𝓱𝓸𝓻𝓽", textcolor=#000000, size=size.small,
color=DnC, force_overlay=true, display= signal_type == "Trend" and d_signs == true ? display.pane : display.none)
plotcandle(open, high, low, close, color= pc, wickcolor = pc, bordercolor = pc, force_overlay = true, display= display.pane, title= "Plot Candle")
barcolor(pc, title= "Barcolor")
// ==========================================================================================
// === Dashboard with Telegram Link ===
var table myTable = table.new(position.top_center, 1, 1, border_width=1, frame_color=color.black, bgcolor=color.white)
// Add Telegram Message to Dashboard
table.cell(myTable, 0, 0, "Join Telegram @mrexpert_ai", bgcolor=color.blue, text_color=color.white, text_size=size.normal)

Third eye Strategy v3.1Third eye Strategy v3.1 DogeThird eye Strategy v3.1 DogeThird eye Strategy v3.1 Doge

Borna's Zones NY Borna's Zones marks two important time-based zones on the chart: the 08:00 zone and the 09:00 zone.
The 14:00 zone identifies initial liquidity. This zone sets the range where early market participants create significant activity.
The 15:00 zone serves as a reference for confirmation. After 15:00, the indicator helps you identify whether the 14:00 zone should be considered cleared.
Both zones are automatically extended until 17:00, providing clear visual references for potential market reactions.
No trading is recommended after 17:00, as the early morning zones lose relevance.
This indicator is useful for traders who focus on pre-market and early session liquidity, helping to visualize key levels where price may react.

changekon.com_VolatileIndicatorIndicator Description
This custom indicator is a hybrid trend and volatility-based tool designed to identify potential buy and sell zones in the market. It combines multiple moving average methodologies and volatility analysis to provide more reliable trading signals.
The indicator integrates Simple Moving Average (SMA), Exponential Moving Average (EMA), and Running Moving Average (RMA) to capture both short-term momentum and longer-term trend direction. By blending these averages, the indicator reduces the lag and noise commonly associated with using a single moving average.
In addition, Bollinger Bands are used to measure market volatility and identify overbought and oversold conditions. The width and interaction of price with the bands help assess whether the market is in a trending or ranging state.
A volatility filter is applied to avoid low-quality signals during low-volatility or choppy market conditions. Buy signals are generated when price action aligns with bullish trend confirmation and favorable volatility conditions. Conversely, sell signals are triggered when bearish trend criteria and volatility confirmation are met.
Overall, this indicator is designed to improve signal accuracy by combining trend strength, momentum, and volatility into a single decision-making framework, making it suitable for both trend-following and breakout trading strategies.

changekon.com_VolatileMarket_como_stochRsi_both_sideBBIndicatorIndicator Description
This custom indicator is a hybrid trend and volatility-based tool designed to identify potential buy and sell zones in the market. It combines multiple moving average methodologies and volatility analysis to provide more reliable trading signals.
The indicator integrates Simple Moving Average (SMA), Exponential Moving Average (EMA), and Running Moving Average (RMA) to capture both short-term momentum and longer-term trend direction. By blending these averages, the indicator reduces the lag and noise commonly associated with using a single moving average.
In addition, Bollinger Bands are used to measure market volatility and identify overbought and oversold conditions. The width and interaction of price with the bands help assess whether the market is in a trending or ranging state.
A volatility filter is applied to avoid low-quality signals during low-volatility or choppy market conditions. Buy signals are generated when price action aligns with bullish trend confirmation and favorable volatility conditions. Conversely, sell signals are triggered when bearish trend criteria and volatility confirmation are met.
Overall, this indicator is designed to improve signal accuracy by combining trend strength, momentum, and volatility into a single decision-making framework, making it suitable for both trend-following and breakout trading strategies.

Advanced ORB Strategy v6 (Time-Based Fix)/Once the window closes, the market has drawn its first meaningful line in the sand. A break above the opening range high signals that early sellers are trapped and buyers are pressing. A break below the opening range low signals the opposite. Trades are only considered after price leaves the range and shows acceptance, not on the first tick outside.
Risk is defined and limited by the range itself. Stops are placed back inside the opening range, which keeps losses small and predefined. Targets are based on objective market references such as overnight highs and lows, VWAP extensions, or prior session levels—not arbitrary profit goals.
This strategy is not predictive. It does not try to forecast direction or call tops and bottoms. It responds to real order flow and liquidity behavior as it unfolds. When the market is trending, the strategy captures momentum early. When conditions are choppy or volatility is compressed, trades are filtered out or avoided entirely.
The strength of this approach is its simplicity, repeatability, and risk control. One defined window. One defined range. Clear entry criteria. Clear exits. No overtrading.

EMA 20/50 + RSI Trend Strategy [Clean & Simple]### **Title: EMA 20/50 + RSI Trend Strategy **
**Description:**
This is a pure trend-following strategy designed for Crypto intraday trading. It combines **EMA Crossovers** (for trend direction) with **RSI** (for momentum confirmation) to filter out choppy markets and false signals.
**1. Core Logic**
The strategy only signals an entry when both the Trend and Momentum are aligned:
* **Trend Filter:** Uses EMA 20 and EMA 50.
* **Momentum Filter:** Uses RSI (Length 14) with a baseline of 50.
**2. Signal Conditions**
* **🟢 LONG Signal:**
* Price Trend: EMA 20 is **ABOVE** EMA 50.
* Momentum: RSI is **ABOVE** 50.
* **🔴 SHORT Signal:**
* Price Trend: EMA 20 is **BELOW** EMA 50.
* Momentum: RSI is **BELOW** 50.
**3. Visual Features**
* **Bar Coloring:**
* **Green Bars:** Strong Bullish Trend (Long conditions met).
* **Red Bars:** Strong Bearish Trend (Short conditions met).
* **Gray Bars:** Neutral/Choppy Market (Stay aside).
* **Labels:** "LONG" and "SHORT" labels appear on the chart when the market state changes.
**4. Recommended Usage**
* **Timeframe:** Works best on **15m** (Scalping) or **1H** (Day Trading).
* **Assets:** High volatility pairs like BTCUSDT, ETHUSDT, SOLUSDT.
* **Strategy Tip:** Do not enter blindly on every signal. Wait for a pullback to the EMA 20/50 lines while the bar color remains Green/Red for the highest win rate.
**5. Alerts**
* This script supports TradingView alerts. You can set up alerts for "LONG Signal" and "SHORT Signal" in the alert menu.

MAX TRADE (PRO)MAX TRADE (PRO) is a professional-grade TradingView indicator designed to deliver clean, high-quality BUY/SELL signals with a premium visual layout and clear risk management on the chart.

UK Public Oneside V2This strategy combines RSI, Stochastic Oscillator, and a 50 EMA trend filter to identify moderate-risk trading opportunities in trending markets.
How it works:
Long entries occur when RSI and Stochastic are in oversold conditions while price is above the 50 EMA.
Short entries occur when RSI and Stochastic are in overbought conditions while price is below the 50 EMA.
Trades are confirmed on the previous candle, avoiding premature entries and exits.
Risk management is handled using fixed percentage stop-loss with configurable risk-to-reward targets.
Optional RSI-based exits close positions early during overbought or oversold conditions.
Key Features:
Trend-filtered entries using EMA 50
Non-repainting logic (confirmed candle signals)
Configurable stop-loss and reward ratio
Works well for scalping and intraday trading
Suitable for crypto, forex, and indices
Recommended Timeframes:
5m, 15m, 30m
Note:
This strategy is designed for educational and research purposes. Always forward-test and apply proper risk management before using in live trading.

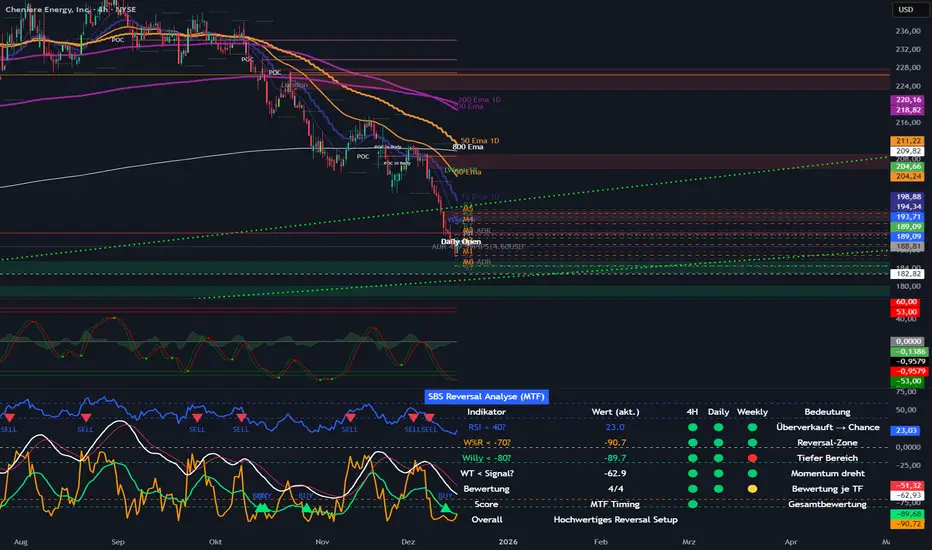
SBS Reversal Engine MTFSBS Reversal Engine (MTF) is a professional multi-timeframe indicator designed to identify high-quality reversal zones across stocks, crypto, and indices.
It combines RSI, Williams %R, a smoothed Williams oscillator ("Willy"), and a proprietary WaveTrend momentum filter to evaluate market conditions across 4H, Daily, and Weekly timeframes.
A visual traffic-light system provides a clear overview of oversold conditions, momentum shifts, and multi-timeframe alignment.
The integrated MTF Score System helps traders focus on high-quality setups where market structure, context, and timing align.
This indicator is an analytical tool and does not constitute financial advice.
© Step Buy Step 2025 – All rights reserved
UK Public OnesideRSI + Stochastic V1 (Moderate) Strategy
This strategy combines RSI, Stochastic Oscillator, and a 50 EMA trend filter to identify moderate-risk trading opportunities in trending markets.
How it works:
Long entries occur when RSI and Stochastic are in oversold conditions while price is above the 50 EMA.
Short entries occur when RSI and Stochastic are in overbought conditions while price is below the 50 EMA.
Trades are confirmed on the previous candle, avoiding premature entries and exits.
Risk management is handled using fixed percentage stop-loss with configurable risk-to-reward targets.
Optional RSI-based exits close positions early during overbought or oversold conditions.
Key Features:
Trend-filtered entries using EMA 50
Non-repainting logic (confirmed candle signals)
Configurable stop-loss and reward ratio
Works well for scalping and intraday trading
Suitable for crypto, forex, and indices
Recommended Timeframes:
5m, 15m, 30m
Note:
This strategy is designed for educational and research purposes. Always forward-test and apply proper risk management before using in live trading.

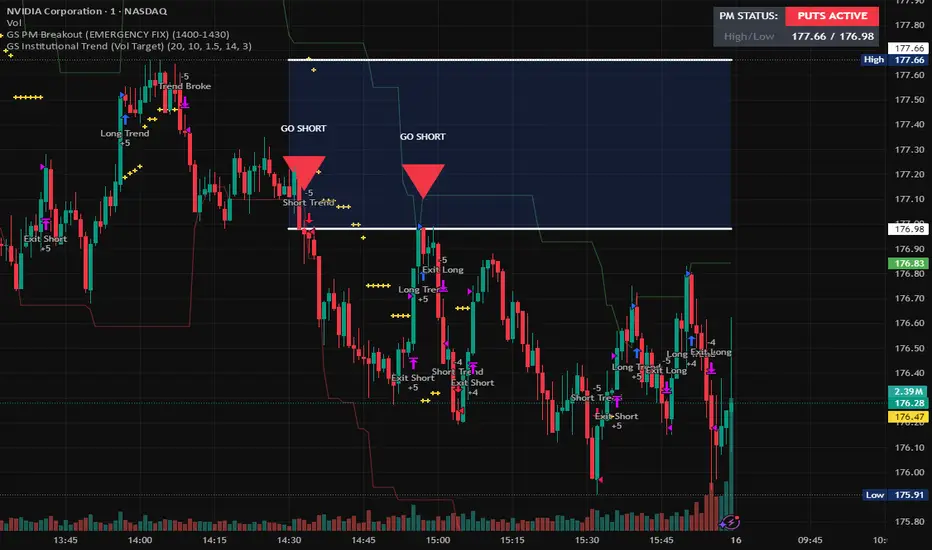
GS Institutional Trend (Vol Target)hedge fund strategy used on a 4 hour chart with a purple bar warning to signal dangerous volitilaty. this strategy will lose money in choppy sideways markets.
SMC Market Structure with EMA Confirmation and Prepare EntryDewaSMC v1 — Smart Market Structure with Prepare Entry & EMA Confirmation
DewaSMC v1 is a technical analysis indicator based on market structure concepts, designed to help traders visually analyze price behavior in a structured and objective way. This indicator focuses on identifying structural changes in the market and highlighting areas of interest where price reactions may occur.
It is intended as an analytical support tool, not as an automated trading system or a signal service
🔹 Key Features
1. Market Structure Detection (BOS & CHoCH)
• Identifies Break of Structure (BOS) and Change of Character (CHoCH) using swing high and swing low analysis.
• Break confirmation can be configured to use candle body or wick.
• Structure levels are visualized with lines and clear BOS / CHoCH labels directly on the chart.
2. Prepare Entry Zones
• Displays prepare entry zones when price approaches an important structure level but has not yet confirmed a break.
• These zones help users monitor potential setups without entering prematurely.
• Prepare zones are temporary and automatically disappear after a defined number of bars or once a structure break occurs.
3. EMA Confirmation Filter
• Uses short-term and long-term EMAs as directional filters.
• Optional confirmation modes:
o Price relative to EMA
o EMA alignment (short EMA above/below long EMA)
• This filter is designed to reduce counter-structure or counter-trend scenarios.
4. Volatility-Based Target Projection
• After a confirmed structure break, the indicator projects:
o Entry level
o Stop Loss level
o Multiple target levels (TP1, TP2, TP3)
• Targets are calculated using ATR-based volatility logic, allowing adaptability to different market conditions.
• Risk and reward areas are displayed as visual zones for clarity.
5. Trade Information Table
• A real-time information table summarizes key analytical data, including:
o Structural direction
o Entry level
o Stop Loss
o Target levels
o EMA confirmation status
o Estimated Risk-to-Reward ratio
• Table position is fully customizable on the chart.
6. Trend Visualization
• Candles can be colored based on current market structure direction.
• EMAs are plotted as additional trend references.
⚙️ Customizable Settings
• Structure detection period
• Break confirmation type (Body or Wick)
• Enable / disable:
o Prepare Entry zones
o EMA confirmation
o Trade information table
o Trend-based candle coloring
• Visual customization options for colors and layout
📌 Important Notes
• This indicator does not provide financial advice and does not guarantee any specific outcome.
• It should be used in combination with:
o Personal risk management rules
o Additional technical or contextual analysis
• All trading decisions remain the responsibility of the user.
🎯 Suitable For
• Traders studying market structure or Smart Money–style concepts
• Manual analysis on various instruments and timeframes
• Users seeking a structured and visual approach to price analysis

ORB Algo⚡ ORB Strategy + Backtesting (Pine Script v5)
This script implements a complete Opening Range Breakout (ORB) strategy, featuring built-in backtesting, advanced TP/SL visualization, full style customization, and a performance dashboard. It is designed for traders who want to clearly evaluate breakout performance directly on the chart.
🕑 ORB Window Configuration
🔹 Session selection: choose between Market Timezone or Custom Session.
🔹 Timezone support: configurable from UTC-8 to UTC+12.
🔹 Daily limit: option to allow only one trade per day.
🔹 Risk/Reward (RR) settings:
Configurable TP1, TP2, and TP3 levels.
Stop Loss calculated dynamically from the ORB range.
📊 Backtesting Engine
🔹 Interactive dashboard showing trades, wins, losses, and win rate.
🔹 Adjustable partial exits for each TP (TP1, TP2, TP3).
🔹 Automatic calculation of percentage-based profit and loss.
🔹 Tracks total trades, total profit, and average profit per trade.
🎨 Visual Customization
🔹 Fully customizable colors:
ORB high/low lines and range fill.
Buy/Sell entry labels.
TP and SL lines with background zones.
🔹 Line style and thickness options (solid, dotted, dashed).
🔹 Visibility controls for each TP/SL level.
🔹 Clear profit and loss zones drawn directly on the chart.
🚀 Trading Logic
🔹 LONG entries: triggered when price breaks above the ORB high.
🔹 SHORT entries: triggered when price breaks below the ORB low.
🔹 Automatic calculation of Stop Loss and TP1, TP2, TP3 based on ORB range and RR.
🔹 Customizable BUY / SELL labels displayed at entry.
✅ TP / SL Detection
🔹 Real-time detection of TP1, TP2, TP3, and SL hits.
🔹 Prevents double counting of the same level.
🔹 Extended TP/SL lines with shaded zones for better clarity.
📈 Backtesting Dashboard
🔹 Displayed in the top-right corner of the chart.
🔹 Shows:
Total trades
Wins / Losses
Win rate (%)
Total profit (%)
Average profit per trade
🔹 Fully customizable panel color.
✨ Summary
This script combines:
Opening Range detection
Breakout trading logic with advanced risk management
Professional-grade visualizations
Integrated historical performance tracking
High customization for sessions, styles, and colors
💡 Ideal for traders who want to trade ORB setups with clarity, structure, and measurable results.


Volume Orderblock Breakout v3.6this is indicator that shows long short siganl and tp lines can be checked.
you can get profit by this forever.
we can win over whales
keep going don't give up!!!

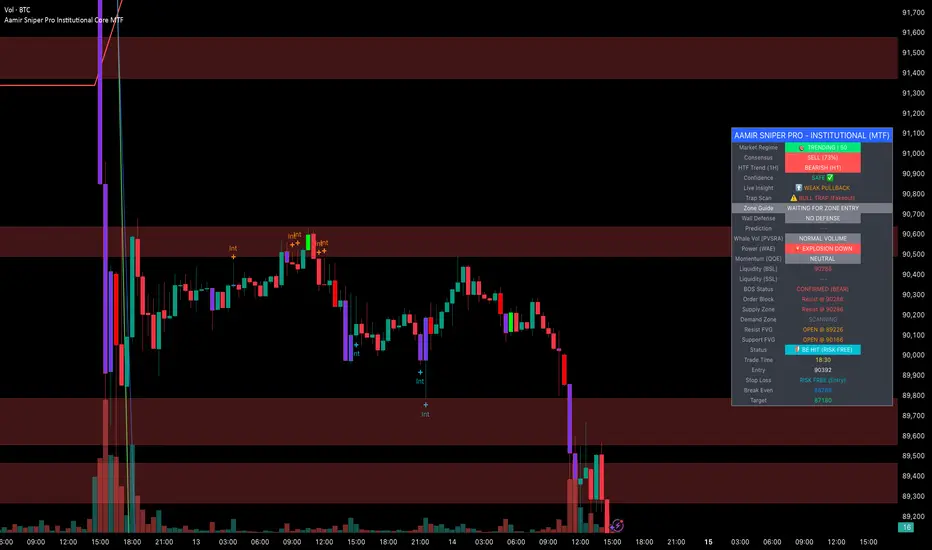
Aamir Sniper Pro Institutional Core MTFConcept & Utility: This script is a comprehensive "Multi-Factor Confluence System" designed to filter out market noise by requiring agreement between Trend, Momentum, Volatility, and Market Structure before generating a signal.
Many traders struggle with false signals generated by single indicators. This script solves that problem by using a Consensus Engine. Instead of relying on just one moving average or oscillator, this script aggregates data from over 20 different technical methods. It then applies strict filters (WAE, ADX, and MTF) to ensure that trades are only suggested during high-probability market conditions.
How the Components Work Together:
1. The Consensus Engine (The Core Logic): At the heart of the script is a voting system. It calculates the slope and direction of:
Fast/Slow EMAs, SMAs, WMAs, and Hull MA.
Ichimoku Cloud (Baseline/Conversion line).
SuperTrend and Parabolic SAR.
Oscillators (RSI, Stochastic, CCI).
Result: It generates a "Consensus Score" (0-100%). A signal is ONLY considered if the Bullish or Bearish score exceeds the user-defined threshold (Default: 70%).
2. The Filtering Layers (Why this is not just a mashup): A high consensus score alone is not enough. The script validates the signal through three mandatory filters:
Volatility Filter (WAE): Uses Waddah Attar Explosion logic to ensure there is enough volume/power to sustain the move.
Regime Filter (ADX): Checks the Average Directional Index. If the market is choppy (ADX < 25), the signal is blocked to prevent whipsaws.
MTF Filter: Checks the trend on a Higher Timeframe (Default: 1 Hour). It forces the user to trade only in the direction of the dominant trend.
3. Structural Context (SR Zones): We have integrated Dynamic Support & Resistance Zones based on Pivot Points.
Purpose: This provides immediate structural context. Even if the Consensus Engine gives a "BUY" signal, the trader can see if price is currently sitting at a "Resistance Box." This visual aid prevents buying into supply or selling into demand.
4. Institutional Volume (PVSRA): Candles are colored based on Volume Spread Analysis (PVSRA) concepts.
Purple/Blue Candles: Indicate "Whale Activity" (Volume > 200% of average). This helps confirm if institutional money is backing the move identified by the Consensus Engine.
5. Momentum Confirmation (QQE): The Qualitative Quantitative Estimation (QQE) is displayed on the dashboard to confirm short-term momentum direction, acting as the final trigger.
Features:
Sniper Mode: Option to wait for a candle retest before entry.
Dashboard: Displays the live Consensus Score, Market Regime, and Trend Status.
Risk Management: Auto-calculates SL/TP based on Swing High/Low or ATR.
Credits & Attribution:
WAE Logic: Adapted from the work of Waddah Attar.
PVSRA: Volume concepts adapted from the Traderathome/PVSRA community.
QQE: Adapted from standard open-source logic.
SR Zones: Logic derived from standard Pivot Point calculations.
Programmers Toolbox of ta LibraryA programmer's "Swiss army knife" for selecting functions from the " ta Library by Trading View " during coding. Illustrates the results of the individual library functions. Adds a few extra features. Extensively and uniquely documented.

AJ Super Blast SignalsPrice action trading script suited for all TF, it will work on all instruments NIFTY/ BANK NIFTY/COMMODITY/SENSEX/ MIDCAP NIIFTY AND CRYPTOCURRENCY....IT HELPS TO AVOID SIDEWAYS MARKET SIGNALS WHICH PREVIOUS SCRIPTS DOESNT DO

Estrategia_XAU_1m_NYEstrategia para el par XAU/USD temporalidad 1 minuto, de 9:30 a 10:00 am New York. Solo media hora al dia.
Strategy for the XAU/USD pair, 1-minute timeframe, from 9:30 to 10:00 am New York. Only half an hour per day.

XAUUSD [MAX]XAUUSD (Gold) M1 indicator based on Support/Resistance (pivot S/R) + classic price action confirmation.
• Designed for XAUUSD on the 1-minute timeframe
• Alternating signals only: BUY → SELL → BUY → SELL
• No new signal while a trade is active (waits until TP or SL is hit)
• Fixed targets: SL = 20 pips, TP = 100 pips (pipSize adjustable in settings)
• Filters: EMA trend + optional RSI filter + S/R touch logic
Note: This script is for educational/testing purposes. Always use proper risk management.
