Binary Options Strategy 1-5-15-30-90 Sec & Min [TradingFinder]🔵 Introduction
Market behavior is not defined by randomness, but by order positioning, structural pressure, and directional imbalance. Every expansion or rejection in price is the result of how the market distributes orders around critical structural areas. These reactions become visible only when price reaches zones where participation and exposure are at their highest.
Price naturally migrates toward areas of unfinished business, levels where previous moves left behind unfilled orders or weak structure. When these areas are reached, the market often produces a temporary structural violation, creating the appearance of continuation while internally transitioning to the opposite side.
These brief violations are not failures of structure; they are transitional events. Their purpose is to exhaust one side of the market, absorb remaining orders, and prepare price for a directional response. Once this process is complete, price tends to react sharply as balance is restored and a new directional phase begins.
Reactions frequently originate from price inefficiencies and institutional positioning zones, where rapid movement previously occurred without sufficient interaction. When price revisits these areas after a structural trap, it often delivers decisive and controlled responses.
This screener is designed to detect these transition moments, when structural pressure, order absorption, and directional intent align. By isolating these conditions across multiple symbols, it converts complex market mechanics into clear, actionable structural signals, allowing traders to focus on moments where price behavior reflects intention rather than noise.
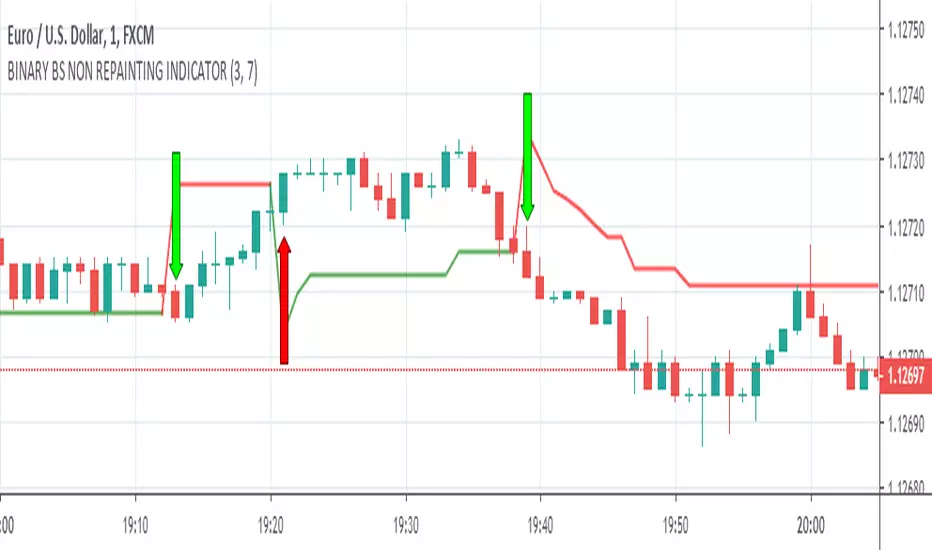
Bullish Signal :
Bearish Signal :
🔵 How to Use
This screener is built to identify structural reaction points where the market completes a directional phase and begins a new one. Instead of tracking price continuously, it scans for moments when pressure, exhaustion, and response converge at key structural locations.
The output of the screener should be treated as a filter, not a final decision. Each flagged symbol highlights a scenario where price behavior suggests a potential directional response. Traders are expected to confirm context, execution timing, and risk parameters on the chart before entering a position.
🟣 Long Setup
A bullish scenario is detected when price transitions from a downward phase into an area where sell pressure weakens and absorption occurs. This typically happens after price extends below recent structural lows, reaching a zone where downside continuation becomes inefficient.
In this region, price often shows signs of failed continuation. The market temporarily pushes lower but lacks follow-through, indicating that selling interest is being absorbed. Shortly after, price stabilizes and begins to react upward from a structurally sensitive area.
When the screener identifies this sequence, downward expansion, structural failure, and upward reaction, it flags the symbol as a potential long opportunity.
This condition reflects a shift from distribution to accumulation, where downside momentum is exhausted and buying pressure starts to dominate. For execution-based strategies, the optimal entry usually occurs shortly after the market confirms the reaction and begins to move away from the structural zone.
🟣 Short Setup
A bearish scenario is detected when price advances into an area where buy pressure becomes overstretched and upward continuation loses efficiency. This often occurs after price trades above recent structural highs, entering a zone where aggressive buying is met with strong opposing interest.
In these areas, price frequently produces a temporary expansion higher followed by hesitation or rejection. The inability to sustain movement above the level signals that buying momentum is being absorbed and that the market is preparing for a directional shift.
When the screener detects upward extension followed by structural weakness and downside response, it flags the symbol as a potential short opportunity.
This setup represents a transition from accumulation to distribution, where control shifts from buyers to sellers. The most effective execution window typically appears immediately after price confirms rejection and starts moving away from the upper structural zone, as reactions tend to be fast and decisive once the transition completes.
🔵 Settings
Swing Period : Determines how many candles are used to identify structural turning points such as swing highs and swing lows. Higher values increase accuracy but reduce the number of signals.
Signal Type : Specifies the type of signal generated by the indicator. The option All shows every signal, Main Signal displays only the primary one, and Alternative Signal produces a secondary signal that appears one candle after the main signal for additional confirmation.
Candle Pattern : Enables candle pattern logic for reversal confirmation. When active, the indicator issues a signal only when a valid candle formation confirms the market reaction.
Candle LookBack Check : Verifies that the last few candles move in the opposite direction of the signal to be generated. This condition acts as a confirmation filter, ensuring that the signal appears only after a clear counter-move in price.
Last Candle Direction : Considers the direction of the most recent candle in the analysis. It helps determine whether the final candle moves with or against the current trend.
Last Candle Shadow Ratio : Sets the ratio between the last candle’s wick and body to refine confirmation accuracy. Higher values require longer wicks, indicating stronger rejection and a more reliable reversal pattern.
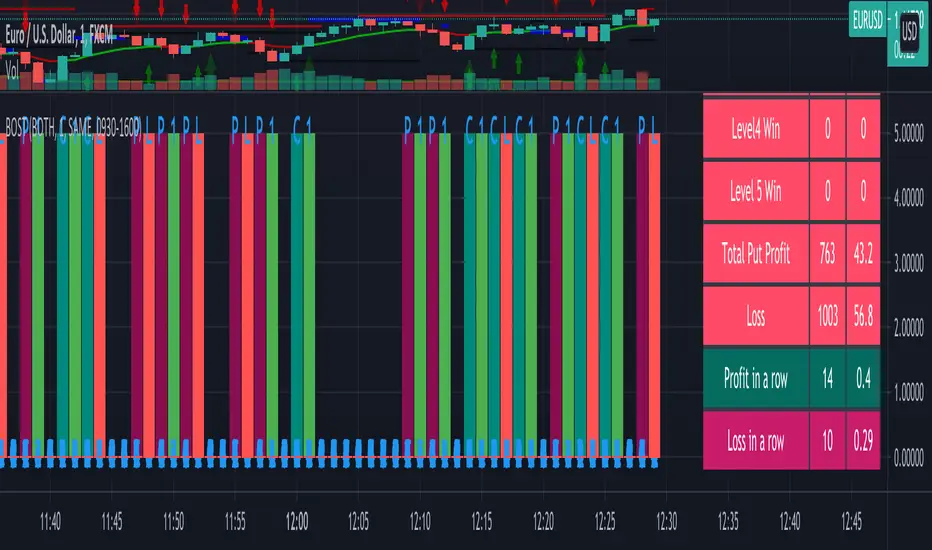
Table on Chart : This setting enables or disables the on chart screener table. When enabled, the table displays signal status, correlation information, and symbol data directly on the chart. When disabled, the chart remains clean with no table overlay.
Number of Symbols : This option controls how many symbol pairs are displayed in the screener table. Users can choose between four or six pairs depending on screen size and personal preference.
Table Size : This setting adjusts the visual scale of the screener table. Smaller sizes are suitable for minimal layouts, while larger sizes improve readability when monitoring multiple pairs simultaneously.
Table Mode : This setting offers two layout styles for the signal table.
Basic mode displays symbols in a single vertical column, using more vertical space and providing straightforward readability.
Extended mode arranges symbols in pairs side by side, optimizing screen space with a more compact and efficient layout.
Table Position : This option defines where the screener table is placed on the chart. The table can be positioned in any corner or central area to avoid overlapping with price action or other indicators.
🔵 Conclusion
Markets move through a continuous cycle of expansion, exhaustion, and response. Understanding this cycle requires more than observing price direction; it demands recognizing where pressure builds, where it fails, and where control shifts from one side of the market to the other.
This screener is designed to isolate those moments of transition. By filtering symbols based on structural interaction, absorption, and reaction, it highlights situations where price behavior reflects intentional movement rather than random fluctuation. Instead of reacting to every candle or chasing momentum, traders can use this tool to focus on selective, high-quality scenarios where directional probability improves due to completed structural processes.
The true value of this screener lies in its ability to reduce noise, compress complex market mechanics into actionable signals, and support disciplined decision-making. When used with proper context and risk control, it becomes a powerful framework for identifying moments when the market reveals its next directional phase.
Consistency with this approach comes not from frequency, but from patience, confirmation, and a clear understanding of how price transitions between phases. Those who learn to wait for these transitions gain a significant advantage in reading and responding to market behavior.
مؤشر Pine Script®سكربت مدفوع