windowing_taAll Signals Are the Sum of Sines. When looking at real-world signals, you usually view them as a price changing over time. This is referred to as the time domain. Fourier’s theorem states that any waveform in the time domain can be represented by the weighted sum of sines and cosines. For example, take two sine waves, where one is three times as fast as the other–or the frequency is 1/3 the first signal. When you add them, you can see you get a different signal.
Although performing an FFT on a signal can provide great insight, it is important to know the limitations of the FFT and how to improve the signal clarity using windowing. When you use the FFT to measure the frequency component of a signal, you are basing the analysis on a finite set of data. The actual FFT transform assumes that it is a finite data set, a continuous spectrum that is one period of a periodic signal. For the FFT, both the time domain and the frequency domain are circular topologies, so the two endpoints of the time waveform are interpreted as though they were connected together. When the measured signal is periodic and an integer number of periods fill the acquisition time interval, the FFT turns out fine as it matches this assumption. However, many times, the measured signal isn’t an integer number of periods. Therefore, the finiteness of the measured signal may result in a truncated waveform with different characteristics from the original continuous-time signal, and the finiteness can introduce sharp transition changes into the measured signal. The sharp transitions are discontinuities.
When the number of periods in the acquisition is not an integer, the endpoints are discontinuous. These artificial discontinuities show up in the FFT as high-frequency components not present in the original signal. These frequencies can be much higher than the Nyquist frequency and are aliased between 0 and half of your sampling rate. The spectrum you get by using a FFT, therefore, is not the actual spectrum of the original signal, but a smeared version. It appears as if energy at one frequency leaks into other frequencies. This phenomenon is known as spectral leakage, which causes the fine spectral lines to spread into wider signals.
You can minimize the effects of performing an FFT over a noninteger number of cycles by using a technique called windowing. Windowing reduces the amplitude of the discontinuities at the boundaries of each finite sequence acquired by the digitizer. Windowing consists of multiplying the time record by a finite-length window with an amplitude that varies smoothly and gradually toward zero at the edges. This makes the endpoints of the waveform meet and, therefore, results in a continuous waveform without sharp transitions. This technique is also referred to as applying a window.
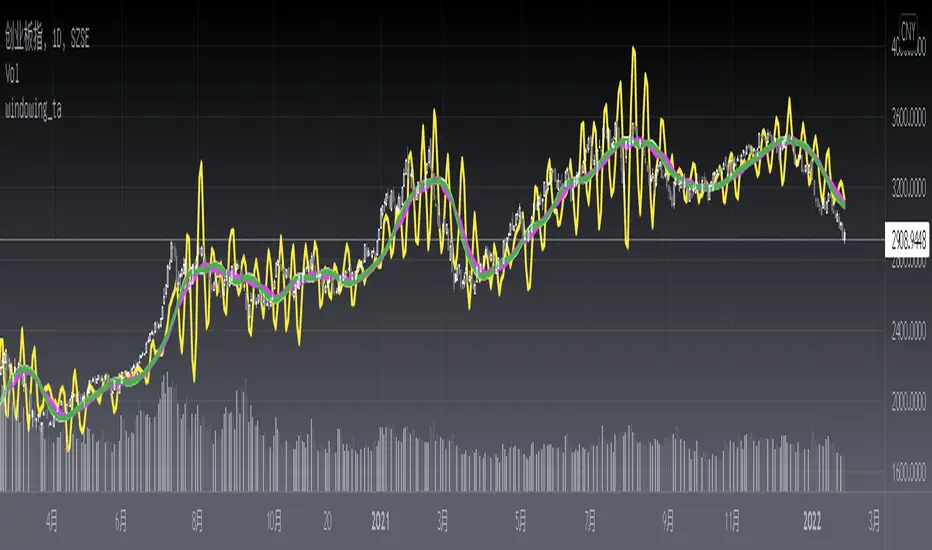
Here is a windowing_ta library with J.F Ehlers Windowing functions proposed on Sep, 2021.
Library "windowing_ta"
hann()
hamm()
fir_sma()
fir_triangle()
Blackcat1402
dc_taAdaptive technical indicators are importants in a non stationary market, the ability to adapt to a situation can boost the efficiency of your strategy. A lot of methods have been proposed to make technical indicators "smarters", the dominant cycle tuned indicators are one of them which are based on J.F.Ehlers theory. Here is a collections of algorithms to calculate dominant cycles. ENJOY!
Library "dc_ta"
bton()
EhlersHoDyDC()
EhlersPhAcDC()
EhlersDuDiDC()
EhlersCycPer()
EhlersCycPer2()
EhlersBPZC()
EhlersAutoPer()
EhlersHoDyDCE()
EhlersPhAcDCE()
EhlersDuDiDCE()
EhlersDFTDC()
EhlersDFTDC2()

interval_taA pine V5 library with several functions to handle time and sessions in trading.
Library "interval_ta"
bton()
tir()
nbs()
ismarket()
isclose()
dow()
tp1_timestamp()
datetime()

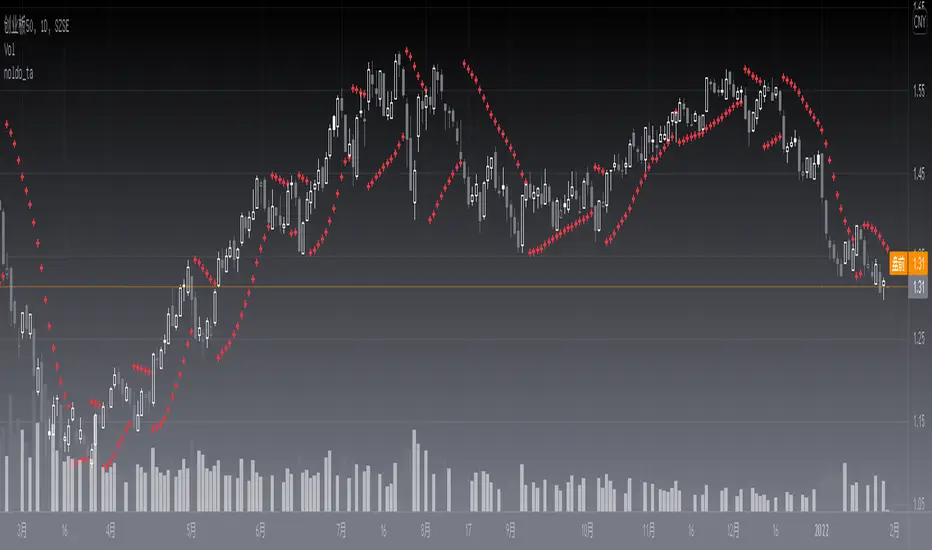
noldo_taI'm a follower of Noldo, and I've learned almost all of his published scripts. I like some of the basic functions he wrote so much that I decided to collect them as a noldo_ta library file to share. Most of these functions are the same as Noldo's version, and there are some interesting algorithmic processing, which I also encapsulated into functions. Enjoy.
COURTESY OF NOLDO for these intersting functions!
Library "noldo_ta"
bton()
f_ema()
f_highest()
f_lowest()
f_rma()
f_rsi()
f_stoch()
f_kdj()
f_sum()
f_sma()
f_stdev()
f_bb()
f_pearson_corr()
f_multiple_corr()
f_adjusted_r_squared()
f_mfi()
dow()
pivothl()
f_adjusted_r_squared2()
linreg()
f_roc()
f_macd()
f_mom()
f_wma()
f_hull()
f_vwma()
f_obv()
f_sar()
f_stochastic()
f_stochrsi()
f_stochmfi()
f_kst()
f_smahist()
f_emahist()
f_fisher()
f_ao()
f_accdist()
f_highestbars()
f_lowestbars()
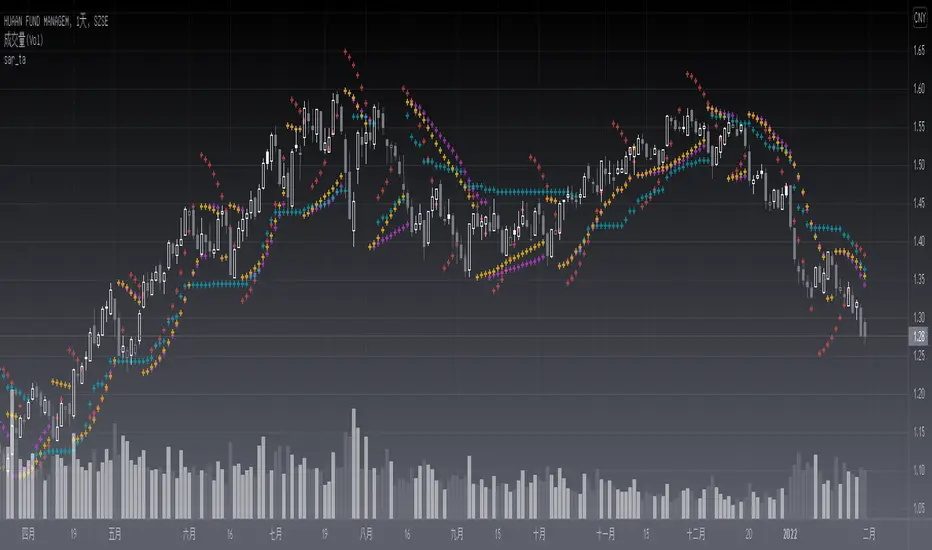
sar_taLevel: 3
Background
The Parabolic SAR is a technical indicator developed by J. Welles Wilder to determine the direction that an asset is moving. The indicator is also referred to as a stop and reverse system, which is abbreviated as SAR. It aims to identify potential reversals in the price movement of traded assets.
PINE v5 Version of SAR Library, which includes latest the Supertrend, Parabolic SAR, Gann Hilo activator, Chex indicators etc.
Function
This lib provides functions similar to SAR which can serve as a similar element for composite strategy. Parameters need to be tuned for the best performance and I will further inrish this collections.
Bonus,
If you can propose me a novel SAR source link, I would like to grant you one L4/L5 indicator with 2-month subscription for free.
Library "sar_ta"
tv_sar()
lucid_sar()
gl_activator()
ltb_sar()
chanex()
bjorgum_sar()
pandas_taLibrary "pandas_ta"
Level: 3
Background
Today is the first day of 2022 and happy new year every tradingviewers! May health and wealth go along with you all the time. I use this chance to publish my 1st PINE v5 lib : pandas_ta
This is not a piece of cake like thing, which cost me a lot of time and efforts to build this lib. Beyond 300 versions of this script was iterated in draft.
Function
Library "pandas_ta"
PINE v5 Counterpart of Pandas TA - A Technical Analysis Library in Python 3 at github.com
The Original Pandas Technical Analysis (Pandas TA) is an easy to use library that leverages the Pandas package with more than 130 Indicators and Utility functions and more than 60 TA Lib Candlestick Patterns.
I realized most of indicators except Candlestick Patterns because tradingview built-in Candlestick Patterns are even more powerful!
I use this to verify pandas_ta python version indicators for myself, but I realize that maybe many may need similar lib for pine v5 as well.
Function Brief Descriptions (Pls find details in script comments)
bton --> Binary to number
wcp --> Weighted Closing Price (WCP)
counter --> Condition counter
xbt --> Between
ebsw --> Even Better SineWave (EBSW)
ao --> Awesome Oscillator (AO)
apo --> Absolute Price Oscillator (APO)
xrf --> Dynamic shifted values
bias --> Bias (BIAS)
bop --> Balance of Power (BOP)
brar --> BRAR (BRAR)
cci --> Commodity Channel Index (CCI)
cfo --> Chande Forcast Oscillator (CFO)
cg --> Center of Gravity (CG)
cmo --> Chande Momentum Oscillator (CMO)
coppock --> Coppock Curve (COPC)
cti --> Correlation Trend Indicator (CTI)
dmi --> Directional Movement Index(DMI)
er --> Efficiency Ratio (ER)
eri --> Elder Ray Index (ERI)
fisher --> Fisher Transform (FISHT)
inertia --> Inertia (INERTIA)
kdj --> KDJ (KDJ)
kst --> 'Know Sure Thing' (KST)
macd --> Moving Average Convergence Divergence (MACD)
mom --> Momentum (MOM)
pgo --> Pretty Good Oscillator (PGO)
ppo --> Percentage Price Oscillator (PPO)
psl --> Psychological Line (PSL)
pvo --> Percentage Volume Oscillator (PVO)
qqe --> Quantitative Qualitative Estimation (QQE)
roc --> Rate of Change (ROC)
rsi --> Relative Strength Index (RSI)
rsx --> Relative Strength Xtra (rsx)
rvgi --> Relative Vigor Index (RVGI)
slope --> Slope
smi --> SMI Ergodic Indicator (SMI)
sqz* --> Squeeze (SQZ) * NOTE: code sufferred from very strange error, code was commented.
sqz_pro --> Squeeze PRO(SQZPRO)
xfl --> Condition filter
stc --> Schaff Trend Cycle (STC)
stoch --> Stochastic (STOCH)
stochrsi --> Stochastic RSI (STOCH RSI)
trix --> Trix (TRIX)
tsi --> True Strength Index (TSI)
uo --> Ultimate Oscillator (UO)
willr --> William's Percent R (WILLR)
alma --> Arnaud Legoux Moving Average (ALMA)
xll --> Dynamic rolling lowest values
dema --> Double Exponential Moving Average (DEMA)
ema --> Exponential Moving Average (EMA)
fwma --> Fibonacci's Weighted Moving Average (FWMA)
hilo --> Gann HiLo Activator(HiLo)
hma --> Hull Moving Average (HMA)
hwma --> HWMA (Holt-Winter Moving Average)
ichimoku --> Ichimoku Kinkō Hyō (ichimoku)
jma --> Jurik Moving Average Average (JMA)
kama --> Kaufman's Adaptive Moving Average (KAMA)
linreg --> Linear Regression Moving Average (linreg)
mgcd --> McGinley Dynamic Indicator
rma --> wildeR's Moving Average (RMA)
sinwma --> Sine Weighted Moving Average (SWMA)
ssf --> Ehler's Super Smoother Filter (SSF) © 2013
supertrend --> Supertrend (supertrend)
xsa --> X simple moving average
swma --> Symmetric Weighted Moving Average (SWMA)
t3 --> Tim Tillson's T3 Moving Average (T3)
tema --> Triple Exponential Moving Average (TEMA)
trima --> Triangular Moving Average (TRIMA)
vidya --> Variable Index Dynamic Average (VIDYA)
vwap --> Volume Weighted Average Price (VWAP)
vwma --> Volume Weighted Moving Average (VWMA)
wma --> Weighted Moving Average (WMA)
zlma --> Zero Lag Moving Average (ZLMA)
entropy --> Entropy (ENTP)
kurtosis --> Rolling Kurtosis
skew --> Rolling Skew
xev --> Condition all
zscore --> Rolling Z Score
adx --> Average Directional Movement (ADX)
aroon --> Aroon & Aroon Oscillator (AROON)
chop --> Choppiness Index (CHOP)
xex --> Condition any
cksp --> Chande Kroll Stop (CKSP)
dpo --> Detrend Price Oscillator (DPO)
long_run --> Long Run
psar --> Parabolic Stop and Reverse (psar)
short_run --> Short Run
vhf --> Vertical Horizontal Filter (VHF)
vortex --> Vortex
accbands --> Acceleration Bands (ACCBANDS)
atr --> Average True Range (ATR)
bbands --> Bollinger Bands (BBANDS)
donchian --> Donchian Channels (DC)
kc --> Keltner Channels (KC)
massi --> Mass Index (MASSI)
natr --> Normalized Average True Range (NATR)
pdist --> Price Distance (PDIST)
rvi --> Relative Volatility Index (RVI)
thermo --> Elders Thermometer (THERMO)
ui --> Ulcer Index (UI)
ad --> Accumulation/Distribution (AD)
cmf --> Chaikin Money Flow (CMF)
efi --> Elder's Force Index (EFI)
ecm --> Ease of Movement (EOM)
kvo --> Klinger Volume Oscillator (KVO)
mfi --> Money Flow Index (MFI)
nvi --> Negative Volume Index (NVI)
obv --> On Balance Volume (OBV)
pvi --> Positive Volume Index (PVI)
dvdi --> Dual Volume Divergence Index (DVDI)
xhh --> Dynamic rolling highest values
pvt --> Price-Volume Trend (PVT)
Remarks
I also incorporated func descriptions and func test script in commented mode, you can test the functino with the embedded test script and modify them as you wish.
This is a Level 3 free and open source indicator library.
Feedbacks are appreciated.
This is not the end of pandas_ta lib publication, but it is start point with pine v5 lib function and I will add more and more funcs into this lib for my own indicators.
Function Name List:
bton()
wcp()
count()
xbt()
ebsw()
ao()
apo()
xrf()
bias()
bop()
brar()
cci()
cfo()
cg()
cmo()
coppock()
cti()
dmi()
er()
eri()
fisher()
inertia()
kdj()
kst()
macd()
mom()
pgo()
ppo()
psl()
pvo()
qqe()
roc()
rsi()
rsx()
rvgi()
slope()
smi()
sqz_pro()
xfl()
stc()
stoch()
stochrsi()
trix()
tsi()
uo()
willr()
alma()
wcx()
xll()
dema()
ema()
fwma()
hilo()
hma()
hwma()
ichimoku()
jma()
kama()
linreg()
mgcd()
rma()
sinwma()
ssf()
supertrend()
xsa()
swma()
t3()
tema()
trima()
vidya()
vwap()
vwma()
wma()
zlma()
entropy()
kurtosis()
skew()
xev()
zscore()
adx()
aroon()
chop()
xex()
cksp()
dpo()
long_run()
psar()
short_run()
vhf()
vortex()
accbands()
atr()
bbands()
donchian()
kc()
massi()
natr()
pdist()
rvi()
thermo()
ui()
ad()
cmf()
efi()
ecm()
kvo()
mfi()
nvi()
obv()
pvi()
dvdi()
xhh()
pvt()
