Trend Lines by Pivots (Enhanced)### **📌 Detailed Explanation of the TradingView Indicator Code**
This **Pine Script v5** indicator automatically **detects trend lines** based on pivot highs and pivot lows. It helps traders visualize **support and resistance levels** using dynamic trend lines.
---
## **🔹 How the Indicator Works**
The indicator identifies **key pivot points** in price action and then **draws trend lines** connecting them. It works as follows:
1. **Detects Pivot Highs and Lows**:
- A **pivot high** is a local maximum where the price is higher than surrounding bars.
- A **pivot low** is a local minimum where the price is lower than surrounding bars.
2. **Stores the Last Two Pivot Points**:
- The script remembers the last **two pivot highs** and **two pivot lows**.
- These points are used to **draw resistance and support lines** dynamically.
3. **Plots Resistance and Support Lines**:
- The script continuously **updates** and **extends** the trend lines to the right as new pivots are found.
- **Red Line (Resistance):** Connects the last two pivot highs.
- **Green Line (Support):** Connects the last two pivot lows.
---
## **🔹 Code Breakdown**
### **1️⃣ Inputs for User Customization**
```pinescript
leftLen = input.int(2, "Left Pivot Length")
rightLen = input.int(2, "Right Pivot Length")
highLineColor = input.color(color.red, "Resistance Line Color")
lowLineColor = input.color(color.green, "Support Line Color")
```
- **leftLen & rightLen:** Define how many bars on the left and right should be used to confirm a pivot.
- **highLineColor:** Sets the color of the resistance trend line (default: **red**).
- **lowLineColor:** Sets the color of the support trend line (default: **green**).
---
### **2️⃣ Detect Pivot Highs & Lows**
```pinescript
pivotHigh = ta.pivothigh(leftLen, rightLen)
pivotLow = ta.pivotlow(leftLen, rightLen)
```
- `ta.pivothigh(leftLen, rightLen)`: Detects a **pivot high** if it's the highest price in a certain range.
- `ta.pivotlow(leftLen, rightLen)`: Detects a **pivot low** if it's the lowest price in a certain range.
---
### **3️⃣ Store the Last Two Pivot Points**
#### **🔺 Storing Resistance (Pivot Highs)**
```pinescript
var float lastPivotHigh1 = na
var int lastPivotHighIndex1 = na
var float lastPivotHigh2 = na
var int lastPivotHighIndex2 = na
```
- These variables store **the last two pivot highs** and their **bar indices** (position on the chart).
#### **🔻 Storing Support (Pivot Lows)**
```pinescript
var float lastPivotLow1 = na
var int lastPivotLowIndex1 = na
var float lastPivotLow2 = na
var int lastPivotLowIndex2 = na
```
- These variables store **the last two pivot lows** and their **bar indices**.
---
### **4️⃣ Update Pivot Points When New Ones Are Found**
#### **Updating Resistance (Pivot Highs)**
```pinescript
if not na(pivotHigh)
lastPivotHigh2 := lastPivotHigh1
lastPivotHighIndex2 := lastPivotHighIndex1
lastPivotHigh1 := pivotHigh
lastPivotHighIndex1 := bar_index - rightLen
```
- If a new **pivot high** is found:
- The **previous pivot** becomes `lastPivotHigh2`.
- The **new pivot** becomes `lastPivotHigh1`.
- The index (`bar_index - rightLen`) marks where the pivot occurred.
#### **Updating Support (Pivot Lows)**
```pinescript
if not na(pivotLow)
lastPivotLow2 := lastPivotLow1
lastPivotLowIndex2 := lastPivotLowIndex1
lastPivotLow1 := pivotLow
lastPivotLowIndex1 := bar_index - rightLen
```
- Similar to pivot highs, this section updates **pivot lows** dynamically.
---
### **5️⃣ Create and Update Trend Lines**
#### **🔺 Drawing the Resistance Line**
```pinescript
var line highLine = na
if not na(lastPivotHigh2) and not na(lastPivotHigh1)
if na(highLine)
highLine := line.new(lastPivotHighIndex2, lastPivotHigh2, lastPivotHighIndex1, lastPivotHigh1, color=highLineColor, extend=extend.right)
else
line.set_xy1(highLine, lastPivotHighIndex2, lastPivotHigh2)
line.set_xy2(highLine, lastPivotHighIndex1, lastPivotHigh1)
line.set_color(highLine, highLineColor)
```
- If **two pivot highs** exist:
- **First time:** Creates a new **resistance line** connecting them.
- **Updates dynamically:** Adjusts the line when a new pivot appears.
#### **🔻 Drawing the Support Line**
```pinescript
var line lowLine = na
if not na(lastPivotLow2) and not na(lastPivotLow1)
if na(lowLine)
lowLine := line.new(lastPivotLowIndex2, lastPivotLow2, lastPivotLowIndex1, lastPivotLow1, color=lowLineColor, extend=extend.right)
else
line.set_xy1(lowLine, lastPivotLowIndex2, lastPivotLow2)
line.set_xy2(lowLine, lastPivotLowIndex1, lastPivotLow1)
line.set_color(lowLine, lowLineColor)
```
- Same logic applies for **support levels**, creating or updating a **green trend line**.
---
## **🔹 How to Use This Indicator**
1. **Apply the script in TradingView**:
- Open **Pine Script Editor** → Paste the code → Click **"Add to Chart"**.
2. **Interpret the Lines**:
- **Red line (Resistance):** Price may struggle to break above it.
- **Green line (Support):** Price may bounce off it.
3. **Trading Strategy**:
- **Breakout Strategy:**
- If the price **breaks resistance**, expect a bullish move.
- If the price **breaks support**, expect a bearish move.
- **Reversal Trading:**
- Look for **bounces off support/resistance** for potential reversals.
---
## **🔹 Key Features of This Indicator**
✅ **Automatically detects pivot highs and lows.**
✅ **Draws real-time trend lines for support and resistance.**
✅ **Updates dynamically with new price action.**
✅ **Customizable settings for pivot sensitivity and colors.**
This indicator is useful for **trend traders, breakout traders, and support/resistance traders**. 🚀
Let me know if you need **further improvements or additional features!** 😊
مؤشرات اتساع النطاق

Advanced Multi-Timeframe Trading System (Risk Managed)Description:
This strategy is an original approach that combines two main analytical components to identify potential trade opportunities while simulating realistic trading conditions:
1. Market Trend Analysis via an Approximate Hurst Exponent
• What It Does:
The strategy computes a rough measure of market trending using an approximate Hurst exponent. A value above 0.5 suggests persistent, trending behavior, while a value below 0.5 indicates a tendency toward mean-reversion.
• How It’s Used:
The Hurst exponent is calculated on both the chart’s current timeframe and a higher timeframe (default: Daily) to capture both local and broader market dynamics.
2. Fibonacci Retracement Levels
• What It Does:
Using daily high and low data from a selected timeframe (default: Daily), the script computes key Fibonacci retracement levels.
• How It’s Used:
• The 61.8% level (Golden Ratio) serves as a key threshold:
• A long entry is signaled when the price crosses above this level if the daily Hurst exponent confirms a trending market.
• The 38.2% level is used to identify short-entry opportunities when the price crosses below it and the daily Hurst indicates non-trending conditions.
Signal Logic:
• Long Entry:
When the price crosses above the 61.8% Fibonacci level (Golden Ratio) and the daily Hurst exponent is greater than 0.5, suggesting a trending market.
• Short Entry:
When the price crosses below the 38.2% Fibonacci level and the daily Hurst exponent is less than 0.5, indicating a less trending or potentially reversing market.
Risk Management & Trade Execution:
• Stop-Loss:
Each trade is risk-managed with a stop-loss set at 2% below (for longs) or above (for shorts) the entry price. This ensures that no single trade risks more than a small, sustainable portion of the account.
• Take Profit:
A take profit order targets a risk-reward ratio of 1:2 (i.e., the target profit is twice the amount risked).
• Position Sizing:
Trades are executed with a fixed position size equal to 10% of account equity.
• Trade Frequency Limits:
• Daily Limit: A maximum of 5 trades per day
• Overall Limit: No more than 510 trades during the backtesting period (e.g., since 2019)
These limits are imposed to simulate realistic trading frequency and to avoid overtrading in backtest results.
Backtesting Parameters:
• Initial Capital: $10,000
• Commission: 0.1% per trade
• Slippage: 1 tick per bar
These settings aim to reflect the conditions faced by the average trader and help ensure that the backtesting results are realistic and not misleading.
Chart Overlays & Visual Aids:
• Fibonacci Levels:
The key Fibonacci retracement levels are plotted on the chart, and the zone between the 61.8% and 38.2% levels is highlighted to show a key retracement area.
• Market Trend Background:
The chart background is tinted green when the daily Hurst exponent indicates a trending market (value > 0.5) and red otherwise.
• Information Table:
An on-chart table displays key parameters such as the current Hurst exponent, daily Hurst value, the number of trades executed today, and the global trade count.
Disclaimer:
Past performance is not indicative of future results. This strategy is experimental and provided solely for educational purposes. It is essential that you backtest and paper trade using your own settings before considering any live deployment. The Hurst exponent calculation is an approximation and should be interpreted as a rough gauge of market behavior. Adjust the parameters and risk management settings according to your personal risk tolerance and market conditions.
Additional Notes:
• Originality & Usefulness:
This script is an original mashup that combines trend analysis with Fibonacci retracement methods. The description above explains how these components work together to provide trading signals.
• Realistic Results:
The strategy uses realistic account sizes, commission rates, slippage, and risk management rules to generate backtesting results that are representative of real-world trading.
• Educational Purpose:
This script is intended to support the TradingView community by offering insights into combining multiple analysis techniques in one strategy. It is not a “get-rich-quick” system but rather an educational tool to help traders understand risk management and trade signal logic.
By using this script, you acknowledge that trading involves risk and that you are responsible for testing and adjusting the strategy to fit your own trading environment. This publication is fully open source, and any modifications should include proper attribution if significant portions of the code are reused.

Stock Sector ETF with IndicatorsThe Stock Sector ETF with Indicators is a versatile tool designed to track the performance of sector-specific ETFs relative to the current asset. It automatically identifies the sector of the underlying symbol and displays the corresponding ETF’s price action alongside key technical indicators. This helps traders analyze sector trends and correlations in real time.
---
Key Features
Automatic Sector Detection:
Fetches the sector of the current asset (e.g., "Technology" for AAPL).
Maps the sector to a user-defined ETF (default: SPDR sector ETFs) .
Technical Indicators:
Simple Moving Average (SMA): Tracks the ETF’s trend.
Bollinger Bands: Highlights volatility and potential reversals.
Donchian High (52-Week High): Identifies long-term resistance levels.
Customizable Inputs:
Adjust indicator parameters (length, visibility).
Override default ETFs for specific sectors.
Informative Table:
Displays the current sector and ETF symbol in the bottom-right corner.
---
Input Settings
SMA Settings
SMA Length: Period for calculating the Simple Moving Average (default: 200).
Show SMA: Toggle visibility of the SMA line.
Bollinger Bands Settings
BB Length: Period for Bollinger Bands calculation (default: 20).
BB Multiplier: Standard deviation multiplier (default: 2.0).
Show Bollinger Bands: Toggle visibility of the bands.
Donchian High (52-Week High)
Daily High Length: Days used to calculate the high (default: 252, approx. 1 year).
Show High: Toggle visibility of the 52-week high line.
Sector Selections
Customize ETFs for each sector (e.g., replace XLU with another utilities ETF).
---
Example Use Cases
Trend Analysis: Compare a stock’s price action to its sector ETF’s SMA for trend confirmation.
Volatility Signals: Use Bollinger Bands to spot ETF price squeezes or breakouts.
Sector Strength: Monitor if the ETF is approaching its 52-week high to gauge sector momentum.
Enjoy tracking sector trends with ease! 🚀

Advanced Trend and Volatility Indicator with Alerts by ZaimonThis script presents a comprehensive analytical tool that integrates multiple technical indicators to provide a holistic view of market trends and volatility. By uniquely combining Moving Averages (MA), Relative Strength Index (RSI), Stochastic Oscillator, Bollinger Bands, and Average True Range (ATR), it offers nuanced insights into price movements and helps identify potential trading opportunities.
---
### **Key Features and Integration:**
1. **Moving Averages (MA20 & MA50):**
- **Trend Identification:**
- **Methodology:** Calculates two Simple Moving Averages—MA20 (short-term) and MA50 (long-term).
- **Bullish Trend:** When MA20 crosses above MA50, indicating upward momentum.
- **Bearish Trend:** When MA20 crosses below MA50, signaling downward momentum.
- **Golden Cross & Death Cross Alerts:**
- **Golden Cross:** MA20 crossing above MA50 generates a bullish alert and visual symbol.
- **Death Cross:** MA20 crossing below MA50 triggers a bearish alert and visual symbol.
- **Integration:**
- Serves as the foundational trend indicator, influencing interpretations of other indicators within the script.
2. **Relative Strength Index (RSI):**
- **Momentum Measurement:**
- **Methodology:** Calculates RSI to assess the speed and change of price movements over a 14-period length.
- **Overbought/Oversold Conditions:** Customizable thresholds set at 70 (overbought) and 30 (oversold).
- **Alerts:**
- Generates alerts when RSI crosses above or below the specified thresholds.
- **Integration:**
- Confirms trend strength identified by MAs.
- Overbought/Oversold signals can precede potential trend reversals, especially when aligned with MA crossovers.
3. **Stochastic Oscillator:**
- **Momentum and Reversal Signals:**
- **Methodology:** Uses %K and %D lines to evaluate price momentum relative to high-low range over recent periods.
- **Bullish Signal:** %K crossing above %D in oversold territory (below 20).
- **Bearish Signal:** %K crossing below %D in overbought territory (above 80).
- **Alerts:**
- Provides alerts on bullish and bearish crossovers in extreme regions.
- **Integration:**
- Enhances RSI signals by providing additional momentum confirmation.
- When both RSI and Stochastic indicate overbought/oversold conditions, it strengthens the likelihood of a reversal.
4. **Bollinger Bands:**
- **Volatility Visualization:**
- **Methodology:** Plots upper and lower bands based on standard deviations from a moving average (BB Basis).
- **Dynamic Support/Resistance:** Prices touching or exceeding the bands may indicate potential reversals.
- **Integration:**
- Works with RSI and Stochastic to identify overextended price movements.
- Helps in assessing volatility alongside trend and momentum indicators.
5. **Average True Range (ATR):**
- **Volatility Assessment:**
- **Methodology:** Calculates ATR over a 14-period length to measure market volatility.
- **ATR Bands:** Plots upper and lower bands relative to the current price using an ATR multiplier.
- **Integration:**
- Assists in setting stop-loss and take-profit levels based on current volatility.
- Complements Bollinger Bands for a comprehensive volatility analysis.
6. **Information Table:**
- **Real-Time Data Display:**
- Shows current values of MA20, MA50, RSI, Stochastic %K and %D, BB Basis, ATR, and Trend Status.
- **Trend Status Indicator:**
- Displays "Bullish," "Bearish," or "Sideways" based on MA conditions.
- **Integration:**
- Provides a consolidated view for quick decision-making without analyzing individual indicators separately.
7. **Periodic Labels:**
- **Enhanced Visibility:**
- Adds labels every 50 bars showing RSI and Stochastic values.
- **Integration:**
- Helps track momentum changes over time and spot longer-term patterns.
---
### **How the Components Work Together:**
- **Synergistic Analysis:**
- **Trend Confirmation:** MA crossovers establish the primary trend, while RSI and Stochastic confirm momentum within that trend.
- **Volatility Context:** Bollinger Bands and ATR provide context on market volatility, refining entry and exit points suggested by trend and momentum indicators.
- **Signal Strength:** Concurrent signals from multiple indicators increase confidence in trading decisions.
---
### **Usage Guidelines:**
1. **Trend Analysis:**
- **Identify Trend Direction:**
- Observe MA20 and MA50 crossovers.
- Refer to the Trend Status in the information table.
- **Confirm with Momentum Indicators:**
- Ensure RSI and Stochastic support the identified trend.
2. **Entry and Exit Points:**
- **Overbought/Oversold Conditions:**
- Look for RSI and Stochastic reaching extreme levels.
- Consider entering positions when oversold in a bullish trend or overbought in a bearish trend.
- **Bollinger Band Interactions:**
- Use price interactions with Bollinger Bands to identify potential reversal zones.
3. **Risk Management:**
- **ATR-Based Levels:**
- Set stop-loss and take-profit levels using ATR bands to account for current volatility.
- **Adjusting to Volatility:**
- Modify position sizes and targets based on Bollinger Band width and ATR values.
4. **Alerts Setup:**
- **Customize Alert Thresholds:**
- Configure alerts for MA crossovers, RSI levels, and Stochastic crossovers according to your trading strategy.
- **Stay Informed:**
- Use alerts to monitor key events without constant chart observation.
---
### **Customization:**
- **Flexible Parameters:**
- All indicator lengths, thresholds, and settings are adjustable to suit different trading styles and timeframes.
- **Adjustable Visuals:**
- Modify plot colors, line styles, and label positions to enhance chart readability.
---
### **Originality and Value Addition:**
This script differentiates itself by:
- **Integrated Approach:**
- Seamlessly combining multiple indicators to provide a more comprehensive analysis than using each indicator separately.
- **Enhanced Visualization:**
- Utilizing plots, fills, labels, and an information table to present data intuitively.
- **User-Friendly Features:**
- Pre-configured alerts and real-time data displays reduce the need for manual monitoring.
By explaining how each component interacts and contributes to the overall analysis, the script adds substantial value to traders seeking a multi-faceted tool for market analysis.
---
### **Additional Notes:**
- **Learning Resource:**
- The script is well-commented, serving as an educational tool for those learning Pine Script and technical analysis integration.
- **Further Enhancements:**
- Opportunities exist to incorporate additional indicators like MACD or ADX, and to develop advanced alert logic, such as RSI or Stochastic divergences.
---
### **Disclaimer:**
- **Educational Purpose Only:**
- This script is provided for informational purposes and should not be construed as financial advice.
- **Risk Acknowledgment:**
- Trading involves significant risk; past performance is not indicative of future results.
- **Due Diligence:**
- Users should conduct their own analysis and consider consulting a financial professional before making trading decisions.
---
By providing detailed explanations of the methodologies and the synergistic use of multiple indicators, this script aligns with TradingView's guidelines for originality and usefulness. It offers traders a unique tool that enhances market analysis through the thoughtful integration of technical indicators.

Hammer Detector### Hammer Pattern Detector
The Hammer Pattern Detector is a specialized technical analysis tool designed to identify high-probability hammer candlestick patterns. This indicator uses precise mathematical calculations to detect hammer patterns that meet specific criteria, helping traders identify potential market reversals.
#### Key Features
- Precise detection of hammer patterns based on shadow-to-body ratios
- Customizable parameters for fine-tuning pattern recognition
- Visual alerts with markers above qualifying candles
- Built-in alert functionality for real-time notifications
#### Parameters
1. **Shadow Length Multiplier (min)**: Controls how many times longer the lower shadow must be compared to the candle body (default: 2.0)
2. **Maximum Upper Shadow (%)**: Sets the maximum allowed length for the upper shadow as a percentage of total candle length (default: 10%)
3. **Minimum Body to High Distance (%)**: Defines how close the body must be to the high of the candle (default: 90%)
#### Detection Criteria
The indicator identifies hammer patterns based on three main conditions:
- Lower shadow must be at least twice the length of the body (adjustable)
- Upper shadow must be minimal (max 10% of total candle length by default)
- Candle body must be positioned near the high of the candle
#### Use Cases
- Identifying potential trend reversals
- Finding entry points in oversold conditions
- Confirming support levels
- Part of a broader reversal strategy
#### Tips for Best Results
- Use in conjunction with support/resistance levels
- Combine with volume analysis for confirmation
- Consider overall market context and trend
- Adjust parameters based on your trading timeframe
#### Installation
1. Add the indicator to your chart
2. Adjust the parameters according to your trading style
3. Optional: Set up alerts for real-time notifications
#### About
Created by WK
Version: 1.0
All rights reserved ©WK
For questions or suggestions, please reach out through TradingView.

Drawdown Visualisation█ OVERVIEW
The Drawdown Visualisation indicator calculates and displays the instrument’s drawdown (in percent) relative to its all‐time high (ATH) from a user‐defined start date. It provides customisable options for label appearance, threshold lines (0%, –50%, –100%), and can plot historic drawdown levels via pivot detection.
█ USAGE
This indicator should be used with the Percentage Retracement from ATH indicator.
█ KEY FEATURES
Custom Date Settings — Use a custom start date so that only specified price action is considered.
Retracement Level Calculation — Determines ATH and computes multiple retracement levels using percentages from 0% to –100%.
Visual Signals and Customisation — Plots configurable horizontal lines and labels that display retracement percentages and prices.
Time Filtering — Bases calculations on data from the desired time period.
Historic Drawdowns — Display historical drawdowns
█ PURPOSE
Assist traders in visualising the depth of price retracements from recent or historical peaks.
Identify critical zones where the market may find support or resistance after reaching an ATH.
Facilitate more informed entry and exit decisions by clearly demarcating retracement levels on the chart.
█ IDEAL USERS
Swing Traders — Looking to exploit pullbacks following strong upward moves.
Technical Analysts — Interested in pinpointing key retracement levels as potential reversal or continuation points.
Price Action Traders — Focused on the nuances of market peaks and subsequent corrections.
Strategy Developers — Keen to backtest and refine approaches centred on retracement dynamics.
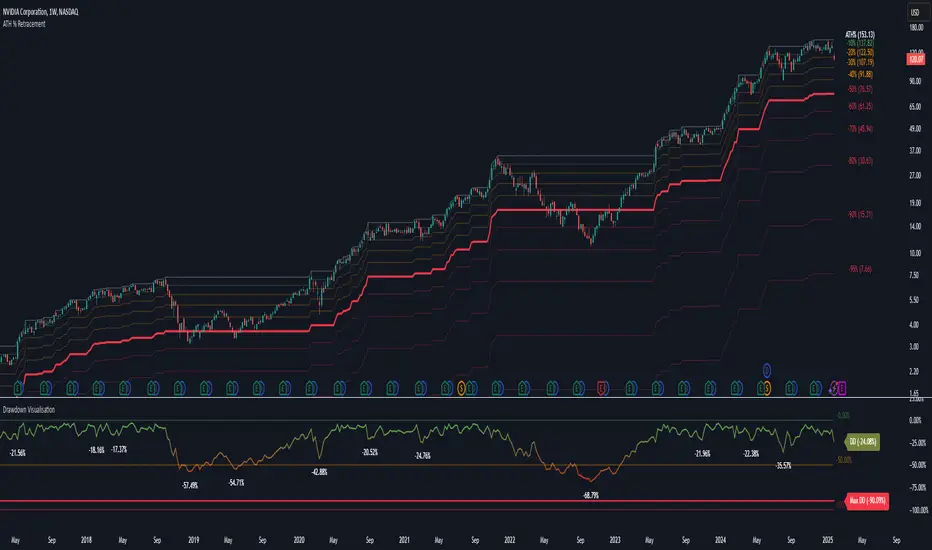
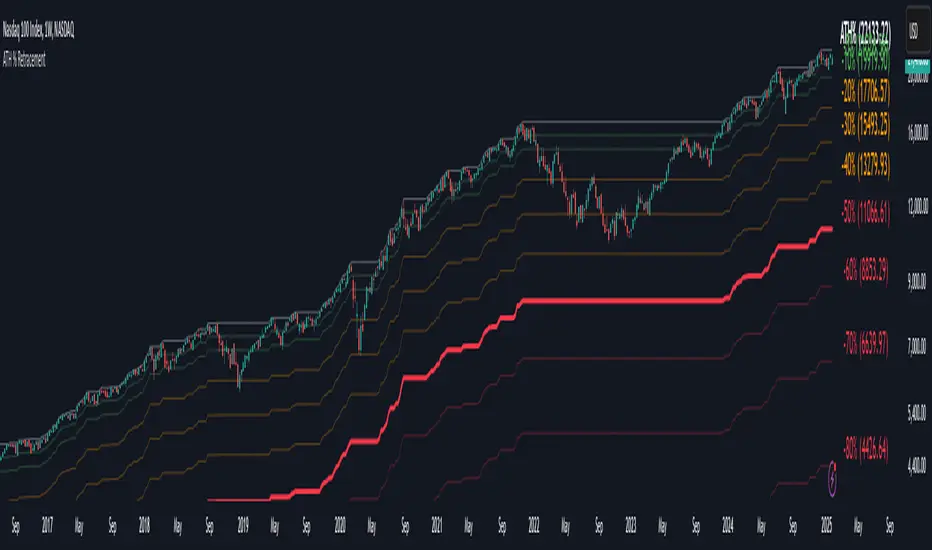
Percentage Retracement from ATH█ OVERVIEW
The Percentage Retracement from ATH indicator is a dynamic trading utility designed to help traders gauge market pullbacks from the peak price. By calculating key retracement levels based on the All-Time High (ATH) and user‑defined percentage inputs, it offers clear visual cues to assist in identifying potential support and resistance zones.
█ KEY FEATURES
Custom Date — Use a custom start date so the indicator only considers specified price action.
Retracement Calculation — Determines ATH and calculates levels based on user‑defined percentages (0% to –100%).
Visual Customisation — Plots configurable horizontal lines and labels showing retracement percentages and prices.
Time Filtering — Uses time filtering to base levels on the desired data period.
█ PURPOSE
Assist traders in visualising the depth of price retracements from recent or historical peaks.
Identify critical zones where the market may find support or resistance after reaching an ATH.
Facilitate more informed entry and exit decisions by clearly demarcating retracement levels on the chart.
█ IDEAL USERS
Swing Traders — Looking to exploit pullbacks following strong upward moves.
Technical Analysts — Interested in pinpointing key retracement levels as potential reversal or continuation points.
Price Action Traders — Focused on the nuances of market peaks and subsequent corrections.
Strategy Developers — Keen to backtest and refine approaches centred on retracement dynamics.
200-Week EMA % Difference200-Week EMA Percentage Difference Indicator – Understanding Market Stretch & Reversion
What This Indicator Does
Even if an individual stock is delivering strong earnings and solid fundamentals, it is still influenced by overall market sentiment. When the broader market begins reverting to its long-term mean, stocks—no matter how strong—are often pulled down along with it. Unrealized gains can erode if one ignores these macro movements.
The 200-Week EMA Percentage Difference indicator measures how far the price of an asset or index has moved away from its 200-week Exponential Moving Average (EMA) in percentage terms. This provides a reliable gauge of whether the market is overstretched (overbought) or pulling back to support (oversold) relative to a long-term trend.
How It Helps Investors
Identifying Market Extremes:
When the indicator moves into the 50-80% range, historical trends show that broad-based indices like BSE Smallcap, Nifty 500, Nifty Microcap, and Nifty Smallcap 250 have often experienced corrections.
This suggests that the market may be overextended, and investors should exercise caution.
Spotting Support Zones:
Past data indicates that when the percentage difference falls back to around 30%, the market often finds a new support level, leading to fresh buying opportunities.
This can help long-term investors identify favorable entry points.
Mean Reversion & Market Cycles:
The indicator essentially measures how far these indices have stretched from their long-term mean (200-week EMA).
Extreme deviations from the EMA often result in mean reversion, where prices eventually return to more sustainable levels.
How to Use It in Broad-Based Indices
Above 50-80% → Caution Zone: Historically associated with market tops or overheated conditions.
Around 30% → Support Zone: A potential level where corrections stabilize and new market uptrends begin.
By applying this indicator to indices like BSE Smallcap, Nifty 500, Nifty Microcap, and Nifty Smallcap 250, investors can gauge market strength, anticipate corrections, and position themselves strategically for long-term opportunities.

Delta SMA 1-Year High/Low Strategy### Summary:
This Pine Script code implements a trading strategy based on the **Delta SMA (Simple Moving Average)** of buy and sell volumes over a 1-year lookback period. The strategy identifies potential buy and sell signals by analyzing the relationship between the Delta SMA and its historical high/low thresholds. Key features include:
1. **Delta Calculation**:
- The Delta is calculated as the difference between buy volume (when close > open) and sell volume (when close < open).
- A 14-period SMA is applied to the Delta to smooth the data.
2. **1-Year High/Low Thresholds**:
- The strategy calculates the 1-year high and low of the Delta SMA.
- Buy and sell conditions are derived from thresholds set at 70% of the 1-year low and 90% and 50% of the 1-year high, respectively.
3. **Buy Condition**:
- A buy signal is triggered when the Delta SMA crosses above 0 after being below 70% of the 1-year low.
4. **Sell Condition**:
- A sell signal is triggered when the Delta SMA drops below 60% of the 1-year high after crossing above 90% of the 1-year high.
5. **Visualization**:
- The Delta SMA and its thresholds are plotted on the chart for easy monitoring.
- Optional buy/sell signals can be plotted as labels on the chart.
This strategy is designed to capture trends in volume-based momentum over a long-term horizon, making it suitable for swing or position trading.

Trend & ADX by Gideon for Indian MarketsThis indicator is designed to help traders **identify strong trends** using the **Kalman Filter** and **ADX** (Average Directional Index). It provides **Buy/Sell signals** based on trend direction and ADX strength. I wanted to create something for Indian markets since there are not much available.
In a nut-shell:
✅ **Buy when the Kalman Filter turns green, and ADX is strong.
❌ **Sell when the Kalman Filter turns red, and ADX is strong.
📌 **Ignore signals if ADX is weak (below threshold).
📊 Use on 5-minute timeframes for intraday trading.
------------------------------------------------------------------------
1. Understanding the Indicator Components**
- **Green Line:** Indicates an **uptrend**.
- **Red Line:** Indicates a **downtrend**.
- The **line color change** signals a potential **trend reversal**.
**ADX Strength Filter**
- The **ADX (orange line)** measures trend strength.
- The **blue horizontal line** marks the **ADX threshold** (default: 20).
- A **Buy/Sell signal is only valid if ADX is above the threshold**, ensuring a strong trend.
**Buy & Sell Signals**
- **Buy Signal (Green Up Arrow)**
- Appears **one candle before** the Kalman line turns green.
- ADX must be **above the threshold** (default: 20).
- Suggests entering a **long position**.
- **Sell Signal (Red Down Arrow)**
- Appears **one candle before** the Kalman line turns red.
- ADX must be **above the threshold** (default: 20).
- Suggests entering a **short position**.
2. Best Settings for 5-Minute Timeframe**
For day trading on the **5-minute chart**, the following settings work best:
- **Kalman Filter Length:** `50`
- **Process Noise (Q):** `0.1`
- **Measurement Noise (R):** `0.01`
- **ADX Length:** `14`
- **ADX Threshold:** `20`
- **(Increase to 25-30 for more reliable signals in volatile markets)**
3. How to Trade with This Indicator**
**Entry Rules**
✅ **Buy Entry**
- Wait for a **green arrow (Buy Signal).
- Kalman Line must **turn green**.
- ADX must be **above the threshold** (strong trend confirmed).
- Enter a **long position** on the next candle.
❌ **Sell Entry**
- Wait for a **red arrow (Sell Signal).
- Kalman Line must **turn red**.
- ADX must be **above the threshold** (strong trend confirmed).
- Enter a **short position** on the next candle.
**Exit & Risk Management**
📌 **Stop Loss**:
- Place stop-loss **below the previous swing low** (for buys) or **above the previous swing high** (for sells).
📌 **Take Profit:
- Use a **Risk:Reward Ratio of 1:2 or 1:3.
- Exit when the **Kalman Filter color changes** (opposite trend signal).
📌 **Avoid Weak Trends**:
- **No trades when ADX is below the threshold** (low trend strength).
4. Additional Tips
- Works best on **liquid assets** like **Bank Nifty, Nifty 50, and large-cap stocks**.
- **Avoid ranging markets** with low ADX values (<20).
- Use alongside **volume analysis and support/resistance levels** for confirmation.
- Experiment with **ADX Threshold (increase for stronger signals, decrease for more trades).**
Best of Luck traders ! 🚀

SMA + RSI + Volume + ATR StrategySMA + RSI + Volume + ATR Strategy
1. Indicators Used:
SMA (Simple Moving Average): This is a trend-following indicator that calculates the average price of a security over a specified period (50 periods in this case). It's used to identify the overall trend of the market.
RSI (Relative Strength Index): This measures the speed and change of price movements. It tells us if the market is overbought (too high) or oversold (too low). Overbought is above 70 and oversold is below 30.
Volume: This is the amount of trading activity. A higher volume often indicates strong interest in a particular price move.
ATR (Average True Range): This measures volatility, or how much the price is moving in a given period. It helps us adjust stop losses and take profits based on market volatility.
2. Conditions for Entering Trades:
Buy Signal (Green Up Arrow):
Price is above the 50-period SMA (indicating an uptrend).
RSI is below 30 (indicating the market might be oversold or undervalued, signaling a potential reversal).
Current volume is higher than average volume (indicating strong interest in the move).
ATR is increasing (indicating higher volatility, suggesting that the market might be ready for a move).
Sell Signal (Red Down Arrow):
Price is below the 50-period SMA (indicating a downtrend).
RSI is above 70 (indicating the market might be overbought or overvalued, signaling a potential reversal).
Current volume is higher than average volume (indicating strong interest in the move).
ATR is increasing (indicating higher volatility, suggesting that the market might be ready for a move).
3. Take Profit & Stop Loss:
Take Profit: When a trade is made, the strategy will set a target price at a certain percentage above or below the entry price (1.5% in this case) to automatically exit the trade once that target is hit.
Stop Loss: If the price goes against the position, a stop loss is set at a percentage below or above the entry price (0.5% in this case) to limit losses.
4. Execution of Trades:
When the buy condition is met, the strategy will enter a long position (buying).
When the sell condition is met, the strategy will enter a short position (selling).
5. Visual Representation:
Green Up Arrow: Appears on the chart when the buy condition is met.
Red Down Arrow: Appears on the chart when the sell condition is met.
These arrows help you see at a glance when the strategy suggests you should buy or sell.
In Summary:
This strategy uses a combination of trend-following (SMA), momentum (RSI), volume, and volatility (ATR) to decide when to buy or sell a stock. It looks for opportunities when the market is either oversold (buy signal) or overbought (sell signal) and makes sure there’s enough volume and volatility to back up the move. It also includes take-profit and stop-loss levels to manage risk.

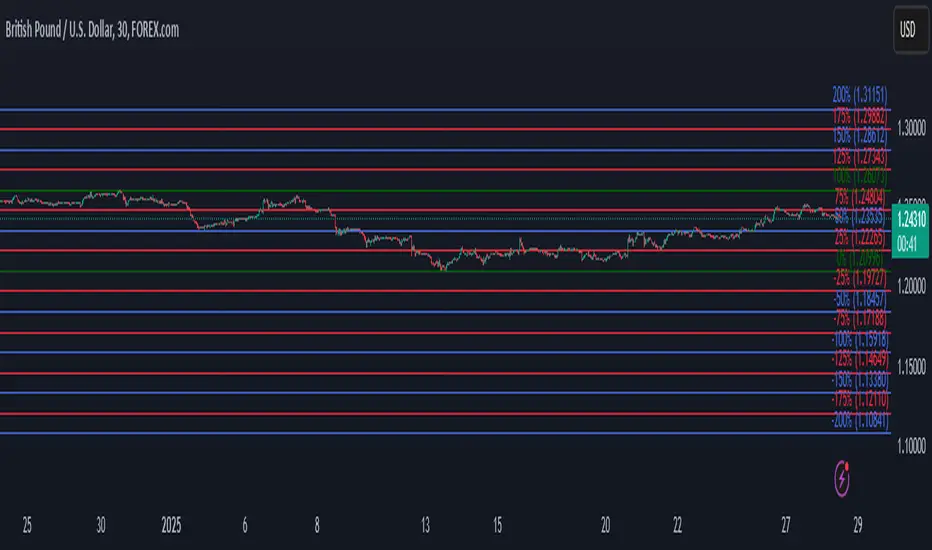
Automatic Fibonacci retracement based on the highest high and loThe chart is fractal, meaning that what happens can always be broken down into smaller portions.
This is often seen in various AR (Algorithmic Rules) concepts, such as breakers, order blocks, etc., where the price reacts.
I’ve visualized this behavior with this indicator.
This indicator takes the highest high and the lowest low from the past 5 weeks, excluding the current week.
The lowest low will represent 0%, and the highest high will represent 100% (green lines).
It then divides this range into 25%, 50%, 75%, and 100% levels (red and blue lines).
The indicator works on all charts and all timeframes, automatically adjusting when you switch charts or timeframes. No manual input is required.
Additionally, above 100%, it will create levels at 125%, 150%, 175%, and 200%, while below 0%, it will create levels at -25%, -50%, -75%, and -100%.
Your chart will now be divided into these 25% levels, allowing you to observe how the price either respects or breaks through them.
Again, this isn’t something “groundbreaking,” but simply a visual aid to identify levels where the price finds support/resistance or breaks through.
It helps me gain a broader perspective and determine whether my trade is moving in the right direction or if I should remain cautious.
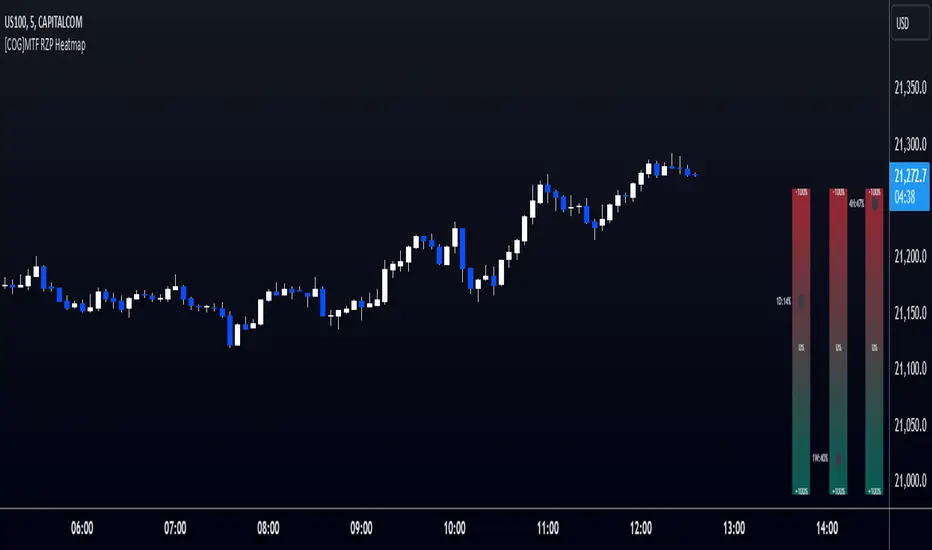
[COG]MTF RZP Heatmap MTF RZP Heatmap (Range Zone Pulse)
What It Does
This indicator creates three visual heatmaps that show how current price movement compares to the average range of different timeframes. It helps traders:
Identify when price moves are overextended
Compare momentum across different timeframes
Spot potential reversal points
Understand the relative strength of price movements
How It Works
Range Calculation:
For each selected timeframe, it calculates an average range based on the specified number of periods
The range is measured from high to low for each period
A moving average of these ranges creates a dynamic "normal" range for that timeframe
Position Calculation:
Measures how far price has moved from the period's opening price
Compares this movement to the average range
Converts the movement into a percentage (-100% to +100%)
Visual Display:
Shows three vertical heatmaps, one for each timeframe
Colors graduate from bearish (typically red) to bullish (typically green)
A dot indicator shows the current position within each range
Percentage labels show exact movement relative to average range
Trading Applications
Trend Trading:
Multiple timeframes aligned in the same color suggest strong trend
Use larger timeframes (Daily/Weekly) for trend direction
Use smaller timeframes (4H/1H) for entry timing
Mean Reversion:
Extreme readings (near +100% or -100%) suggest overextended moves
Look for divergences between timeframes
Use when shorter timeframes show extremes but larger timeframes don't
Volatility Trading:
Compare current moves to average ranges
Identify when markets are more volatile than usual
Adjust position sizes based on range expansion/contraction
Multi-Timeframe Analysis:
Compare price action across different time horizons
Identify conflicting signals between timeframes
Use for timeframe alignment in trading decisions
Best Practices for Usage
Timeframe Selection:
Set the first timeframe to your trading timeframe
Set the second timeframe to your trend timeframe
Set the third timeframe to your entry timeframe
Range Period Settings:
Default is 5 periods
Increase for more stable readings
Decrease for more responsive readings
Color Interpretation:
Darker colors indicate stronger moves
Look for alignment across timeframes
Watch for extremes in any timeframe
Trading Setups:
Wait for alignment in multiple timeframes
Use extreme readings for counter-trend trades
Combine with other indicators for confirmation
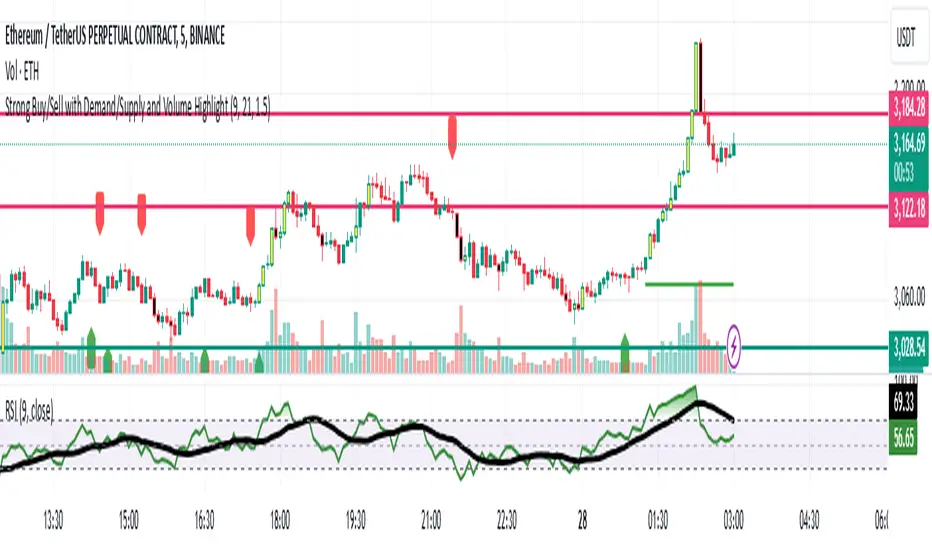
Strong Buy/Sell with Demand/Supply and Volume HighlightStrong Buy/Sell with Demand/Supply and Volume Highlight
This indicator combines key technical elements to provide traders with robust buy and sell signals while highlighting significant market zones and volume trends. It's designed for traders seeking clarity and precision in their decision-making process.
Features:
Dynamic Buy/Sell Signals:
Utilizes the crossover of a fast EMA (default: 9) and a slow EMA (default: 21) to generate reliable buy and sell signals.
Buy signals are marked with green upward labels, while sell signals are marked with red downward labels.
Demand and Supply Zone Detection:
Automatically plots demand (support) and supply (resistance) zones based on recent price movements when buy or sell signals are triggered.
Zones are visually marked with lines for quick identification of key price levels.
Volume Analysis:
Highlights candles with high volume relative to the average 20-period volume (adjustable via the volume multiplier input).
High-volume bullish candles are marked green, and bearish candles are marked red, allowing traders to spot significant market activity instantly.
Inputs:
EMA Periods: Customizable fast and slow EMA settings to adjust signal sensitivity.
Demand/Supply Zones: Option to toggle the visibility of demand and supply levels.
Volume Multiplier: Control the threshold for detecting high-volume candles.
How to Use:
Buy Opportunities: Look for buy signals when the fast EMA crosses above the slow EMA, supported by demand zones and high volume.
Sell Opportunities: Observe sell signals when the fast EMA crosses below the slow EMA, reinforced by supply zones and bearish high-volume candles.
Combine this indicator with your trading strategy to enhance decision-making and improve trade timing.
This indicator is suitable for multiple timeframes and markets, making it a versatile tool for scalpers, day traders, and swing traders.
Daily Buy/Sell Volumeindicator that The Daily Buy/Sell Volume Indicator is a custom-built tool that helps traders track and visualize the buying and selling volumes throughout a trading day. This indicator separates the total volume into two categories:
1. Buy Volume: Calculated when the closing price is higher than the opening price for a given candle. This represents the volume of bullish (buy) activity for the day.
2. Sell Volume: Calculated when the closing price is lower than the opening price for a given candle. This represents the volume of bearish (sell) activity for the day.
Key Features:
• Buy/Sell Volume Calculation: The indicator tracks the buying and selling volumes based on the relationship between the open and close prices of each candle.
• Daily Reset: The indicator resets at the start of each trading day, providing fresh calculations for the daily buy and sell volumes.
• Visual Representation: The buy volume is shown with a green line, while the sell volume is displayed with a red line, making it easy to identify bullish and bearish activity over the course of the day.

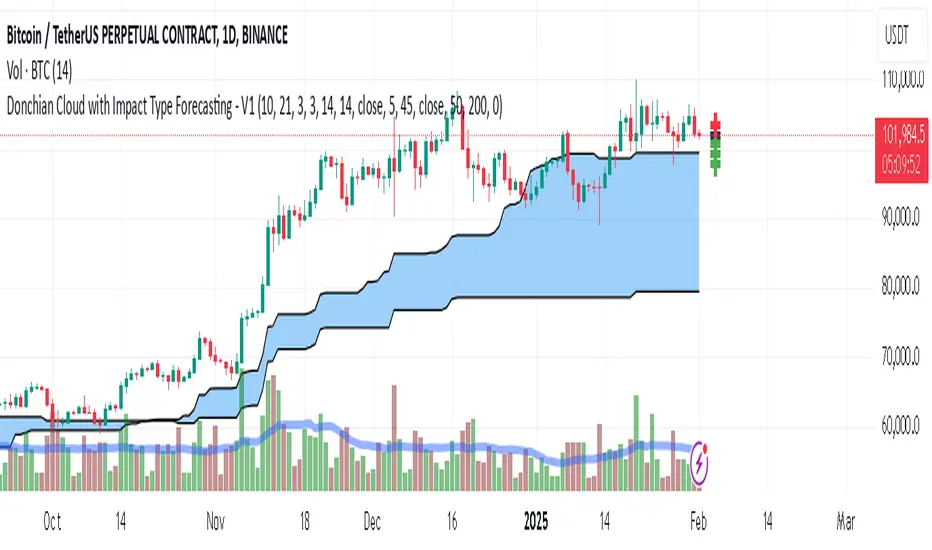
Donchian Cloud-V1The Donchian Cloud-V1 is a technical analysis indicator inspired by the Ichimoku Cloud, but with a twist. It utilizes two Donchian Channel midline calculations to create a cloud-like price zone. This indicator aims to help traders identify potential areas of support and resistance, and also suggests that trades should be avoided when prices are within the cloud.
How it Works?
The Donchian Cloud-V1 calculates two Donchian Channel midlines:
Fast Donchian Channel: This midline is based on a shorter period, making it more responsive to price changes.
Slow Donchian Channel: This midline is based on a longer period, providing a smoother and more stable cloud formation.
The upper and lower bands of the traditional Donchian Channels are discarded, and the midlines become the cloud's upper and lower boundaries.
Interpretation
Price Above the Cloud: A price move above the cloud can be interpreted as a bullish signal, suggesting potential upward momentum.
Price Below the Cloud: A price move below the cloud can be interpreted as a bearish signal, suggesting potential downward momentum.
Price Within the Cloud: The indicator advises against taking any trades when the price is within the cloud itself, as the market may be unclear or ranging.
Benefits of Using the Donchian Cloud-V1
Visually Appealing: The cloud can provide a clear and concise view of potential support and resistance zones.
Customizable: The lengths of the fast and slow Donchian Channels can be adjusted to suit your trading style and preferred timeframe.
Complements Other Indicators: The Donchian Cloud-V1 can be used in conjunction with other technical indicators to strengthen trade signals.
Limitations to Consider
Lagging Indicator: Like many technical indicators, the Donchian Cloud-V1 is based on past price data and may not always perfectly predict future price movements.
False Signals: The cloud can generate false signals, especially in volatile markets.
Not a Standalone Strategy: The Donchian Cloud-V1 should ideally be used alongside other trading strategies and risk management techniques.
The Donchian Cloud-V1 is a valuable tool for traders who want to identify potential support and resistance zones and avoid making trades during periods of market uncertainty. Remember, it's important to backtest and paper trade any indicator before using it with real capital.