AI AAdaptive Supertrend ChannelAI Supertrend Channel – The Adaptive Trend System
Beyond Basic Supertrend: An Intelligent Trading Framework
The AI Adaptive Supertrend Channel transcends traditional trend following indicators by delivering a self-optimizing trading system. Its core innovation is a triple-adaptive engine that automatically adjusts channel width based on real-time market conditions:
Market Efficiency Detection – Widens during clean trends, tightens in choppy ranges
Normalized Volatility – Scales appropriately to any asset's price level
Dynamic Momentum Response – Expands aggressively during powerful directional moves
The Result: A smarter tool that reduces false signals in consolidation while giving trends ample room to run—eliminating the constant parameter tweaking required by static indicators.
Visual Signal Framework & Strategic Applications
Channel Architecture:
Primary Trend Line (Thick Green/Red): Your dynamic trailing stop and core trend indicator. Green signals an uptrend (buying bias), Red signals a downtrend (selling bias).
Upper & Lower Bands: Form a dynamic support/resistance channel around the trend.
Mid-Line: A critical mean reversion level and the trigger for key early signals.
Trading Signals & Strategic Meaning:
Primary Signal: Momentum Diamonds (High Conviction)
💎 Green Diamond (Higher High): Price closes above the Upper Band after making a new high. Signals strong bullish momentum continuation. Ideal for adding to long positions or entering new longs in an established uptrend.
💎 Red Diamond (Lower Low): Price closes below the Lower Band after making a new low. Signals strong bearish momentum continuation. Ideal for adding to short positions or entering new shorts in a downtrend.
Secondary Signal: Mid-Line Crosses (Early Action)
🔼 Green Triangle (Bullish Mid-Line Cross - bullMidCross): Price crosses above the Mid-Line. This is an early bullish pullback signal within a larger uptrend or a potential early reversal sign in a downtrend. Use for early entries or to confirm the end of a bearish pullback.
🔽 Red Triangle (Bearish Mid-Line Cross - bearMidCross): Price crosses below the Mid-Line. This is an early bearish pullback signal within a larger downtrend or a potential early warning of weakness in an uptrend. Use for early short entries or to take profits on longs.
Practical Trading Strategies
Trend Following: Align trades with the Primary Trend Line color. Use the line itself as a dynamic stop-loss. The Momentum Diamonds confirm the trend's strength.
Pullback Trading: Use the Mid-Line Cross triangles (bullMidCross/bearMidCross) to identify high-probability entries during trend retracements. The channel bands provide natural profit targets.
Breakout Confirmation: A Momentum Diamond following a period of consolidation often confirms a genuine breakout, offering a signal to enter with the new momentum.
Optimal Settings Guide
Default (Universal)
For most markets, timeframes
ATR: 13 | ER: 144 | Channel Width: 0.7
Volatility Factor: 100 | Vol MA: HMA | Trend MA: EMA
Day Trading (Fast, Responsive)
*15M-1H charts, scalping*
ATR: 8 | ER: 89 | Channel Width: 0.6
Volatility Factor: 120 | Vol MA: EMA | Trend MA: WMA
*Swing Trading (Smooth, Conservative)*
*Daily-Weekly, position trading*
ATR: 21 | ER: 200 | Channel Width: 0.9
Volatility Factor: 80 | Vol MA: HMA | Trend MA: LINREG
Channel Width × Factor
0.5-0.7 → Tighter (more signals, less room)
0.8-1.2 → Wider (fewer signals, more room to run)
Volatility Regime Factor
50-80 → Less sensitive to volatility (stable markets)
100-150 → More sensitive (volatile markets like crypto)
Base ATR Length
8-13 → Faster signals (lower timeframes)
17-21 → Smoother signals (higher timeframes)
Quick Adjustments:
Whipsaws → Increase Channel Width × Factor
Lagging → Decrease ATR Length
Volatile markets → Increase Volatility Regime Factor
Start with Default, adjust one parameter at a time based on your market and trading style.
Breakdown

Pristine Adaptive Alpha ScreenerThe Pristine Adaptive Alpha Screener allows users to screen for all of the trading signals embedded in our premium suite of TradingView tools🏆
▪ Pristine Value Areas & MGI - enables users to perform comprehensive technical analysis through the lens of the market profile in a fraction of the time!
▪ Pristine Fundamental Analysis - enables users to perform comprehensive fundamental stock analysis in a fraction of the time!
▪ Pristine Volume Analysis - organizes volume, liquidity, and share structure data, allowing users to quickly gauge the relative volume a security is trading on, and whether it is liquid enough to trade
💠 How is this Screener Original?
▪ The screener allows users to screen for breakouts, breakdowns, bullish and bearish trend reversals, and allows users to narrow a universe of stocks based purely on fundamentals, or purely on technicals. One screening tool to support an entire technofundamental workflow!
💠 Signals Overview
Each of the below signals serves one of two purposes:
1) A pivot point to be used as a long or short entry
2) A tool for narrowing a universe of stocks to a shorter list of stocks that have a higher potential for superperformance
▪ HVY(highest volume in a year) -> Featured in Pristine Volume Analysis -> Entry signal
▪ Trend Template -> Inspired by Mark Minervini's famous trend filters -> Tool for narrowing a universe of stocks to a shorter list with a higher potential for superperformance
▪ Rule of 100 -> Metrics from Pristine Fundamental Analysis -> Tool for narrowing a universe of stocks to a shorter list with a higher potential for superperformance
▪ Bullish 80% Rule -> Featured in Pristine Value Areas & MGI -> Long entry signal -> Trend Reversal
▪ Bearish 80% Rule -> Featured in Pristine Value Areas & MGI -> Short entry signal -> Trend Reversal
▪ Break Above VAH -> Featured in Pristine Value Areas & MGI -> Long entry signal -> Trend Continuation
▪ Break Below VAL -> Featured in Pristine Value Areas & MGI -> Short entry signal -> Trend Continuation
💠 Signals Decoded
▪ HVY(highest volume in a year)
Volume is an important metric to track when trading, because abnormally high volume tends to occur when a new trend is kicking off, or when an established trend is hitting a climax. Screen for HVY to quickly curate every stock that meets this condition.
▪ Trend Template
Mark Minervini's gift to the trading world. Via his book "Think and Trade Like a Stock Market Wizard". Stocks tend to make their biggest moves when they are already in uptrends, and the Minervini Trend template provides criteria to assess whether a stock is in a clearly defined uptrend. Filter for trend template stocks using our tool.
▪ Rule of 100
Pristine Capital's gift to the trading world. The rule of 100 filters for stocks that meet the following condition: YoY EPS Growth + YoY Sales Growth >= 100%. Stocks that meet this criteria tend to attract institutional investors, making them strong candidates for swing trading to the long side.
💠 Market Profile Introduction
A Market Profile is a charting technique devised by J. Peter Steidlmayer, a trader at the Chicago Board of Trade (CBOT), in the 1980's. He created it to gain a deeper understanding of market behavior and to analyze the auction process in financial markets. A market profile is used to analyze an auction using price, volume, and time to create a distribution-based view of trading activity. It organizes market data into a bell-curve-like structure, which reveals areas of value, balance, and imbalance.
💠 How is a Value Area Calculated?
A value area is a distribution of 68%-70% of the trading volume over a specific time interval, which represents one standard deviation above and below the point of control, which is the most highly traded level over that period.
The key reference points are as follows:
Value area low (VAL) - The lower boundary of a value area
Value area high (VAH) - The upper boundary of a value area
Point of Control (POC) - The price level at which the highest amount of a trading period's volume occurred
If we take the probability distribution of trading activity and flip it 90 degrees, the result is our Pristine Value Area!
Market Profile is our preferred method of technical analysis at Pristine Capital because it provides an objective and repeatable assessment of whether an asset is being accumulated or distributed by institutional investors. Market Profile levels work remarkably well for identifying areas of interest, because so many institutional trading algorithms have been programmed to use these levels since the 1980's!
The benefits of using Market Profile include better trade location, improved risk management, and enhanced market context. It helps traders differentiate between trending and consolidating markets, identify high-probability trade setups, and adjust their strategies based on whether the market is in balance (consolidation) or imbalance (trending). Unlike traditional indicators that rely on past price movements, Market Profile provides real-time insights into trader behavior, giving an edge to those who can interpret its nuances effectively.
▪ Bullish 80% Rule
If a security opens a period below the value area low , and subsequently closes above it, the bullish 80% rule triggers, turning the value area green. One can trade for a move to the top of the value area, using a close below the value area low as a potential stop!
In the below example, HOOD triggered the bullish 80% rule after it reclaimed the monthly value area!
HOOD proceeded to rally through the monthly value area and beyond in subsequent trading sessions. Finding the first stocks to trigger the bullish 80% rule after a market correction is key for spotting the next market leaders!
▪ Bearish 80% Rule
If a security opens a period above the value area high , and subsequently closes below it, the bearish 80% rule triggers, turning the value area red. One can trade for a move to the bottom of the value area, using a close above the value area high as a potential stop!
ES proceeded to follow through and test the value area low before trending below the weekly value area
▪ Break Above VAH
When a security is inside value, the auction is in balance. When it breaks above a value area, it could be entering a period of upward price discovery. One can trade these breakouts with tight risk control by setting a stop inside the value area! These breakouts can be traded on all chart timeframes depending on the style of the individual trader. Combining multiple timeframes can result in even more effective trading setups.
RBLX broke out from the monthly value area on 4/22/25👇
RBLX proceeded to rally +62.78% in 39 trading sessions following the monthly VAH breakout!
▪ Break Below VAL
When a security is inside value, the auction is in balance. When it breaks below a value area, it could be entering a period of downward price discovery. One can trade these breakdowns with tight risk control by setting a stop inside the value area! These breakouts can be traded on all chart timeframes depending on the style of the individual trader. Combining multiple timeframes can result in even more effective trading setups.
CHWY broke below the monthly value area on 7/20/23👇
CHWY proceeded to decline -53.11% in the following 64 trading sessions following the monthly VAL breakdown!
💠 Metric Columns
▪ %𝚫 - 1-day percent change in price
▪ YTD %𝚫 - Year-to-date percent change in price
▪ MTD %𝚫 - Month-to-date percent change in price
▪ MAx Moving average extension - ATR % multiple from the 50D SMA -Inspired by Jeff Sun
▪ 52WR - Measures where a security is trading in relation to it’s 52wk high and 52wk low. Readings near 100% indicate close proximity to a 52wk high and readings near 0% indicate close proximity to a 52wk low
▪ Avg $Vol - Average volume (50 candles) * Price
▪ Vol RR - Candle volume/ Avg candle volume
💠 Best Practices
Monday -> Friday Post-market Analysis
1) Begin with a universe of stocks. I use the following linked universe screen as a starting point: www.tradingview.com
2) Screen for the HVY signal -> Add those stocks to a separate flagged (colored) watchlist
3) Screen for the Bullish 80% Rule signal -> Add those stocks to a separate flagged (colored) watchlist
4) Screen for the Break Above VAH Signal -> Add those stocks to a separate flagged (colored) watchlist
5) Screen for the Break Below VAL Signal -> Add those stocks to a separate flagged (colored) watchlist
6) Screen for the Bearish 80% Rule Signal -> Add those stocks to a separate flagged (colored) watchlist
7) Screen for the Bearish 80% Rule Signal -> Add those stocks to a separate flagged (colored) watchlist
8) Screen for the Trend Template Signal -> Add those stocks to a separate flagged (colored) watchlist
9) Toggle through each list and analyze each stock chart using the Supercharts tool in TradingView
10)Record the number of stocks in each list as a way of analyzing market conditions
Weekend Analysis
1) Begin with a universe of stocks. I use the following linked universe screen as a starting point: www.tradingview.com
2) Screen for the Rule of 100 Signal. Use this as a starting point for deeper fundamental and/or thematic and/or technical research
3) Screen for stocks that meet specific performance thresholds, such as YTD %𝚫 > 100% etc
💠 Get Creative
▪Users have the ability to layer signals on top of each other when screening. To do so, filter for a signal, and then filter your new list by another signal! Play around with the screener, and find what works best for you!

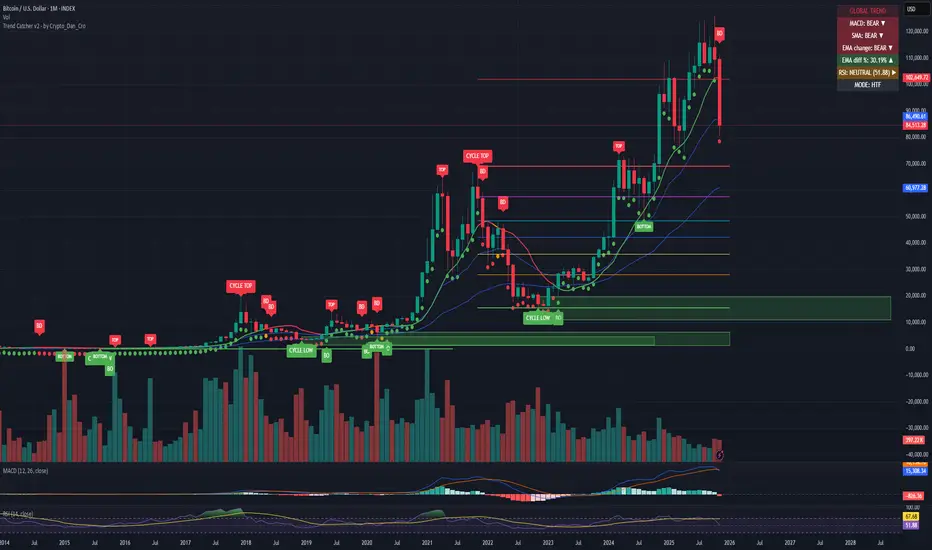
Trend Catcher - Alpha v2 - by Crypto_Dan_CroIf you want to get this indicator, contact me on
X handle: @crypto_dan_cro
What is Trend Catcher v2?
This is the only indicator you need ;)
This indicator is a proprietary market analysis system designed to identify high-probability trading zones by synchronizing multiple layers of market structure, momentum behaviour and cyclical dynamics.
It dynamically adapts to changing market conditions by evaluating:
- macro trend alignment
- structural price positioning
- momentum acceleration & deceleration
- volatility-based reaction zones
- cycle maturity levels
The system filters out low-quality setups and highlights only areas where multiple hidden conditions align, providing:
- trend continuation signals
- structural shift detection
- cycle-based expansion targets
- adaptive support & resistance mapping
Rather than reacting to price alone, the indicator anticipates areas where market psychology historically shifts, allowing traders to position themselves ahead of major moves.
Core philosophy:
This tool does not attempt to predict the market — it tracks the underlying pressure points where probability favours expansion or exhaustion.
It functions as:
- a trend alignment engine
- a cycle decoder
- a volatility interpreter
- a structure validation system
What it gives the user:
- Clear visual guidance without overloading the chart
- Objective market context independent of emotion
- Early trend recognition
- Cycle-aware price targeting
- Decision zones instead of random entries
Ideal for:
- traders who trade structure, not noise
- investors who respect market cycles
- strategists focused on probability over prediction
- disciplined entries & exits
In short:
It is a market interpretation framework built for traders who think two steps ahead.
Contains:
1. Higher Timeframe mode (Monthly / Weekly) on all timeframes
2. Current Chart Timeframe mode
3. Global Trend via BTC MACD
4. SMA
5. EMA
6. BO (Break Out), BD (Break Down) signals
7. TOP & BOTTOM Detection
8. Support & Resistance Zones
9. RSI confirmation
10. Smart Info Panel (Global trend, MACD, SMA, EMA, RSI statuses - Bull, Bear, Neutral)
11. Monthly timeframe (Fibbonaci Retracement levels)
12. Monthly timeframe (all Cycle tops, and Cycle bottoms)
Crypto markets are volatile, if you choose to use this indicator for trading, you are doing it on your own. Crypto_dan_cro is not responsible for any profits or losses created by using this Indicator.
Breakdown Sniper [Riz]Breakdown Sniper is a complete structural-based price-action system designed to identify and validate three major setups
1. Failed Breakdowns (FBD)
2. Breakouts / Breakdowns (BO)
3. Back-Tests (BT)
The script analyzes swing structure, undercuts, reclaim behavior, channel bias, support/resistance levels, and a multi-layer confluence engine to highlight high-quality long/short signals.
It also includes trade management, target projections, trailing logic, risk models, and an optional dashboard for clarity.
Core Concepts Behind the System
1. Pivot Structure & New Low/High Logic
Breakdown Sniper continuously detects pivot highs and lows using user-defined left/right bars.
These pivots are used to determine
⦁ Recent structural lows/highs
⦁ Undercuts (for failed breakdowns)
⦁ Structural breaks (for FBO/BO setups)
This provides the foundation for all three setup types.
2. Failed Breakdown (FBD) Detection
The primary logic of the script is to detect failed breakdowns, which follow this sequence:
1. Identify an initial pivot low
2. Price undercuts that low
3. Price reclaims the level by a specified number of points
4. Optional: new higher low print confirming strength
5. Once confirmed, the script calculates:
⦁ Entry trigger price
⦁ Stop placement (multiple options: below undercut, below initial low, ATR-based, fixed)
⦁ Three profit targets based on risk multiples
The reverse logic is applied for failed breakouts (FBO).
3. Breakouts & Breakdowns (BO)
The system also captures momentum breakouts/breakdowns defined by:
⦁ Price breaking major support/resistance
⦁ Bar-level strength (close vs range)
⦁ ATR-based expansion
⦁ Holding above/below breakout level for a user-defined number of bars
If confirmed, the script projects T1/T2/T3 targets and stop placement automatically.
4. Back-test Setups (BT)
After a confirmed breakout/breakdown, the script monitors for a return to the breakout level, within a percentage tolerance.
If a clean retest occurs:
⦁ A BT Long or BT Short setup is generated
⦁ Risk and target calculations are performed automatically
This allows identifying continuation setups after strong breaks.
Channel & Levels System (Support/Resistance Engine)
The script builds a hybrid S/R and environment model using:
⦁ Regression channel OR
⦁ Donchian, Keltner, Bollinger channels (user-selectable)
The channel provides:
⦁ Upper/Lower boundaries
⦁ Midline
⦁ Trend bias based on slope
Additionally, a multi-touch support/resistance detector clusters pivot-based levels and scores them by:
⦁ Touch count
⦁ Recency
⦁ Age
⦁ Whether they classify as major levels
This explains where reversals and breakouts are most likely.
Confluence Engine
Every Long/Short signal receives a 0–100 score derived from:
⦁ Market structure: HH/HL or LL/LH
⦁ Trend filter (EMA-based)
⦁ Volatility conditions (ATR range requirements)
⦁ Session bias (Asian / London / New York / Overlap)
⦁ Volume expansion
⦁ Higher-timeframe trend (optional)
⦁ Location inside channel
⦁ Distance to nearest S/R
⦁ Setup-type priority (FBD/BO/BT)
Users can require a minimum score before a signal becomes valid.
Trade Management Logic
Once a trade triggers, the indicator handles:
⦁ Entry execution confirmation
⦁ Stop loss tracking
⦁ Three independent profit targets
⦁ Optional scale-ins
⦁ ATR-based trailing stop
⦁ Risk calculations
⦁ Real-time PnL monitoring
The script does not execute live trades — it only visualizes management levels for analysis.
Visual Components
Breakdown Sniper plots:
⦁ Channels & fills
⦁ Auto-detected S/R levels
⦁ Pivot highs/lows
⦁ Buy/Sell markers
⦁ Entry/Stop/Targets
⦁ Trade dashboard (optional)
⦁ Equity curve (optional)
Everything is toggle-based for clean charting.
How To Use the Indicator
Recommended Use-Case
⦁ Futures (ES/NQ/CL/RTY)
⦁ Indices
⦁ Crypto
⦁ FX
Works well on:
⦁ 5m / 15m / 1H
Signals do not repaint because pivots and reclaim sequences require bar completion.
Basic Usage Steps
1. Enable the setups you want to trade: FBD, BO, BT
2. Optionally turn on filters:
⦁ Trend filter
⦁ Volatility filter
⦁ Market structure filter
⦁ MTF trend filter
3. Wait for a valid long/short signal with sufficient confluence
4. Follow the plotted entry level, stop, and targets
5. Use the dashboard to monitor performance of each setup type
Important Notes
This is a structural/price-action tool, not a prediction model
No guarantee of profitability is provided
The indicator is educational and analytical
Always use independent confirmation and risk management
Disclaimer
This script is for education and analysis. It does not provide financial advice. Markets involve risk. Past behavior of any pattern or study does not imply future results. You are responsible for your own decisions.

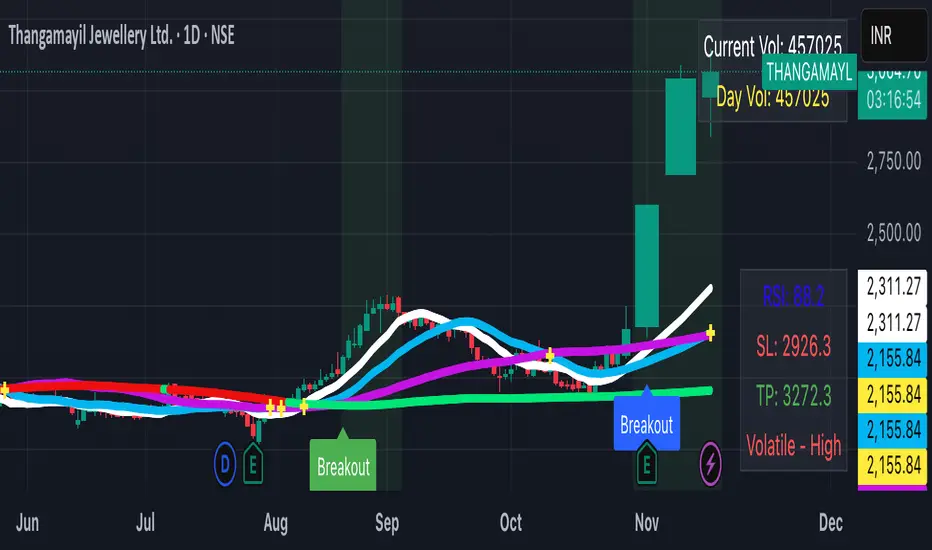
Blavk Terminal By Blavk Core Capitals- Open📘 Blavk Terminal
Multi-Indicator Trend & Momentum Detection System
Overview:
The Blavk Terminal indicator helps traders identify breakout and breakdown zones, market trend direction, and volatility conditions. It combines multiple well-known analytical concepts to generate reliable visual and alert-based trading signals.
🔍 Core Concepts
Trend Analysis: Uses layered moving averages (short to long-term) to identify price direction and trend strength.
Momentum Detection: Applies RSI-based logic to highlight potential breakout (bullish) and breakdown (bearish) areas.
Volatility Filter: Integrates ATR-based dynamic ranges to show stop-loss, target, and volatility status, helping traders manage positions more efficiently.
Volume Tracking: Displays both current candle volume and daily cumulative volume to assess participation strength.
⚙️ How to Use
On 15-minute charts, it can assist with swing trading and short-term momentum entries.
On daily, it helps with position or long-term holdings by confirming broader trend direction.
Traders can monitor green breakout/breakdown labels, confirm trend bias using moving averages, and use the displayed ATR levels for risk management.
💡 Conceptual Summary
Blavk Terminal integrates trend-following (moving averages), momentum confirmation (RSI), and volatility control (ATR) into a single tool.
This combination helps identify high-probability opportunities and supports decision-making across both short-term swing trades and long-term positional holds.
⚠️ Disclaimer
This indicator is for educational and analytical purposes only. It does not provide financial advice or guaranteed outcomes. Always backtest and apply risk management before live trading.
@blavkcorecapitals
SmartPlusSmartPlus
Overview
The SmartPlus indicator is a complete framework for intraday traders. It combines key market reference points (VWAP, moving averages, and the first 15-minute high/low range) with predictive levels based on historical daily moves. Together, these elements allow traders to build directional bias, spot breakouts, and manage risk throughout the session.
Key Features
1. VWAP (Volume-Weighted Average Price)
- Plots the intraday VWAP in real time.
- VWAP acts as a central “fair value” reference point for institutional order flow.
- Price trading above VWAP generally suggests bullish bias, while below VWAP leans bearish.
2. Exponential Moving Averages (EMAs)
- Two configurable EMAs are included:
- Fast EMA (default: 21 periods)
- Slow EMA (default: 34 periods)
- Each EMA is plotted with a single, user-selectable color for clarity.
- Crossovers or alignment between price, VWAP, and EMAs help define market structure.
3. Smart Bar Coloring
- Candles automatically change color when conditions align:
- Bull Zone: Price above VWAP, Fast EMA, and Slow EMA.
- Bear Zone: Price below VWAP, Fast EMA, and Slow EMA.
- Fluorescent bar coloring helps highlight momentum zones visually without additional analysis.
4. First 15-Minute High/Low/Mid (Automatic)
- Automatically detects the first 15 minutes of each new trading day (no manual input required).
- Plots horizontal lines for:
- First 15-Minute High (green)
- First 15-Minute Low (red)
- Midpoint of that range (gray)
- Once the initial 15-minute window ends, these levels remain projected throughout the session as breakout or support/resistance zones.
- Alerts trigger when price breaks above the high or below the low after the window.
5. Daily Support/Resistance Forecast
- Uses a rolling lookback of recent daily ranges (default: 126 days).
- Tracks average up moves and down moves from the daily open.
- Optionally incorporates standard deviation for wider confidence bands.
- Plots forecast levels above/below the current day’s open for reference.
Trading Logic (How to Use)
- Bullish Bias:
- Price is above VWAP, above both EMAs, and ideally above the first 15-minute high.
- This setup suggests trend continuation or breakout opportunities on the long side.
- Bearish Bias:
- Price is below VWAP, below both EMAs, and ideally below the first 15-minute low.
- This setup suggests downward pressure or breakout opportunities on the short side.
- Neutral / Caution Zone:
- Price caught between VWAP, EMAs, or inside the 15-minute range often signals indecision.
- Best to wait for confirmation or breakout before committing to trades.
Expectations After Using It
- The script provides context and structure, not trading signals.
- It highlights where price is relative to meaningful market levels so traders can act with greater confidence.
- Combining VWAP, EMAs, and the 15-minute breakout framework helps traders stay aligned with the market’s natural rhythm.
Disclaimer
This script is a tool for market analysis and educational purposes only.
It does not constitute financial advice, trading recommendations, or guaranteed profitability.
Markets are inherently risky, and past patterns do not ensure future results.
Always combine this tool with sound risk management, personal research, and professional guidance before making any trading decisions.

Time-Weighted Price Action IndicatorThe Time-Weighted Price Action Indicator is a simple yet effective tool designed to detect consolidation zones based on time duration and highlight potential reversal points using a contrarian breakout logic. Instead of following traditional breakout strategies, this indicator aims to capitalize on false breakouts and reversal entries.
How It Works
• The indicator identifies a price range (zone) using a configurable lookback period.
• If the price remains within this range for a specified number of bars (threshold), a consolidation zone is confirmed.
• Once a breakout or breakdown from this zone occurs, the indicator triggers a reversed signal — suggesting a potential reversal instead of a trend-following entry.
• Support and resistance levels are marked visually, and BUY/SELL labels are plotted when price re-enters the zone, indicating potential exhaustion or traps.
Key Features
• ✅ Time-based consolidation detection
• ✅ Contrarian signal logic (Buy at breakdowns, Sell at breakouts)
• ✅ Dynamic zone plotting with support/resistance visualization
• ✅ Auto-reset after each breakout for fresh zone detection
• ✅ Visual labels and alerts for BUY/SELL signals
How to Use
• Ideal for range-bound markets or identifying trap zones around support/resistance.
• Use in conjunction with volume, momentum, or trend filters to refine entries.
• Can complement mean reversion strategies or be used as a signal confirmation tool.
Why This Combination?
This approach blends time-based consolidation logic with a contrarian price action perspective, offering traders a different lens to analyze markets. Instead of blindly following breakouts, it highlights areas where price rejections and false breakouts often occur — common in algorithm-driven markets.
Why It’s Worth Using
This indicator helps you stay ahead of trap zones, identify reversal spots, and understand price behavior in consolidation zones — a critical edge, especially in sideways or choppy markets. It adds context to price movement, helping traders avoid common breakout failures.
Note:
• No performance guarantees or exaggerated claims.
• No solicitation or promotional language used.
• This is a free, open-source educational tool meant to aid price action understanding.

Breakout/Breakdown Indicator (30 Min Range) by InvestYourAsset👉The indicator provided here is a technical analysis indicator for TradingView users that identifies potential breakout and breakdown opportunities on the initial 30-minute range in every trading session.
👉The indicator high and low of the initial 30-minute period and plotting them as horizontal lines on the chart. The high is marked in green line and the low is marked in red line.
📈The indicator then generates buy and sell signals based on whether the current close price crosses above or below the previous 30-minute high and low, respectively.
📢The indicator also has two inputs:
👉 sessionStartHour : The hour at which the trading session begins. The default value is 9, However users can change the time according to their own trading style.
👉 sessionStartMinute : The minute at which the trading session begins. The default value is 0.
These inputs can be used to adjust the indicator to the specific trading session that you are interested in.
✅How to use the Indicator:
👉To use the 30 Minute Breakout/Breakdown Indicator, simply add it to your chart and configure the inputs to your liking. Once the indicator is added to the chart, it will plot the 30-minute high and low as horizontal lines, as well as generate buy and sell signals based on the current close price.
✅Here is a step-by-step guide:
📈Open TradingView and select the chart that you want to add the indicator to.
📈Click on the "Indicators" tab and search for "30 Minute Breakout/Breakdown Indicator by InvestYourAsset".
📈Click on the indicator to add it to your chart.
📈Configure the inputs to your liking. The default values are typically fine, but you can experiment with different values to see what works best for you.
📈Once you are satisfied with the settings, click on the "Apply" button.
📈The indicator will now be displayed on your chart. You will see two horizontal lines representing the previous 30-minute high and low, as well as triangles representing buy and sell signals.
✅How to interpret the signals:
📈Buy signal : A buy signal is generated when the current close price crosses above the previous 30-minute high. This suggests that the price is likely to continue moving higher in the short term.
📈Sell signal : A sell signal is generated when the current close price crosses below the previous 30-minute low. This suggests that the price is likely to continue moving lower in the short term.
👉Traders should remember that the present indicator is just one tool that can be used to identify potential trading opportunities. It is important to use other technical analysis tools and risk management techniques to confirm your trading signals before entering any trades.
✅Things to consider while using the indicator:
📈Look for buy signals in an uptrend and sell signals in a downtrend. This will increase the likelihood of your trades being successful.
📈Place your stop losses below the previous 30-minute low for buy signals and above the previous 30-minute high for sell signals. This will help to limit your losses if the trade goes against you.
📈Consider taking profits at key resistance and support levels. This will help you to lock in your profits and avoid giving them back to the market.
Follow us for timely updates regarding indicators that we may publish in future and give it a like if you appreciate the indicator.

The Opening Range / First Bar By Market Mindset - Zero To EndlesThe script shows the opening range of the instrument based on different resolutions and timeframes.
Inputs :
1. Resolution
It decides the calculation frequency of the script.
In Auto resolution, Standard values have been used.
2. Timeframe
It decides the timeframe for the OHLC values.
By default, it will use the chart timeframe and so chart OHLC values.
3. Lookback
It decides the no. of ranges shown on the chart.
Middle Line can be hidden from the settings.
The script can be used for any instrument and on any timeframe.
If price is above the opening range or the middle line, a trader should look for long opportunities.
If price is below the opening range or the middle line, a trader should look for short opportunities.
A sideways or choppy move is exoected if Middle line is crossed again and again.
For trading, wait for atleast 1st bar to close. and let the opening range build up first.
Happy Trading

Drip's 11am rule breakout/breakdown (OG)This indicator is based on Drippy2hard's 11:30 am (EST) rule.
In simple terms the rule states that:
If a trending stock makes a new high after 11:15-11:30am EST, there is a 75% chance of closing within 1% of High of day (HOD). Same applies for downtrend.
Please note:
Not all stocks will abide by this, this is backtested on stocks with avg daily volume > 2M and mostly mega cap stocks which have liquid option chains. The backtesting results show very promising results on $SPY/ $SPX so it is advised to trade $SPY/ $SPX using this indicator over any other stocks.
Although the name suggests 11 AM rule, the backtesting shows higher win rate for 11:30 AM so please select that option in the settings.
As always, no indicator is perfect and please follow your risk management and understand that indicators are tools to aid your trading and by no means they are supposed to work as intended in all scenarios
How the script works
1. A HOD/LOD zone is identified based on regular session (9:30am-11:30am) EST. Users can select cut off time to 11AM in the settings. These will be indicated on chart after 11/11:30pm depending on what user selected
2. If the stock breaks above the HOD and the ADX is showing strong momentum to upside then the candlesticks will start showing neon color, if the trend based on moving averages and candle closing is also bullish then the indicator will show trend arrows under the candle indicating to stay in the trade. Same applies for break below LOD, only the colors will change to represent downtrend.
3. An optional cloud is also shown if the trend is developed. The cloud can be used as trail stop or re entry point as long as it is displayed on chart
How to use the indicator in trading
In general, there are three scenarios which are trade worthy
1. If the stocks breaks out above the HOD zone and up trend develops or the stocks breaks below the LOD zone and downtrend develops. See images below
2. You can also use the LOD/HOD zone as demand/ supply if the Price action is range bound like this example below
Thanks for reading, please give thumbs up if you like using it! Please post comments on how to use it.

Stockbee Momentum BurstThis is a script to color code bars based on the bullish- and bearish combination.
Bullish Combination
Percent: Price >= 4% from yesterday and Volume today > Yesterday
Dollar: Price >= 0.9 dollar from open
Base Requirements
- Price > Yesterday's close
- Price > Open
- Price is within 30% of high
- Todays price range >= Yesterdays price range
- Yesterday's move <= 2%
- Volume >= 100 000
Bearish Combination
Percent: Price <= 4% from yesterday and Volume today > Yesterday
Dollar: Price <= 0.9 dollar from open
Base Requirements
- Price < Yesterday's close
- Price < Open
- Price is within 30% of low
- Todays price range >= Yesterdays price range
- Yesterday's move >= -2%
- Minimum volume for each of last 3 days >= 100 000
Momentum Filter
These are based on the 10 and 20 EMA crossover, where the former above would indicate upward momentum and below downward momentum. This can help to narrow down the color code to continuation phases. The linked option will override all other momentum filters, bullish candles will be displayed when EMA 10 > 20 and bearish candles when EMA 10 < 20.

GDP BreakdownProvides an easy way for viewing the sub sections that make up a country's total GDP. Not all countries provide data for each subsector (Agriculture, Construction, Manufacturing, Mining, Public Administration, Services, Utilities). Only countries that provide complete data are able to be selected in the settings. If I've missed any please let me know in the comment section so they can be added. This is much easier than having to individually selecting each ticker for each country when looking to compare how diversified an economy is.

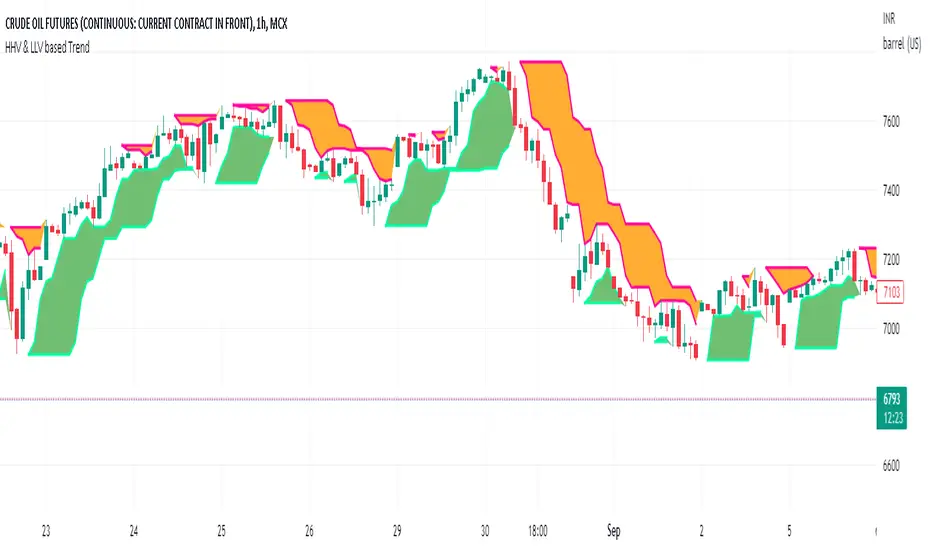
HHV & LLV based TrendHHV and LLV gives good information about the trend.
A trend will be visible when its seen with fast and slow line cross
UP trend: HHV_fastline = HHV Slowline and LLVfastline crossover LLVSlowline
DOWN trend: HHV_fastline crossunder HHV Slowline and LLVfastline !=LLVSlowline
Attempted to plot the same with multiple options to choose fastline length, slowline length, Multi time frame.
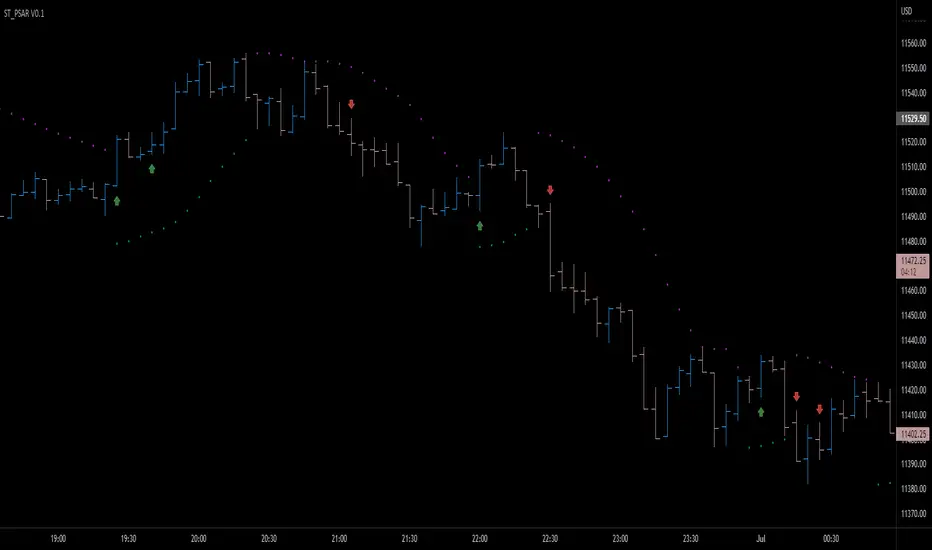
Parabolic SAR breakout [SugarTrader77]Parabolic SAR with:
- On chart visuals
- Alarms
to notify when price breaks up/down the SAR flipping point level
Created only for community testing only. Trade at your own risk.
Volume Bar Breakout and Breakdown IndicatorVolume shows strength of a movement and highest volume shows the region that pushed price to certain extent with full strength. Breakout or Breakout of the highest volume bar range shows continuity further push by sellers or buyers indicating a trend continuation for a small period if not for long duration. Entries can be taken once signal is generated with stoploss as recommended.
Guidelines:
Don't trade if range is too large
Don't trade if Breakdown or Breakdown candle body / range is too large or if there is high volatility
Use additional indicator to get the idea of overall trend analysis

Pivot Support & ResistanceHere signals are based on the pivot high and pivot lows. Factors taken into account in understanding the breakout or breakdown are:
volume
candle bar is not opening candle
must be near pivot high or low
Recommendation:
Use once candle closes else you might get trapped in certain cases so be careful

SOFTENED RSI DİFFRACTİON BANDSThis indicator takes the moving averages of the rsi values, gives signals in the lower and upper breaks, prevents the rsi upper threshold from signaling above a certain rsi value, as the rsi upper threshold value increases, the number of signals increases and the number of risky signals also increases. As the rsi upper threshold value decreases, the signals decrease and become better quality You can determine the most appropriate threshold value according to the commodity type.
bu indikatör rsi değerlerinin hareketli ortalamalarını alır alttan ve üstten kırılımlarında sinyal verir rsi üst eşiği belli bir rsi değerinin üstünde sinyal vermesini engeller rsi üst eşik değeri arttıkça sinyal sayısı artar aynı zamanda riskli sinyal sayısıda artar rsi üst eşik değeri azaldıkça sinyaller azalır ve daha kaliteli hale gelir emtia tipine göre en uygun eşik değerini belirleyebilirsiniz.
Ichimoku breakoutIf you use Ichimoku Cloud strategies, this indicator is very useful for you!
This code indicates the candles that break the ichimoku cloud in both directions!
conversion line, base line and lagging span are disable by default, you can enable it from settings window.
green triangles under the candles with green backgrounds show break out the red clouds.
red triangles at the top of the candles with red backgrounds show break out the red clouds.
you can set alerts to be notified when an Ichimoku Cloud is broken.

Breakout FinderHelo All,
I got many requests for a Breakout script and here it's. This script searches the breakouts/breakdowns and draw square if there is one.
The options:
"Period" is used to find Pivot Points
"Max Breakout Length" is the maximum length to search breakouts
"Threshold Rate %" is channel width of the breakout area. calculated using highest/lowest of last 300 bars.
"Minimum Number of Tests" is the minimum number of tests that the Price tried to break the S/R level
and some options for coloring and linestyle
Lets see some examples:
in this example "Minimum Number of Tests" is 2 so the Price must have tested to break resistance area 2 times and then it breaks it as seen in the screenshot:
in following example Threshold rate is %10, so the channel width is very big:
as you can see in followinf screenshot you can choose different colors and line styles:
Alerts added ;)
Enjoy!

Matze BreakoutShows 2 different states of breakout:
Arrow = unusual volume, raising volume, positiv rate of change, standard deviation breakout
Bolt = very unusual volume, very high standard deviation breakout

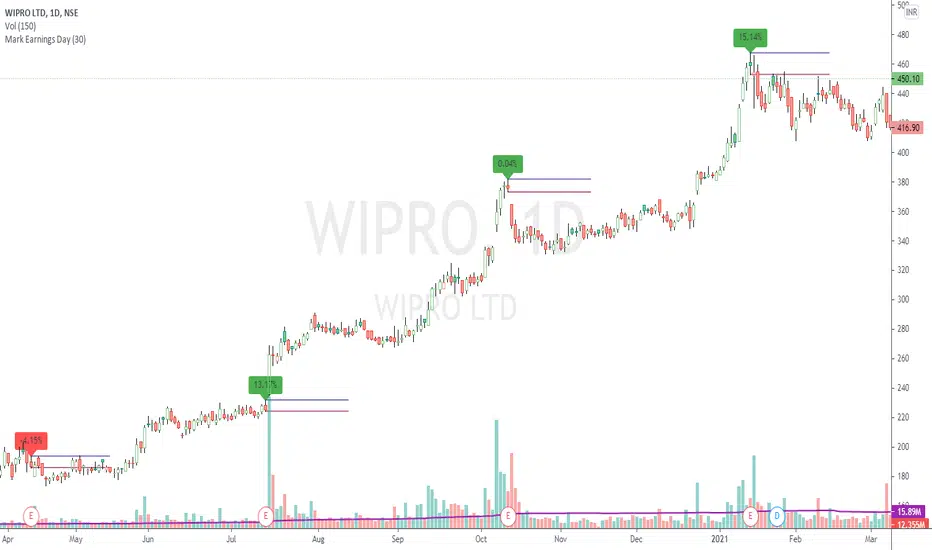
Mark Earnings DayThe idea for today is to plot high / low prices on the Earnings day. (use only on Daily timeframe)
And as we all know, most of the times, price is unidirectional after the earnings are declared.
A target of 1:2 or even 1:5 can be easily achieved in these cases, within few days.
Green label indicates, reported earnings are higher than estimated. Red indicates the other way.
But 1, this does not necessarily indicate the trend direction.
But 2, a breakout / breakdown of this day's candle mostly does. The other serving as a Stop Loss.
Optionally, the scripts can also plot splits and dividends on the charts.
The difference between this indicator and readily available default markings on the chart is,
these figures are directly available on the chart itself, that saves multiple clicks.
Trend ResumptionWe again keep it really simple.
This indicator just plots the combination of RGRR and GRGG candlesticks. (R = Red / Bearish, G = Green / Bullish)
When either pattern occurs, trade the combined high and combined low of recent 2 RR or recent 2 GG candles. I.e.,
Buy above GG's high with SL at GG's low.
Sell below RR's low with SL at RR's high.
Refer the shared chart for example. The signals were plotted on both the sides, and wherever triggered - gave rewards.
Only 1 at 05-Apr, 10:50 a.m. did not trigger, but that must then be ignored. Do not hurry to enter the trade, wait for breakout / breakdown above combined high / low.

Vortex Range Breakout SystemThis is a Vortex Based Visual System,
Which can help you identify the Vortex Crosses based Range Breakouts/ Breakdown, over the price Scale,
How its made ?
The vortex Crosses are projected over the Price
on Same Time frame {Green and Red Filled area}
-> green Area means : Vortex Crossover Range
-> red Area means : Vortex Crossunder Range
and on Higher Timeframe
Vortex Cross Levels are Plotted, which you see as :
Blue and Orange Lines
Default Configs
Vortex Period is 14
Higher Timeframe Option is set to 60 mins
You can change the Higher timeframe to any minutes which suits your need
Also If you want to change the Higher Timeframe in Days
just know
1D = 24*60 min, = 1140mins
Enjoy!
