Moving Regression Band Breakout strategyFollowing the introduction of the Moving Regression Prediction Bands indicator (see link below), I'd like to propose how to utilize it in a simple band breakout strategy :
Go long after the candle closes above the upper band . The lower band (alternatively, the lower band minus the 14-period ATR or the central line ) will serve as a support line .
Exit as soon as the candle closes below the support line .
To manage the risk of false breakouts, a fixed stop loss is set to the value of the support line at the time of opening a position. When the support line moves above the position opening price, shift the stop loss to breakeven.
The same logic but in reverse applies to short positions.
As an option, it is possible to allow long entries only when the slope of the Moving Regression curve is positive (and short entries when the slope is negative).
Model parameters:
Length and Polynomial Order define the lag and smoothness of the model.
Multiplier specifies the width of the channel.
As the default model parameter values, I set those that I found to provide optimal risk / reward ratio on the daily timeframe (for both trending and range-bound market). However, the settings are very flexible and can be well-adjusted to particular market conditions. Feel free to play around and leave feedback in the comments!
Here's the original Moving Regression Prediction Bands script:
Breakout!

Multi Time Frame Candles with Volume Info / 3DHello Traders,
This is my second Multi Time Frame Candles script but with this new one, you will have some new features such volume info, remaining time to close of higher time frame candle and also developed using new features of Pine such array of lines. also I tried to make it 3D for better visualization ;) also it shows new highs/lows / breakouts.
I tried to make many things optional, so you can change almost everything using options.
What you can change using options:
- Higher time frame
- Number of Candles
- Candle Colors Up/Down
- Wick Color
- Volume colors Up/Down
- Text color of Remaining Time
- Shadow Color
- Background color
- Start bar of the candles (so you can see many higher times frame candles in same window)
- 3D effect, by default it's enables but you can disable 3D view
Lets see some examples:
Remaining time:
Breakouts:
You can combine different higher time frames:
if you don't want 3D view then combining different higher time frames:
You can change background color:
Enjoy!

Vortex Range Breakout SystemThis is a Vortex Based Visual System,
Which can help you identify the Vortex Crosses based Range Breakouts/ Breakdown, over the price Scale,
How its made ?
The vortex Crosses are projected over the Price
on Same Time frame {Green and Red Filled area}
-> green Area means : Vortex Crossover Range
-> red Area means : Vortex Crossunder Range
and on Higher Timeframe
Vortex Cross Levels are Plotted, which you see as :
Blue and Orange Lines
Default Configs
Vortex Period is 14
Higher Timeframe Option is set to 60 mins
You can change the Higher timeframe to any minutes which suits your need
Also If you want to change the Higher Timeframe in Days
just know
1D = 24*60 min, = 1140mins
Enjoy!

LAGging span leaves Bollinger Bands strategyAbstract
This script points out the positions a lagging span leaves a Bollinger Band.
This script does not plot a lagging span but moves the Bollinger Band forward.
You can find profit opportunities by combining this script and risk management.
Introduction
Bollinger Bands is a popular indicator.
It contains a moving average, an upper band and a lower band.
The moving average can indicate trend, the upper band and the lower band can indicate if the price is far away from the moving average.
However, in trading markets, anything can happen.
Both continuation and reversal are possible when the price touches the moving average, the upper band or the lower band.
Therefore, many traders adjust the parameters of the Bollinder Band or add other indicators to improve their trading strategies.
@Daveatt et. al. provided an idea that uses a lagging span.
A lagging span is a line chart. It displays the reference price but in earlier time.
For example, if the offset of a lagging span is 26 days, the value of the lagging span on 29 days ago is the reference price 3 days ago.
A lagging span is a part of Ichimoku Cloud.
It can compare the price to the earlier price and the values of indicators in the past.
To compare the price to the values of indicators in the past, we can also shift indicators forward instead of adding a lagging span into the chart.
This script uses shift-the-indicators-forward method.
In other words, this script plots the Bollinger Band forward so that the price can be compared to the values of the Bollinger Band in the past.
Computing and Adjusting
(1) Compute Moving Average
(2) Compute Standard Derivation
(3) Upper Band = Moving Average + Standard Derivation * Multi
(4) Lower Band = Moving Average - Standard Derivation * Multi
(5) Shift the Bollinger Band forward according to the offset parameter.
(6) Mark the points the price leaves the shifted Bollinger Band
(7) Compute the most possible loss and profit before the next opposite signal.
Parameters
source : the data for computing the bollinger band. can be open, high, low, close or their combination.
length : how many days are calculated by the bollinger band
mult : the distance from the moving average to the upper band and the distance from the moving average to the upper band is equal to ( mult * standard derivation ) .
x_offset : the offset of the lagging span
Conclusion
This script can find signals for potential breakout or trend continuation.
If you want to use this signal well, you need to know when to cut loss and protect the profit.
Reference
@Daveatt , Bollinger bands/Lagging span cross , BGyrPgOA , Tradingview 2019
How to trade with Bollinger Bands
How to use Ichimoku Cloud
How to trade with a line chart

True Range Breakout [racer8]TRB (True Range Breakout) plots the current TR (true range) as well as the previous TR high over n periods. If the current TR is greater than the previous TR high, then the TR histogram will become red. Red signals high volatility. Enter trades only when the histogram is above the TR high line. Happy trading! 🥳

Price Action - Support & Resistance by DGTSᴜᴘᴘᴏʀᴛ ᴀɴᴅ Rᴇꜱɪꜱᴛᴀɴᴄᴇ , is undoubtedly one of the key concepts of technical analysis
█ Sᴜᴘᴘᴏʀᴛ ᴀɴᴅ Rᴇꜱɪꜱᴛᴀɴᴄᴇ Dᴇꜰɪɴɪᴛɪᴏɴ
Support and Resistance terms are used by traders to refer to price levels on charts that tend to act as barriers, preventing the price of an financial instrument from getting pushed in a certain direction.
A support level is a price level where buyers are more aggressive than sellers. This means that the price is more likely to "bounce" off this level rather than break through it. However, once the price has breached this level it is likely to continue falling until meeting another support level.
A resistance level is the opposite of a support level. It is where the price tends to find resistance as it rises. Again, this means that the price is more likely to "bounce" off this level rather than break through it. However, once the price has breached this level it is likely to continue rising until meeting another resistance level.
A previous support level will sometimes become a resistance level when the price attempts to move back up, and conversely, a resistance level will become a support level as the price temporarily falls back.
█ Iᴅᴇɴᴛɪꜰʏɪɴɢ Sᴜᴘᴘᴏʀᴛ ᴀɴᴅ Rᴇꜱɪꜱᴛᴀɴᴄᴇ
Support and resistance can come in various forms, and the concept is more difficult to master than it first appears. Identification of key support and resistance levels is an essential ingredient to successful technical analysis.
If the price stalls and reverses in the same price area on minimum of two different occasions, then a horizontal line is drawn to show that the market is struggling to move past that area. Those areas are static barriers, one of the most popular forms of support/resistance and are highlighted with horizontal lines.
Repeated test , the more often a support/resistance level is "tested" over an extended period of time (touched and bounced off by price), the more significance is given to that specific level
High volume , the more buying and selling that has occurred at a particular price level, the stronger the support or resistance level is likely to be
Market psychology , plays a major role as traders and investors remember the past and react to changing conditions to anticipate future market movement.
Psychological levels , is a price level that significantly affects the price of an underlying financial instrument. Typically, near round numbers often serve as support and resistance
The following support and resistance related topics are beyond the scope of this study, so they will be mentioned roughly only as a reference for support and resistance concept
Trendlines , Support and resistance levels in trends are dynamic. Throughout an uptrend, levels of support tend to look like a trendline, usually clustering around higher lows. As the price rises, the price where buyers consider the stock to be “too cheap” also changes, which creates new support levels on the way up. The same is also true for resistance levels. In an uptrend, a stock is continuously breaking through perceived resistance levels and making new highs
Moving Averages , is a constantly changing line that smooths out past price data while also allowing the trader to identify support and resistance. In the example Notice how the price of the asset finds support at the moving average when the trend is up, and how it acts as resistance when the trend is down
The Fibonacci Retracement/Extension tool , is a favorite among many short-term traders because it clearly identifies levels of potential support and resistance
Pivot Point Calculations , is another common technical analysis technique, where pivot point is calculated based on the high, low, and closing prices of previous trading session/day and support & resistance levels are projected based on the pivot point, different calculation techniques are available, as presented in this example of an pivot point indicator : PVTvX by DGT
█ Tʀᴀᴅɪɴɢ Bᴀꜱᴇᴅ ᴏɴ Sᴜᴘᴘᴏʀᴛ ᴀɴᴅ Rᴇꜱɪꜱᴛᴀɴᴄᴇ
Once an area or "zone" of support or resistance has been identified, those price levels can serve as potential entry or exit points because, as a price reaches a point of support or resistance, it will do one of two things—bounce back away from the support or resistance level (trading ranges), or violate the price level and continue in its direction (trading breakouts) —until it hits the next support or resistance level
The basic trading method for using support and resistance is to buy near support in uptrends or the parts of ranges or chart patterns where prices are moving up and to sell/sell short near resistance in downtrends or the parts of ranges and chart patterns where prices are moving down. Buying near support or selling near resistance can pay off, but there is no assurance that the support or resistance will hold. Therefore, consider waiting for some confirmation that the market is still respecting that area
Trading breakouts, a breakout is a potential trading opportunity that occurs when an asset's price moves above a resistance level or moves below a support level on increasing volume. The first step in trading breakouts is to identify current price trend patterns along with support and resistance levels in order to plan possible entry and exit points. Once the asset trades beyond the price barrier, volatility tends to increase and prices usually trend in the breakout's direction. Breakouts are such an important trading strategy since these setups are the starting point for future volatility increases, large price swings and, in many circumstances, major price trends. When trading breakouts, it is important to consider the underlying asset's support and resistance levels. The more times an asset price has touched these areas, the more valid these levels are and the more important they become. At the same time, the longer these support and resistance levels have been in play, the better the outcome when the asset price finally breaks out. Asset prices will often move slightly further than we expect them to. This doesn't happen all the time, but when it does it is called a false breakout. Therefore it is important to consider waiting for some confirmation while trading breakouts. It’s also popular for traders to sell 50% of their positions at the resistance level, and hold the rest in anticipation of a breakout above resistance
█ Pʀɪᴄᴇ Aᴄᴛɪᴏɴ - Sᴜᴘᴘᴏʀᴛ & Rᴇꜱɪꜱᴛᴀɴᴄᴇ ʙʏ DGT Sᴛᴜᴅʏ
This experimental study attempts to identify the support and resistance levels. Assumes a simple logic to discover moments where the price is rising or falling consecutively for minimum 3 bars with the condition volume increases on each bar and the last bar’s volume should be bigger than the long term volume moving average. A line will be drawn at the end of the move (highest or lowest, depending on the move direction), the line will be drawn at minimum on the 3rd bar and if condition holds for other consecutive bars the line will switch to 4th, 5th etc bar.
Lines will not be deleted so the historical ones will remain and will emphasis the levels significance when they overlap in feature. Strong levels are more likely to hold and cause the price to move in the other direction, whereas the minor levels may only cause the price to pause and keep moving in the same direction. Determining future levels of support and resistance can drastically improve the returns of a short-term investing strategy
Bar colors will be painted based on the volume of the specific bar to its long term volume moving average. This will help identifying the support and resistance levels significance and emphasis the sings of breakouts
Finally, Volume spikes will be marked on top of the price chart. A high volume usually indicates more interest in the security and the presence of institutional traders. However, a rapidly rising price in an uptrend accompanied by a huge volume may be a sign of exhaustion. Traders usually look for breaks of support and resistance to enter positions. When security break critical levels without volume , you should consider the breakout suspect and prime for a reversal off the highs/lows. Volume spikes are often the result of news-driven events. Volume spike will often lead to sharp reversals since the moves are unsustainable due to the imbalance of supply and demand
A good example with many support and resistance concepts observed on a stock chart and detected by the study
Settings:
Length of volume moving average, where volume moving average is used to detect support and resistance levels, is used as reference to compare with threshold values for volume spikes and colors of the bars
Hint, to get more historical lines scrolling chart to left will enable visualization of them. Please note they may appear to much all 500 line limit is used 😉
Special thanks to @HEMANT Telegram user, for his observations and suggestions
Disclaimer:
Trading success is all about following your trading strategy and the indicators should fit within your trading strategy, and not to be traded upon solely
The script is for informational and educational purposes only. Use of the script does not constitute professional and/or financial advice. You alone have the sole responsibility of evaluating the script output and risks associated with the use of the script. In exchange for using the script, you agree not to hold dgtrd TradingView user liable for any possible claim for damages arising from any decision you make based on use of the script

rocketLaunchI wanted to see if I could programmatically identify the conditions I saw just before Bitcoin broke its all-time high end of 2020. The signal picks up several rocket launch moments prior to launching which is quite cool. It also picks up a few false starts, however. In any case, I would have loved to be stopped out on those false starts but been there for all the starts this thing picks up.
It could probably use more confirmatory elements such as trailing conditions and volume perhaps?
BINANCE:BTCUSDTPERP

Consolidation Ranges [kingthies] Consolidation Range Analysis
Published by Eric Thies, January 2021
█ Indicator Summary
This tool calculates, analyzes and plots the visualization of a relative range over a given period of time
By adding to charts, users are enabled to see the impulsive nature of market cycles, along with their efforts to consolidate thereafter
The default period is 30, and should be adjusted to users preference
The default input is the current close price, on the chosen timeframe of the chart
█ Script Source
//
//@version=4
//© kingthies || This source code is subject to the terms of the Mozilla Public License 2.0 at mozilla.org
study("Consolidation Ranges ", shorttitle="CR ", overlay=true)
// !<------ User Inputs ----->
src = input(close, title='Range Input (Default set to Close'), lengthEMA=input(30,title='Length'),zoneToggle = input(true, title="Toggle Zone Highlights"), iCol = color.new(#FFFFFF, 100),
// !<---- Declarations & Calculations ---- >
trndUp = float(na),trndDwn = float(na), mid = float(na), e = ema(src, lengthEMA)
trndUp := src < nz(trndUp ) and src > trndDwn ? nz(trndUp ) : high, trndDwn := src < nz(trndUp ) and src > trndDwn ? nz(trndDwn ) : low, mid := avg(trndUp, trndDwn)
// !< ---- Plotting ----->
highRange = plot(trndUp == nz(trndUp ) ? trndUp : na, color=color.white, linewidth=2, style=plot.style_linebr, title="Top of Period Range")
lowRange = plot(trndDwn == nz(trndDwn ) ? trndDwn : na, color=color.white, linewidth=2, style=plot.style_linebr, title="Bottom of Period Range")
xzone = plot(zoneToggle ? src > e ? trndDwn : trndUp : na, color=iCol, style=plot.style_circles, linewidth=0, editable=false)
fill(highRange, xzone, color=color.lime,transp=70), fill(xzone, lowRange, color=color.red,transp=70)
//

TrendLine ChannelsAbstract
This script provides a set of Trendline Channels which can be tighter than Donchian Channels.
This script computes the most suitable active upper and lower trendlines and updates them as soon as possible.
We can use it for breakout signals earlier than Donchian Channels.
Introduction
Channels are tools which can mark area of values of ranging markets.
Once the price leaves the original region, range traders may start admitting they are wrong and trigger trend.
Donchian Channels (misheard as Dungeon Channels) use the highest and the lowest price to define area of values.
When the price breakouts, it just like it got released from a dungeon.
However, waiting for the price making even higher or lower may be too late and risk reward ratio may be lower.
Trendlines can make the channels tighter and we can find earlier breakout signals.
Computing Trendline Channels
(1) Find the most active trendlines
In this script, a valid trendline connects two high values or two low values.
A high value means the highest value in a trading day.
A low value means the lowest value in a trading day.
In this script, every trendline does not crossover any bar but can exactly touch them.
The most flat trendline is taken. (one for upper and one for lower)
(2) Continue to use or Change a trendline
If there is a tighter trendline available, this script changes to use it.
If the previous active trendline is broken, this script re-computes the trendline available.
When this case happens, this script display with an another color.
Otherwise, this script continues using the previous trendline.
(3) Middle line
The middle line indicates the middle value between the upper and the lower.
Parameters
Length : how many days are used for computation. The default value is 16 just because 16=4*4, using binary characteristic.
x_go_on : If the previous trendline is not breakout and there are no tighter trendlines available, we continue use it.
Color Options
(1) Upper trendline (no update or tighter)
(2) Upper trendline (changed due to breakout)
(3) Middle line
(4) Lower trendline (no update or tighter)
(5) Lower trendline (changed due to breakout)
Conclusion
Trendline Channels can be tighter than Donchian Channels and evaluate earlier breakout signals.
Comparing to known auto trendline scripts, Trendline Channels is continuous.
Once a trendline is broken, Trendline Channels can instantly point out the next available one.
If you think the price movement is boring or you cannot have good risk reward ratio, you can go to an another timeframe.
Reference
How to trade with Donchian Channels
How to trade with Trendlines

Linear Regression ChannelHello Traders,
There are several nice Linear Regression Channel scripts in the Public Library. and I tried to make one with some extra features too. This one can check if the Price breaks the channel and it shows where is was broken. Also it checks the momentum of the channel and shows it's increasing/decreasing/equal in a label, shape of the label also changes. The line colors change according to direction.
using the options, you can;
- Set the Source (Close, HL2 etc)
- Set the Channel length
- Set Deviation
- Change Up/Down Line colors
- Show/hide broken channels
- Change line width
meaning of arrows:
⇑ : Uptrend and moment incresing
⇗ : Uptrend and moment decreasing
⇓ : Downtrend and moment incresing
⇘ : Downtrend and moment decreasing
⇒ : No trend
An example for how color of lines, arrow direction and shape of label change.
Enjoy!

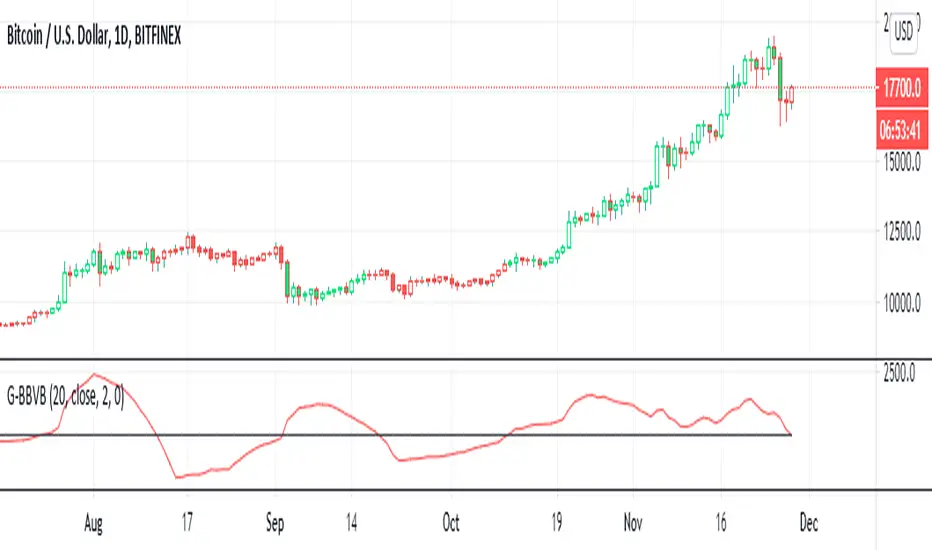
G-Bollinger bands volatility breakout v.1This is my frist publish scrpit. I developed this indicator origin is BB. It make from easy idea but powerful for sideway to breakout
1. I findout volatility by upper band of BB - lower band of BB (I called "Aline")
2. I created SMA of Aline (I called Bline)
3. I created the special line is "Cline" from Aline - Bline
4. I created 0 line " Baseline "
G-BBvB is the very good indicator to detect low volatility to begin the volatility = Buy signal
Now I can't find the sell signal form indicator. I try backtest sell at Cline cross zeroline but it not work.
I'll develop "G" indicator for free .
Goodluck :D
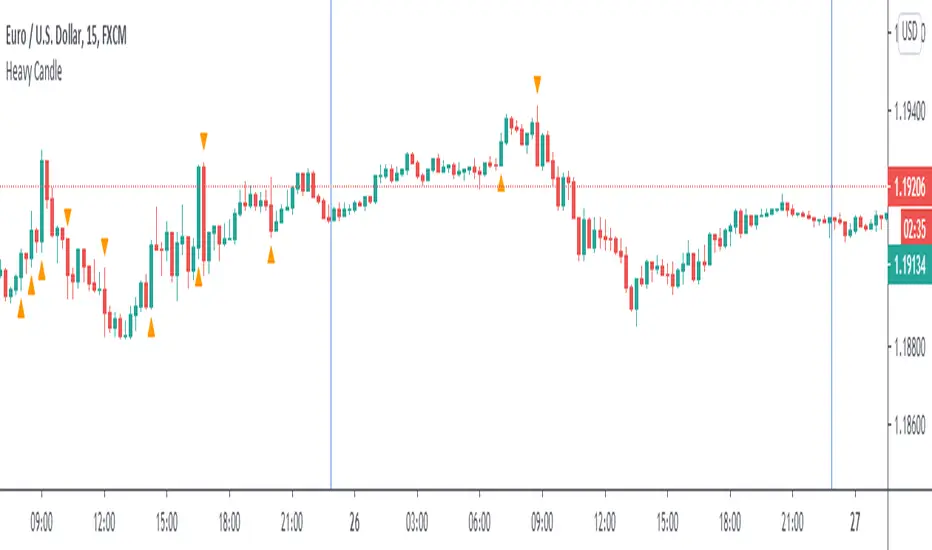
Heavy CandleHeavy Candle compares current candle size to its previous, the one before that and different Average True Ranges. The point is to objectively highlight a sizeable candle to enter the market with. The direction is based on if the close is above VWAP or below it.
To plot a signal, the new candle has to:
►Oversize previous candle times multiplier 1 one OR the candle before that times multiplier 1.
►Be higher than at least two Average True Ranges.
There is no built-in algorithm to judge the character of where the signal appears and of what quality it is. It can be used as a non-subjective entry trigger but only in conjunction with other analysis.
Traders are free to adapt the script to their needs and change the code as they see fit. Just mention me if you decide to make it public.
Session Range and Breakout Summary
This script presents the session range and post session movements relative to that range of all the majors and crosses on a single page. You can also set it to a daily range and weekly range (beta). It will even show you the pip value of the range. I made the indicator to easily stay on top of market movements at london open relative to the Asia session range. Its very easy to see which entire currency group is breaking its asia range WHIST ITS HAPPENING. Focus on NZD in the examples as it was the market lead today - I was able to get some of it when I saw the entire group breaking its range
Showing all the majors and crosses relative to the Asia range (00:00 - 07:00 GMT)
Active 'show on chart' to verify the indicator is measuring the range correctly. Compare below to the NZD box above - you can see how NZD had control of the market this morning and all NZD pairs broke out of their ranges.
'PIP MODE' - active pip mode to see what the pip range was of the session
Notes
The information is presented RELATIVELY - this means that all the ranges and movements are scaled to be the same size. You are therefore seeing the movements relative to their ranges. When you see a breakout it relative to the size of the range - for example, if GBPJPY had a range of 50pips and breaks out of the range by 100 pip and GBPEUR has a range of 20 pips and breaks out by 40 pips they have both broken out double the range and will be displayed as the same distance.
The indicator will show the movements whilst the range is forming. I did this so I can see what the groups are doing before Europe open and be ready - such as lingering at the top end of its INCOMPLETE asia range. Be aware through that if the lines are flat at the top of the range WHILST THE RANGE IS STILL FORMING this does not mean price was flat, it means that price was pushing up and growing the range. (Price can't breakout until the range has formed at the end of the session)
The currency pairs are organised to show the strength or weakness of the selected group - this means that the base currency is always the select group. This is to present the data with currencies moving in the same direction rather than some reversed but meaning the same in relation to currency strength. In the NZD example:
NZDAUD (not AUDNZD )
NZDCAD
NZDCHF
NZDEUR (not EURNZD )
NZDGBP (not GBPNZD )
NZDJPY
NZDUSD
I hope its useful. This is the most powerful indicator I've managed to write yet. It was difficult to make the code efficient enough to fit into the pinescript limit and still do everything.

Percent Drop from Highest HighBuy and hold investors may decide to use trailing stops to protect profits and capital from market crashes, especially during bull markets.
The purpose of this indicator is to hep investors to identify a location to place them. The indicator plots the highest high from 'x' bars ago. It then plots a trailing stop loss 'y' percent below that line.
The indicator enables its users to input different 'x' and 'y' values to observe what they think works best for them in different markets.
Users might choose to pair the indicator with trend confirming indicators, such as moving average cross overs, to determine that the market is trending and not ranging.
There is no magic in this indicator, only maths. Like every indicator, it has no ability to predict anything. Just because the market is doing one thing now, it might do something different later. The past does not equal the present nor the future. Make your own decisions and be responsible for them.
All the best to you and your family.

London breakout GBPUSD daytradeHello,
First I want to WARN THAT YOU NEED A MINIMUM OF 30X LEVERAGE FOR THIS STRATEGY IN ORDER TO WORK.
THE REASON IS THAT THE SIZE IS CALCULATED BASED ON A VERY SHORT STOP LOSS LEVEL IN PIPS
UTILIZE IT AT YOUR OWN RISK
This is a daytrading strategy, that's suited for GBPUSD 1H timechart.
It a very simple strategy that utilizes 2 moving averages : a very fast one and a very slow one.
It will always enter only at the beginning candle of London session, and it will always exit at the candle at the finish of London session.
So the rules are simple :
If its 8 am GMT and the candle close or high cross the slow moving average and we are above at the same over the slow moving average we make a long movement. The oposite condition is applied for short.
At the same time we always use a very small stop loss = 50-100 points ( 5-10 pips).
We dont have a take profit, in our case the trade ends always at the end of London session. In this case at 15h GMT
It might work on other currencies aswell, but it has to be tested first.
For any questions or suggestions, please let me know.

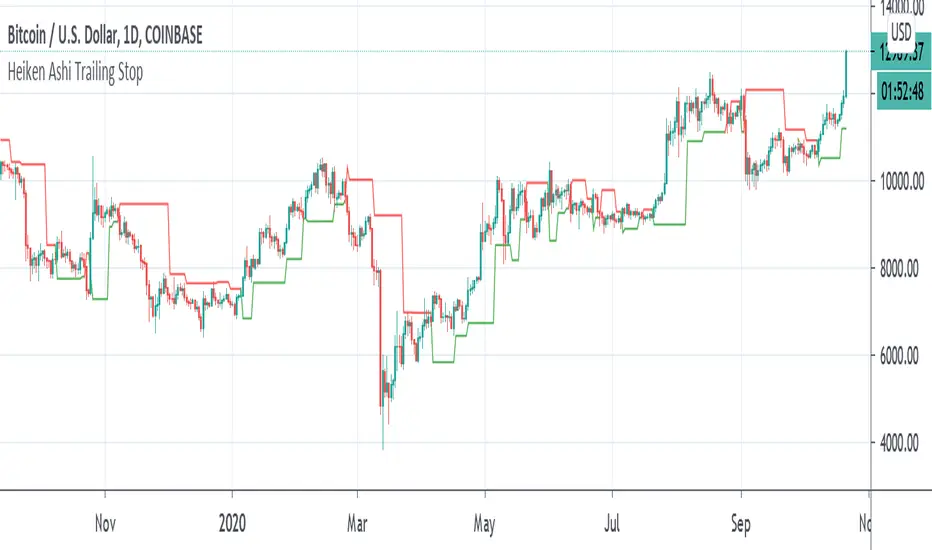
Heiken Ashi Pivot Breakout Trailing StopThis is a heiken ashi pivot based trailing stop for breakout entries and exits. It's possibly related to the Swing Index System by Welles Wilder or an alternative to it that I came up with, in case determining the swings on the Accumulative Swing Index is too much of a burden. It is believed that the ASI uses the calculation of heiken ashi in its formula. This does not use the ASI as a bottom indicator in the chart but instead uses the heiken ashi bars on the top of the chart to objectively find the swing pivots . These swings pivots act as support and resistance and can be used to confirm the start of a breakout or the end of one.
Suppose you find a chart pattern or setup, such as divergence or a pennant in the RSI , a pattern on the ASI, and/or on the chart, or the end of an elliot wave , etc and want to confirm a strong breakout and ride it to the end. Many trailing stops won't be able to confirm the beginning or would last too long or not long enough to exit out of one. On an uptrend, when the price breaks below the last swing low pivot , it can confirm the end of the breakout. On a downtrend, when the price breaks above the last swing high pivot , it can confirm the end of the breakout.
This trailing stop is not meant to replace trend following ones. The swing pivots can vary yet the price can still continue at an uptrend whereas this heiken ashi pivot based trailing stop exits as soon as it goes above or below the last resistance point. These swing points can end up being too close for trend following but can work well for breakout trading. The bigger the chart pattern or breakout, the more reliable the exit signal will be in my opinion. This is an experimental idea that I came up with from trying to interpret the ASI.
72s: Adaptive Hull Moving Average+One challenging issue for beginner traders is to differentiate market conditions, whether or not the current market is giving best possibility to stack profits, as earliest, in shortest time possible, or not.
On intraday, we've seen some big actions by big banks are somewhat can be defined --or circling around-- by HMA 200 . I've been thinking on to make the visuals more conform to price dynamics (separating major movement and minor noise) to get clearer signs of when it starts to happen. So it will be easier to see in a glance when the strength starts really taken place, with less cluttered chart.
This Adaptive HMA is using the new Pine Script's feature which now support Dynamic Length arguments for several Pine functions. ( read: www.tradingview.com). It hasn't support the built-in HMA() directly, but thankfully we can use its wma() formula to construct. (Note: I tweaked a bit HMA formula already popular here by using plain int() instead of round() on its wma's length, since I find it precisely match tradingview's built-in HMA).
You can choose which aspect the Adaptive HMA period will adapt to.
In this study I present it with two options: Volume and Volatility . It will "moves" faster or slower depends on which situation the aspect is currently into. ie: When volume is generally low or volatile readings is not there, price won't move very much, so the adapting MA will slow down by dynamically lengthen the lookback period, and vice versa, and so on.
Colour-markings in the Adaptive resembles which situation explained above. In addition, I also combine it with slope calculation of the MA to help measuring trend-strength or sideway/choppy conditions.
This way when we use it as dynamic support/resistance it will be more visually-reliable.
Secondly, and more important, it might help us traders with better probability info of whether or not a trade should even worth to be made . ie: If in the mean time market won't give much movement, any profit would also only as much. In most cases, we might better save our dime for later or place it somewhere else.
HOW TO USE:
Aside from better dynamic support/resistance and clearer breakout confirmation, MA is coloured as follow:
YELLOW:
Market is in consolidation or flat. Be it sideways, choppy, or in relatively small movements. If it shows up in a trending market, it may be an earlier sign that current trend might about to change its direction, or confirming a price broke-out to another side.
LIGHT GREEN or LIGHT RED:
Tells if a trend is forming but still relatively weak (or getting weaker), as it doesn't have volume or volatility to support.
DARKER GREEN ot DARKER RED:
This is where we can expect some good and strong price movement to ride. If it's strong enough, many times it marks a start of new long-lasting major trend.
SETTINGS:
Charger:
Choose which aspect your HMA should plug itself into, thus it will adapt to it.
Minimum Period, Maximum Period:
172 - 233 is just my own setting to outmatch the static HMA 200 for intraday. I find it --in my style of trading-- best in 15m tf in almost any pair, and 15m to 1H for some stocks. It also works nicely with conventional EMA 200, sometimes as if they somewhat work hand-in-hand in defining where the price should go. But you can, ofcourse, experiment with other ranges, broader or narrower. Especially if you already have an established strategy to follow to. As you might do with:
Consolidation area threshold:
This has to do with slope calculation. The bigger the number means your MA needs bigger degree to define the market is out of flat (yellow) area. This can be useful if needed to lighten up the filter or vice-versa.
Background colouring:
Just another colouring to help highlighting the difference in market conditions.
ALERTS:
There are two alerts:
Volume Break: when volume is breaking up above average, and
Volatility Meter: when the market more likely is about to have its moment of the big wiggling brush.
USAGE:
Very very nice BUY entry to catch big up-movement if:
1. Price is above MA. (It is best when price is also not to far distance from the MA, or you can also use distance oscillator to help out too)
2. HMA's color is in darker green. Means it's on the charging plug with your chosen aspect.
3. RSI is above 50. This is to help as additional confirmation.
Clear SELL entry signal is same as above, just the opposite.
-------------------------------------------------------
Note:
Lower timeframe of course means more noise to be filtered. Depends on the instrument, you might need to tweak the settings a bit till it conform nicely and shows lots of good trades in history. Here's another example on GBPUSD 5m timeframe:
For exit/take-profit point, you can use a second faster period static HMA. Or you can also use RSI. Here's an example:
Don't get me wrong, on few occasions I found it's still best using static MA to spot fakeouts, breakouts, etc, especially ones that's been already use widely. If that's the case or price actions seems suspicious, simply put the same value for minimum and maximum period settings, and there you have the original HMA with extra features.
For developer, check in the code if you need to customise your own charger.
-------------------------------------------------------
That's it. Hopefully this Adaptive HMA+ could at least be a good sidekick to your own strategy, as it does mine. ;)

Soldiers Pattern ModifiedThis can be perceived as modified 3 soldiers, relaxed NR4 or even extended harami candlestick pattern.
Works for any instrument and any timeframe.
The idea is to find out any number of candles having their individual highs and lows, all within high and low range of base candle.
The count of soldiers and if they must be of same color, both can be configured.
Additional configurable settings is to add further check of having body of soldiers as well within body of base candle.
Trading strategy: Trade high or low breakout of base candle, having other as stop loss, for a risk reward ratio of 1:2.

[blackcat] L2 Swing Oscillator Swing MeterLevel: 2
Background
Swing trading is a type of trading aimed at making short to medium term profits from a trading pair over a period of a few days to several weeks. Swing traders mainly use technical analysis to look for trading opportunities. In addition to analyzing price trends and patterns, these traders can also use fundamental analysis.
Function
L2 Swing Oscillator Swing Meter is an oscillator based on breakouts. Another important feature of it is the swing meter, which confirms the top or bottom's confidence level with different color candles. The higher of the candles stack up, the higher confidence level is indicated.
Key Signal
absolutebot ---> absolute bottom with very high confidence level
ltbot ---> long term bottom with high confidence level
mtbot ---> middle term bottom with moderate confidence level
stbot ---> short term bottom with low confidence level
absolutetop ---> absolute top with very high confidence level
lttop ---> long term top with high confidence level
mttop ---> middle term top with moderate confidence level
sttop ---> short term top with low confidence level
fastline ---> oscillator fast line
slowline ---> oscillator slow line
Pros and Cons
Pros:
1. reconfigurable swing oscillator based on breakouts
2. swing meter can confirm/validate the bottom and top signal
Cons:
1. not appliable with trading pairs without volume information
2. small time frame may not trigger swing meter function
Remarks
This is a simple but very comprehensive technical indicator
Readme
In real life, I am a prolific inventor. I have successfully applied for more than 60 international and regional patents in the past 12 years. But in the past two years or so, I have tried to transfer my creativity to the development of trading strategies. Tradingview is the ideal platform for me. I am selecting and contributing some of the hundreds of scripts to publish in Tradingview community. Welcome everyone to interact with me to discuss these interesting pine scripts.
The scripts posted are categorized into 5 levels according to my efforts or manhours put into these works.
Level 1 : interesting script snippets or distinctive improvement from classic indicators or strategy. Level 1 scripts can usually appear in more complex indicators as a function module or element.
Level 2 : composite indicator/strategy. By selecting or combining several independent or dependent functions or sub indicators in proper way, the composite script exhibits a resonance phenomenon which can filter out noise or fake trading signal to enhance trading confidence level.
Level 3 : comprehensive indicator/strategy. They are simple trading systems based on my strategies. They are commonly containing several or all of entry signal, close signal, stop loss, take profit, re-entry, risk management, and position sizing techniques. Even some interesting fundamental and mass psychological aspects are incorporated.
Level 4 : script snippets or functions that do not disclose source code. Interesting element that can reveal market laws and work as raw material for indicators and strategies. If you find Level 1~2 scripts are helpful, Level 4 is a private version that took me far more efforts to develop.
Level 5 : indicator/strategy that do not disclose source code. private version of Level 3 script with my accumulated script processing skills or a large number of custom functions. I had a private function library built in past two years. Level 5 scripts use many of them to achieve private trading strategy.

2 Candles Inside ATR2 agitated candles falling inside ATR range, awaiting possibly a big move.
Buy / Sell signals at combined high / low can be used as order with other as stop loss.
Counter trade, when this minimal stop loss is hit, is also as useful. However, wait till the SL candle closes, before opening position on the other side.
Works quite well on 15 mins chart, with settings of ATR duration 25 and multiplier 0.6. These settings are configurable, so feel free.

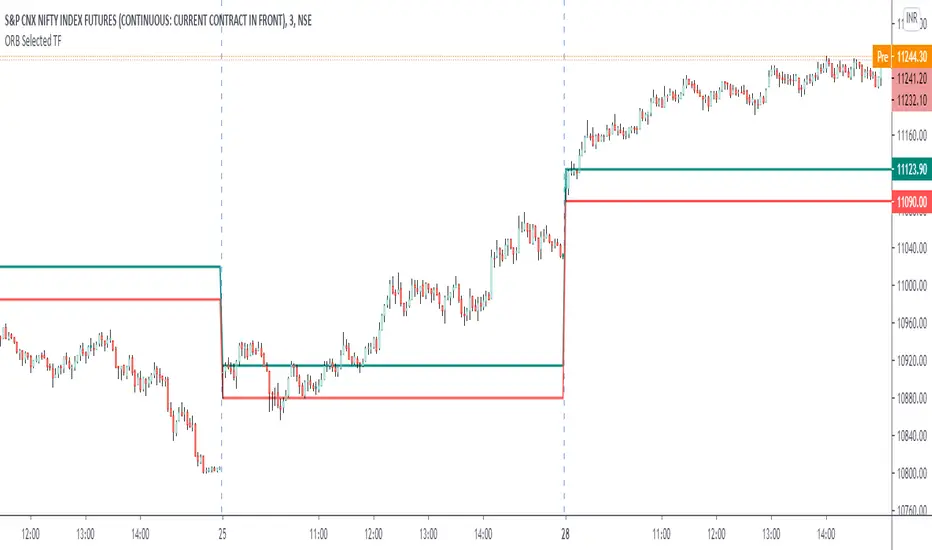
ORB Current TimeframePlot high and low of first candle from the current timeframe.
The levels are adjusted automatically when the timeframe is changed.
Trade breakout in either direction with other as a stop loss.
Can be used for any instrument.
Support and Resistance Levels with Breaks [LuxAlgo]This script provides basic pivot point Support and Resistance Levels to the user whilst displaying Break signal tags. It also has the ability to let the user display more significant breaks by filtering using the Volume Oscillator.
Only more significant breaks of these basic levels are displayed to the user when optimized which avoids noise and messy signals.
It will also display breaks with candles it deems to be bullish (e.g. having a longer upper or lower wick).
Notation
The notation of "B" denotes a break of either a Support or Resistance level with a volume greater than the threshold.
The notation of "Bull or Bear Wick" denotes a bullish or bearish candle on the break.
Settings:
Left Bars - the number of bars left hand side of the pivot.
Right Bars - the number of bars right hand side of the pivot.
Volume Threshold - the threshold value (%) for the Volume Oscillator.
Usage & Details:
Knowing when a pivot S/R level is broken with significance can be of great help to a trader. Many times significant levels may not be broken with significant force and the move is therefore weaker and possibly not worth trading.

Support Resistance - Aging [Example]Hello All,
First all of Thanks to Pine Team for adding Arrays to Pine!
In this script I tried to make example for
1. Finding S/R lines using highest/lowest function
2. Using 1D array as 2D (we keep S/R levels and age)
3. "Age" usage for S/R levels, getting older on each candle and changing colors by their age (maximum age is 127 then it disappears)
You can use "Close"/Open " or " High/Low " as source.
There is an option for the background color, by default it's Black, do not forget to set it accordingly :)
Enjoy!
