Multi-Timeframe Stoch RSIGood evening folks!
Today I want to share with you a simple variant of the Stochastic-RSI built-in indicator.
Nothing too complex: by enabling the relative checkbox and setting the desired (k, d or the RSI ) source and timeframes, you can see higher timeframes data plotted on your screen.
Everything you need to do is enabling the indicator on the lowest timeframe (in this case 15 minutes), then you will see in YELLOW the information retrieved from the next higher timeframe (in this case 30 minutes) and in RED the information retrieved from the highest timeframe (in this case 45 minutes).
IT'S IMPORTANT THAT YOU DISPLAY THE INDICATOR ON THE LOWEST TIMEFRAME!
You can play with the overbought and oversold heights in order to have the best configuration you want (in oversold conditions is suggested to buy while in overbought conditions is suggested to sell)
The higher timeframes data are retrieved avoiding repainting since the method used for taking them is the 10th method described in this PineCoders Article , so, if you want to enable alerts, you SHOULD ignore the disclaimer message related to it without any problem.
Good Trading!
Btc!

Trend Reversal Indicator (EMA of slopes)Good morning Traders
Inspirated by lukescream EMA-slope strategy, today I want to share with you this simple indicator whose possible use-case would be for detecting in advance possible trend reversals, specially on higher timeframes.
Once that you've chosen the desired source (RSI, EMA or Stochastic k or d), the indicator will calculate its "slope" approximating its first order derivative by the division between the last variation of the series and its last value.
You can see the slope as a white line by enabling the relative checkmark (it's disabled by default since it simply messes up the the graph)
Then, the slope itself becomes the source for two exponential moving averages: the fast one (in blue) has a period of 20 while the slow one (in red, it becomes similiar to a horizontal line actually) has a period of 500
Why the slope? Since all the sources mentioned before are directly or indirectly calculated on the price action, a more aggressiveness in the price movement would be translated into a more (positive/negative) steepness of those indicator (of course this effect would be far more evident if the indicators are calculated on low periods, but really low periods could compromise the consistency of the signals).
In this way, the slope would mirror the decisiveness of price movements and a comparison between two averages calculated from it (the first one based on more recent values, the second one that conisders also older values) could tell you in advance what direction the market is possibly about to take
The usage is simple: once that the fast moving average crosses upward the slow one, this could be a sign of potential trend reversal from bearish to bullish. On the contrary, if the fast EMA crosses downward the slow one, this could be a sign of potential trend reversal from bullish to bearish.
What I suggest you is to integrate this indicator with Exponential Moving Averages plotted on the price candles, in order to have a general bias for opening long or short positions, and with an oscillator as well such as the Stochastisc RSI in order to detect the overbought/oversold zones for opening/closing positions at the right moment.
Happy Trading!

Crypto Derivatives Sentiment HeatmapWhat?
This is a heatmap that shows derivatives sentiment for some of the most prominent coins in crypto.
Content
Coins included:
BTC
ETH
LTC
DOT
LINK
YFI
The indicator takes the Binance USDT perpetual swaps of these coins and compares them to their respective spot indices.
Binance is the exchange of choice because their perps have the highest volume in the market.
For the spot indices I've used the indices created by Bitmex.
These are very intricate and weighted indices with compositions of the most important and trustworthy spot markets.
For more information check the Bitmex website.
The heatmap shows red coloring if the perp is trading above spot (bearish).
It shows green coloring if the perp is trading below spot (bullish).
The lighter the color the less wide the gap is between perps & spot.
The darker (brighter) the coloring the more extreme the difference.
Trading
It's quite simple.
When you see a lot of green, preferably dark green, you should have a bullish bias because it means that perps are oversold or that spot is bidding hard.
Vice versa a lot of red should give a bearish bias.
It's very practical for a quick sentiment check.
This indicator is free so you can just add it to your favorites.
Shout-out to zzzcrypto123 for inspiring me.

PROFIT MAKER |Crypto|ETH|BTC|YFI - SignalThis is the version with alerts of this strategy:
Description:
This is a trend-following strategy that works very well for many Crypto assets in the usd or usdt pair
It can be used for both futures and spot!
Some of the assets in which this strategy is proven are
Asset Exchange TF
BINANCE:ADAUSDT Binance 45m
BINANCE:BTCUSDT Binance 1h
BINANCE:YFIUSDT Binance 30m
BINANCE:DOTUSDT Binance 45m
BINANCE:ETHUSDT Binance 30m
BINANCE:LINKUSDT Binance 45m
BINANCE:DOGEUSDT Binance 1h
And many others..
What is this strategy based on?
It is a combination of various parameters, including
-RSI: The relative strength index ( RSI ) is a momentum indicator used in technical analysis that measures
the magnitude of recent price changes to evaluate overbought or oversold conditions in the price of a stock or other asset.
-MACD: Moving average convergence divergence ( MACD ) is a trend-following momentum indicator that shows
the relationship between two moving averages of a security’s price.
-ADX: ADX is used to quantify trend strength. ADX calculations are based on a moving average of price range expansion over a given period of time.
-DMI: DMI is a moving average of range expansion over a given period (the default is 14 days). The positive directional
movement indicator ( +DMI ) measures how strongly price moves upward; the negative directional movement indicator ( -DMI )
measures how strongly price moves downward. The two lines reflect the respective strength of the bulls versus the bears.
Included:
Different forms of Take profit, included:
Take profit on squeeze candles
Take profit based on Risk-Benefit (RR)
Take profit a pre-determined %.
Different forms of Stop Loss, including
ATR-based stop loss
Trail stop loss (with option to use a trigger)
Stop loss a pre-determined %.
For access you can send a message or consult in my social networks.
Links in my tradingview signature (below).
Examples:
The default configuration works very well for most pairs.
You just have to look for which time frame goes better with each one.
Recommended to try with 30m, 45m and 1 hour.

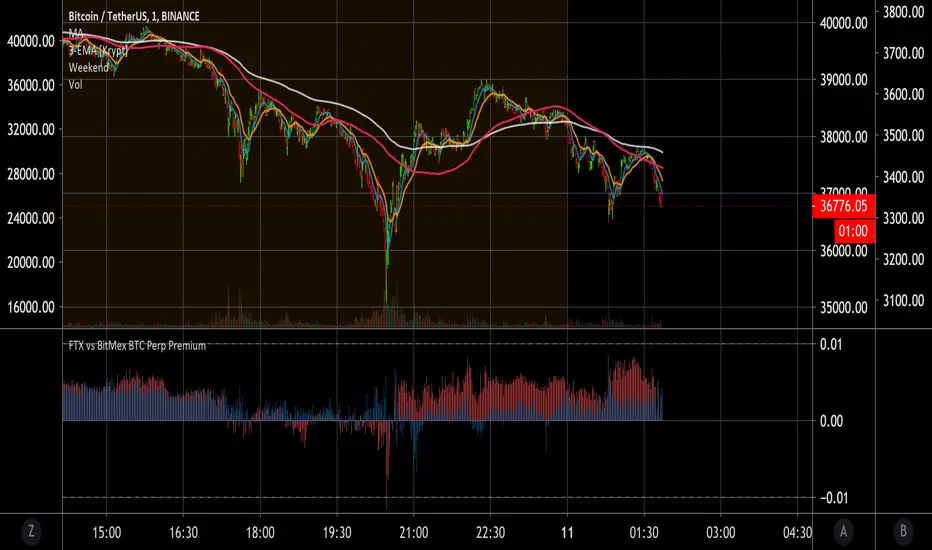
FTX vs BitMex BTC Perp PremiumThis script compares FTX BTC/PERP (BTC perpetual futures contract) price to Binance BTC/USDT spot and colors it red. It also plots Bitmex's BTC perpetual futures compared to Binance spot and colors it blue.
FTX = red
Bitmex = blue
Now you can easily see that you can get a 1% discount on FTX perpetuals when it is tanking. This tells you that you can set your limit buy orders extra low if you like to catch crashes. Also, you can see what your average trader on each platform is willing to pay above or below the spot premium. In general you want to do the opposite of what the average trading is doing on these exchanges unless you're in the main bull or mania phase of the Bitcoin cycle.
If you want to use Bitstamp or your favorite exchange it can be changed in the settings. Let me know if you find any settings that work well for you.
May you profit and enjoy! :)
Weighted derivatives premium BTCCan be extended with more derivative or spot pairs, see the comments in the code for instructions. Most importantly, the pairs need to be added to the respective arrays in the same order, so that the weights are applied to the correct pairs.

BTC Longs & Shorts Profile WHAT DOES THIS INDICATOR DO?
I started with the idea of creating another premium indicator with a bunch of features and add it to the bundle. However, the more complex the code was becoming, the less helpful the indicator actually was. So I started from scratch and made BTC Longs & Shorts Profile super simple (as you can see in the code).
The advantage over other similar indicators is that this one has a drop-down menu and allows you to select whether you want to see Longs, Shorts, Ratio, or Difference. Having Longs and Shorts at the same time is a bit confusing because Longs pretty much dwarf the Shorts and the ups and downs are not clearly visible. Also, you can configure the colors for each visible line.
My suggestion is to add this indicator to your BTC chart, save it as a template from the top menu on TradingView and stop switching between BTC, Bitfinex Longs and Shorts. You have everything in one simple window (that's especially the case if you are not a pro or premium member and can't have more than 2 screens simultaneously).
ANYTHING ELSE ?
On a side note, if you are planning on working on a similar indicator, let me tell you what I've tried so far and it didn't work for me:
- RSI calculations including Longs and Shorts as a base
- Longs and Shorts in relation to BTC itself and a relationship with the volume
- Directional Movement Index, where Longs are DM+ and Shorts are DM-
- Smoothing both Longs and Shorts and trying to find a relationship (including some pseudo MACD lookalikes)
Anyway, if you have any ideas or suggestions on improving this indicator, please let me know. Thanks!

BITCOIN CME FUTURES GAPSDisplays information about Bitcoin CME Futures Gaps over BTCUSD (or XBTUSD) charts.
You can configure a threshold percentage to only display gaps whose size is greater than that percentage. The gap precentage is calculated based on the current close price.
Gaps up are displayed in Orange, gaps down in Green

200 Week Moving Average HeatmapСolors part of the SMA depending on the change in % (delta %) to the previous value. From blue(none to low increase) through green(moderate increase) to red(high increase).

Bitcoin Estimated Transaction FeeThis is the estimated fee you can expect to pay to have your bitcoin transaction confirm in 1 block. The estimation is derived from the daily total revenue miners received divided by the daily total number of transactions.
An option to change to a different currency is provided.
Notes on transaction fees:
Most exchanges do not provide an option to change the fee amount, and charge a static fee. A notable exception is Deribit.
The newer Bech32 wallet format, also known as native or SegWit, use a lower fee for the same transaction as legacy addresses. The addresses start with "bc1".
Mania was $60 USD to move bitcoin to an exchange you've only just heard of to buy a different coin with funny name :)

CRYPTO Trend Direction Multiple EMA'sToday I bring an indicator specialized in crypto markets.
Its made of multiples EMA : very fast, fast, normal, slow, very slow
The logic behind its simple :
For long : we check that the EMA are in ascending order like EMA 5 > EMA 10 > EMA 20 .... and at the same time that last close of candle is above all of them.
For short : we check that the EMA are in descending order like EMA 5 < EMA 10 < EMA 20 .... and at the same time last close of candle is below all of them.
It can be used with all time frames.
Enjoy it !

DMI+ADX w/ Slope Colour & Fib LevelsThis is a DMI+ADX with colours based on the slope of the plot, with Fibonacci levels.
It makes it easier to see what is happening with a quick glance. I have also added Fib levels as an experiment, but when doing some backtesting they seem to line up reasonably well with past price movements. They can be used to see possible reversal areas, or as thresholds to gauge how strong the trend is. Fibs play a big role in the markets for some reason and I have seen them applied to more than PA with good results, but I know it will not fit into every strategy. The more standard settings for the thresholds are 25,50,75 and you can change them to those if you want, but I suggest taking a look at the Fib version first.
The ADX smoothing is set up for Crypto trading on Mid to High TFs. If you are trading sub 1hour charts I would suggest changing it to 3-4. If you are trading traditional markets it is probably a good idea to have it set somewhere between 6-14 (default is 14), but I am not a professional so please do your own testing and research.
Colours:
ADX going up = Green
ADX going down = Red
DMI+ going up = Bright Aqua
DMI+ going down = Turquoise / Dark Aqua
DMI- going up = Bright Purple
DMI- going down = Dark Purple
(if someone finds a better colour system please let me know as it is tricky to get it looking good without being unicorn puke)
This is my first script and I am just beginning to learn PineScript so somethings may have been done in an unorthodox manner but I believe everything is working as it should, however, I am happy to make any improvements. I'm interested in what people think of the Fib levels on this indicator and would love to hear people opinions and results in the comments.

Micro Strategy PremiumSince the decision to buy 38,250 Bitcoin under their new treasury policy. Micro Strategy has become an easy and tax efficient way for many investors to gain an exposure to Bitcoin.
This script displays:
- Micro Strategy premium vs price of BTCUSD (CME)
- Micro Strategy premium vs price of BTCUSD (CME) minus Nasdaq 100 (QQQ ETF). A straightforward method to detach Micro Strategy’s share price from the overall performance of the US tech sector. This could potentially give you a more accurate premium.
- Micro Strategy’s 38,250 BTC as a percentage of their Market Cap
This script also acknowledges that Micro Strategy should be renamed “Macro Strategy” and that Michael Saylor is a living legend.

OnTheMoveWith this plot one is able to compare the different % change in the given time frame. It calculates the sma of a given period (defval = 7) for the close/open.
Strategy would be to choose (trade) from one to other asset in order to get higher rates when pumping or lower when dumping.
The Symbol & exchange has to be specified.
defSymbols = BTC, ETH and LINK
defExchange = BINANCE

GBTC Fomo Panic PremiumIt is rumored that GBTC price action leads the Bitcoin market. This indicator compares GBTC fomo/panic levels to the (Binance) BTC spot market. Fomo is measured as large percentage moves of the high price from the min over a look-back period. Panic is measured as large percentage moves of the low price from the max over a look-back period. A prime example of this indicator's usage would be as a sell signal confirmation during the 2020 pre-Thanksgiving panic exhibited on the 1-hour chart while the 20 EMA was still above the 99 SMA.
You can customize the leading and lagging markets and the length of the lookback period. I would love to hear what parameters, markets and timeframes work for you. Maybe there is a way to leave comments, or hit me up on Twitter: @thirdreplicator
May you profit and enjoy.

[5F] Total circulating Bitcoin-═════════════════════════-
📋 Description :
This script displays several informations about Bitcoin :
the maximum number of Bitcoin
number of mined BTC
number of unmined BTC
calcul them in %
shows the previous halving date
📆 Note : need to be in dayli resolution or higher
Thanks to all Pinecoders who share their work with the community.
-═════════════════════════-

Buy/Sell ZonesEN:
This indicator is made to display main buy/sell zones of an asset. The core parameters are: Price, Volume and Donchian Channels.
It is more trend-based and may be suitable for swing traders or those who trade higher timeframes (1D and above).
The plotted colors display the dominance of buyers, sellers or indecision on the market at the current timeframe.
If the zone is green - consider opening Long/Buy positions.
If the zone is red - consider opening Short/Sell or scale out your position.
The white zone displays indecision between Bulls and Bears - consider not to take any trades within white zone.
RU:
Этот индикатор показывает зоны покупателя/продавца выбранного актива. Основные параметры расчета: Цена, Объем и Каналы Дончиана.
Он является индикатором трендового анализа и больше подходит для свинг-трейдеров или тех, кто торгует на старших таймфреймах (от 1Д).
Отображаемые цвета показывают доминацию продавца, покупателя или неопределенность на рынке в конкретный временной период.
Зеленая зона указывает на преобладание покупателя - возможно открытие длинных позиций/покупок .
Красная зона указывает на преобладание продавца - потенциальный момент для открытия коротких позиций/продаж или сокращения своих длинных позиций/покупок .
Белая зона указывает на неопределенность на рынке - в этой зоне лучше не предпринимать никаких торговых решений .
EN: This indicator may be used for Crypto markets
RU: Этот индикатор можно использовать для криптовалютных рынков
BITSTAMP:BTCUSD
BITSTAMP:ETHUSD
COINBASE:COMPUSD
EN: Stocks, CFD and commodities
RU: Акций, CFD и рынков сырьевых товаров
FOREXCOM:SPXUSD
NASDAQ:TSLA
NYSE:BA
NASDAQ:EBAY
FOREXCOM:XAUUSD
EN: Consider using it with respect to Your trading style, money- and risk-management as well as other indicators
RU: Используйте этот индикатор в соответствии со своим стилем торговли, риск-, мани-менеджментом и другими индикаторами.

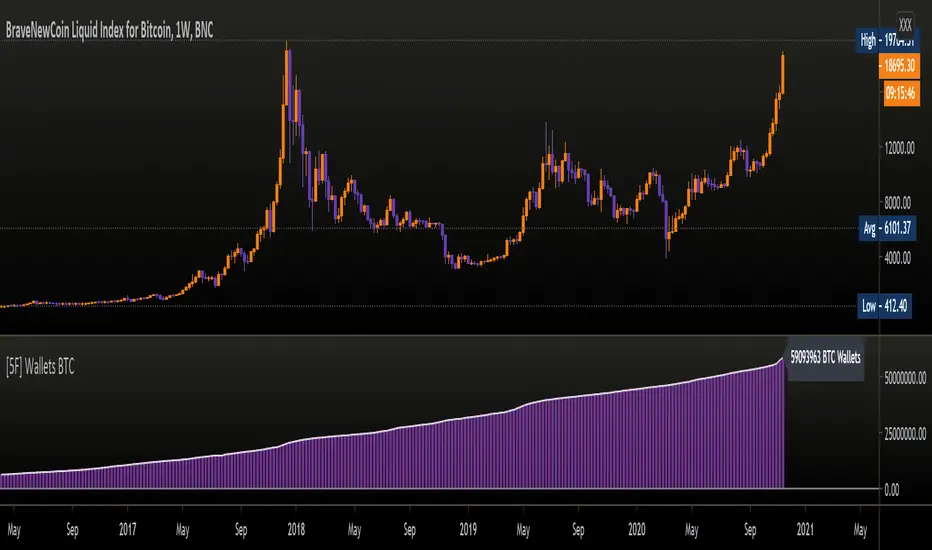
[5F ] Number of Bitcoin wallets-═════════════════════════-
This is a simple script that displays the total number of Bitcoins wallets based on the data provided by Quandl.
Use it in dayli resolution minimum
Refresh every day
Thanks to all Pinecoders who share their work with the community.
-═════════════════════════-
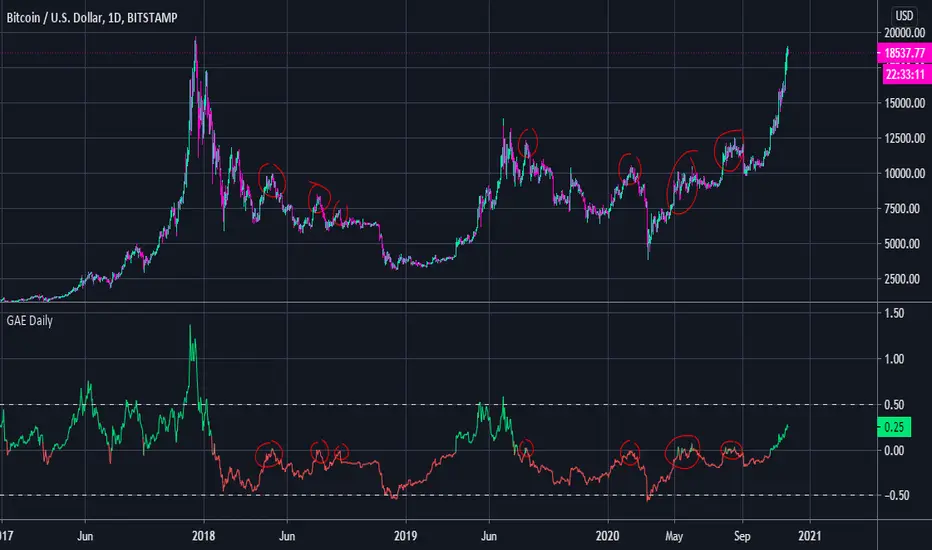
General Accumulation Evaluation BULL or BEAR Daily TrendGeneral Accumulation Evaluation by Lordchicken aka Chikun
This indicator is ONLY useful on the daily time frame and ONLY on BTC.
It will show you the general trend of BTC.
Basic:
X > 0 = Bullish trend
X < 0 = Bearish trend
X > 0.5 = Overbought
X < -0.5 = Oversold
Advanced:
If X < 0 and tries to go above 0 that's a good place to short
The end of a Bull/Bear trend is often shown with a strong reaction of X going above/beneath 0.
PT Trend BarsVersion 1.0 of our Trend Bars Indicator offers a visual of the current trend. The purpose of it is to help you avoid counter trading the trend. It will not identify the exact top or bottom, but it will help you identify overall in which direction the market wants to head. High time frame trend bar candles will allow you to ride the wave for multiple weeks.
White candles indicate bullish trend
Black candles indicate bearish trend
Strategy:
Daily is our favorite time frame to use when trying to identify the overall macro trend of the asset. Once we cross bull with three consecutive white candles, we can assume we are bullish until the candles flip bear again (black). On lower time frame, if the candles flip color but the price is going against trend, you can assume we are going for a retest.
This Oscillator is best used with the PT Buy Sell indicators we provide. It offers extra confluence for a stop loss & for a target for swing setups. It is included as part of the library. Just message us for access!

MA+ADX+DMICOINBASE:BTCUSD
BINANCE:BTCUSDT
Use long and short moving average to look for a potential price in/out. (default as 14 and 7, bases on the history experience)
ADX and DMI to prevent the small volatility and tangling MA.
Test it in 4HR, "BINANCE:BTCUSDT"
From 12/1/2017- 11/1/2020 (Mixed Bull/Bear market)
Overall Profit: 560.89%
From 1/1/2018 - 1/1/2019 (Bear market)
Overall Profit: -2.19%
From 4/1/2020 - 11/1/2020 (Bull Market)
Overall Profit: 274.74%
Any suggestion is welcome to discuss.

S2F Price LevelsThis is the indicator that plots Bitcoin's Stock to Flow model price and its significant levels.
Grey: S2F price
Green: S2F bottom (S2F multiple of 0.5)
Blue: S2F mode (S2F multiple of 0.67)
Red: S2F top
