Megalodon Pro Utility PanelHow to use?
Simply, add the indicator and follow the timing and kill zone signals on the screen.
This indicator is designed for Daily time frame for longer term analysis and 1 minute time frame for shorter term analysis.
Turn on the kill zone feature for overlaying different kill zones.
Turn on Day Trading checklist feature for becoming a better Day Trader using Megalodon indicators.
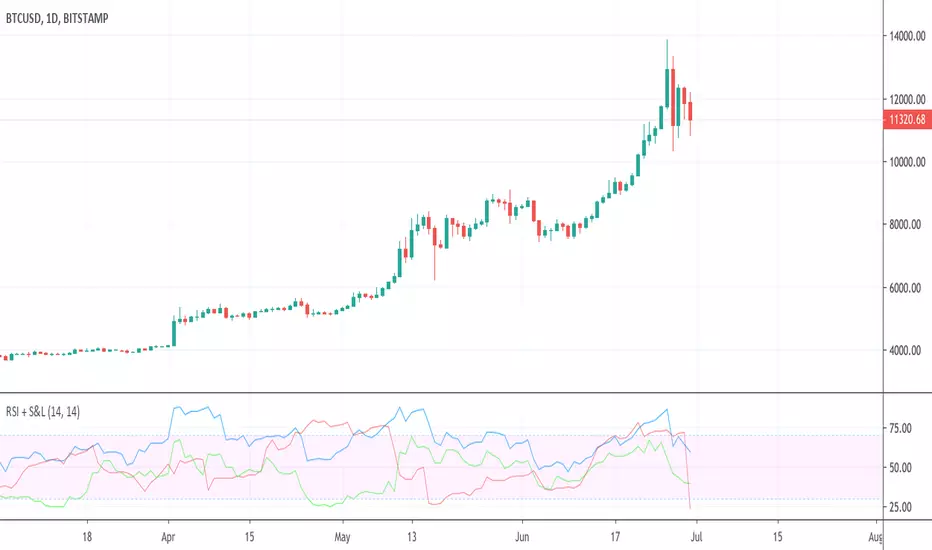
BTCUSD

RSI + BTC Short & Long RSIsPlots the RSI for the current chart (same as the built-in RSI indicator) and adds the RSI values for the Shorts and Longs (S&L) from Bitmex. The main reason I've used the RSI value is to have it on the same scale as the price chart's RSI. The general trend of the S&L is preserved.
Volatility BandsWe used Marc Chaikin’s Chaikin Volatility as somewhat of a baseline for this indicator and then built on it. Like Chaikin Volatility, our indicator draws primarily upon high-low spreads to quantify a security’s volatility. It also has similarities to Keltner Channels as it uses ATR rather than standard deviations in its calculation of the different bands.
Inputs:
int ‘len0’, lookback window for fast EMA of high-low ranges.
int ‘len1’, lookback window for slow EMA of high-low ranges.
int ‘len2’, lookback window for slow EMA of closing prices.
float ‘m0’, ATR multiplier for first upper and lower volatility bands.
float ‘m1’, ATR multiplier for second upper and lower volatility bands.
float ‘m2’, ATR multiplier for third upper and lower volatility bands.
int ‘lenATR’, window length for ATR calculation.
Output: 3 Upper and Lower Volatility Bands (6 total).
1. Compute High Low Spread for current period.
hlr = (high – low)
2. Calculate Exponential Moving Average of HLR at length len0
fastEMA = ema(hlr, len0)
3. Calculate Exponential Moving average of HLR at length len1 (where len1 > len0)
slowEMA = ema(hlr, len1)
4. Get EMA of closing prices at length len2(where len2 > len1 and len1 > len0)
priceEMA = ema(close, len2)
5. Use adjusted Chaikin Volatility Formula to quantify volatility
v = (fastEMA – slowEMA) / slowEMA
6. Calculate three upper and three lower volatility bands (6 total):
ex:
upper0 = priceEMA + ((1 – cv) * (atrMult0 * atr(lenATR)))
lower0 = priceEMA – ((1 – cv) * (atrMult0 * atr(lenATR)))
One possible way to use this indicator is to enter a long position when the security’s price falls below the lowest volatility band and then exit when it crosses above the third upper band. This seems to get the best results for quick, high frequency trading. Another approach is to enter a position when the bands begin to break out from a compact state and the width between them increases.
Still tweaking the idea, so any feedback would be appreciated.

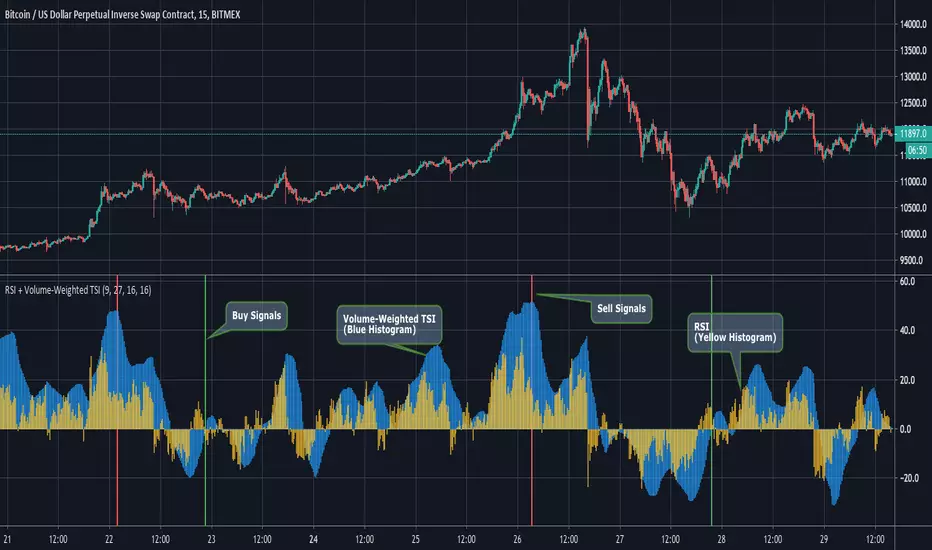
RSI + Volume-Weighted TSIThis indicator combines a standard RSI with a modified TSI.
Although a double smoothing process is already used in calculating the normal TSI, we decided to apply a volume weighted moving average of length (length_of_slow_TSI_EMA // 2) to it. This resulted in a smoother TSI that picked up on large-scale swings very nicely.
Entry Signals are generated when the Volume-Weighted TSI crosses above zero from negative into positive territory. Exit signals are generated when the TSI is above 40 and then begins its downward fall, along with a declining RSI value.
The Graph:
The Volume-Weighted TSI is plotted as the blue histogram, wile the RSI is plotted as the yellow histogram. We definitely wanted to go the simplicity route on this one's graphics, since the RSI and TSI are both classic and reliable indicators.
The green background highlights indicate an entry signal and red highlights signify an exit signal.
Input Options:
-length of Slow EMA for TSI
-length of Fast EMA for TSI
-Length of Volume Weighted MA of TSI.
-Length of RSI.
~Happy Trading~
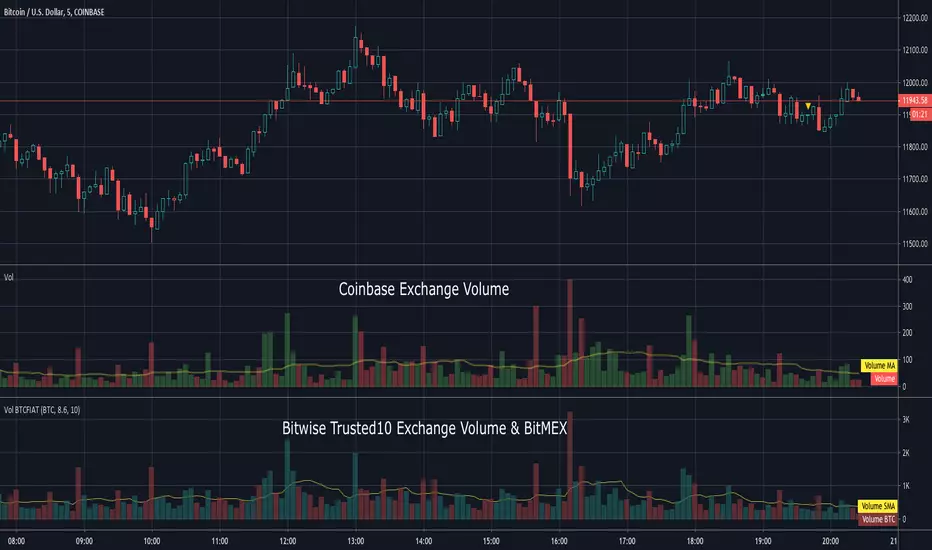
Volume BTCFIATThis indicator shows the aggregated volume of BTCFIAT of the Bitwise "Trusted 10" Exchanges that are available on TradingView.
I did not include every currency or stable coin available on these exchanges due to some being inconsequential in volume .
I also included option to show BitMEX deleveraged amount. Recent report suggests average leverage used there is 8.6X.
Volume can be shown in BTC or USD amounts. The moving average can be adjusted and if set to 0 will hide it.
Due to the number of lookups please be patient while loading. It will take a moment to display.
To load search Indicators for "Volume BTCFIAT" and click to load.
This indicator does not require access from me.
CME & XBT - BTC Futures Settlement DatesHi everyone
This in an indicator inspired by Scarrff
I added the XBT quarterly and yearly settlement dates
Enjoy
David

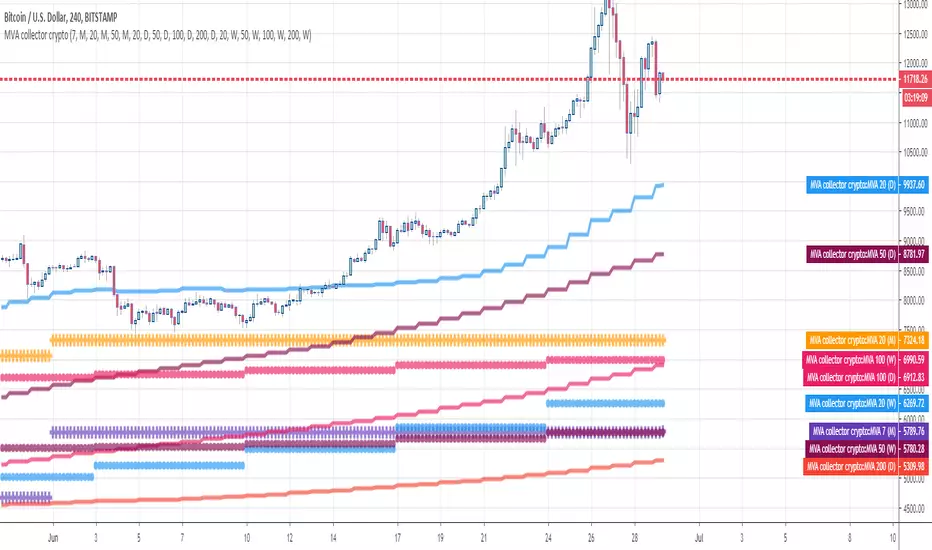
MVA collector cryptoHello Traders
This indicator draw multiple Simple Moving Averages multi-timeframes at once
I use it to define take profit zones for my crypto trading
Hope you'll like it
Enjoy
Dave
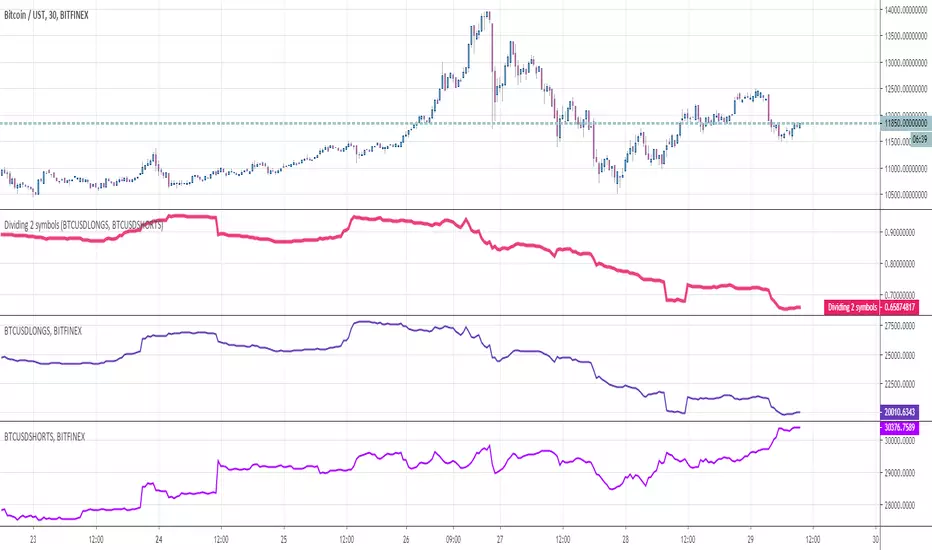
Dividing 2 symbolsHello Traders
This indicator is used to divide two assets between them. Why you would ask ?
For instance, in crypto trading, traders often look at the ratio Longs/Shorts or Shorts/Longs to figure out which side is leading the market and use this information as a powerful hedge for their next trade
Enjoy
Dave
Strategy Builder Crypto V6Hello everyone
This indicator is the result of 7 years of trading (including 3 years of analyzing day and night how crypto assets behave).
I made it fully customizable but I wouldn't recommend changing the default values as they're the most optimal ones for now. Might change in the future but I'm very happy with the signals so far and I hope you'll be as well :)
Without further due, let's dig into it...
0 - Algo trading and Why
In the crypto trading, there is a lot of useless noise (we can probably thank Crypto Twitter for that :p) and a lot of useless data with the sole purpose is to lure you (who said Bitfinex Long/Short ratio or CME gaps ??)
I wanted to remove all the useless and only focus on Technical Analysis (TA) because I was deeply convinced that TA includes by design Fundamental Analysis (FA) and Pumponomics Analysis (PA) - PA being for instance when your favorite twitter guru will pump and dump on you
I heard that so many people got REKT from the previous bear market and I wanted to give back to the community - who helped me so much a few years back.
I worked hard to design the method and make it simple for the public and for FREE (so far as I want to collect feedbacks from the community and improving the indicator)
THIS IS MY GIFT TO YOU
1 - Input values
I'll explain later on through a medium article what each parameter means and how to set them up. For now, please used the optimized and recommended values already set in the indicator
2 - The method
This method works for intraday trading for timeframes between m5 and H1. Any timeframe above could work but would give signals too late - in this case, I would recommend changing the inputs with smaller values to adjust
I see a trend being composed of a main trend, and mini sub trends. In other words, for instance, a weekly bullish trend is made of smaller H4 bullish trends. Hope it makes sense so far
Let's call the weekly trend the MAIN trend and the H4 smaller trends the SECONDARY trends
That's exactly what this indicator is about
It will catch the best MAIN trend and all the SECONDARY trends in the same direction of the MAIN trend.
It's up to you if you want to take all the SECONDARY trends or only the first one in the sequence.
3 - Invalidation signal
A signal invalidation is used to make you exiting your position with a small loss before your stop loss will get hit. Very powerful way to save your capital and limit your losses.
You'll find the indicator here on tradingview for free under the name Trend signal with Alert (made by myself)
Trend signal with Alert
to invalidate entries. You'll need to request an invite
Briefly, let's assume we get a BUY signal. I would exit the position either if I'm getting a DOWN trend signal. It means, if the oblique/logarithmic trendline is broken, then it's better to exit the position and wait for the indicator to give another BUY signal later hopefully
Best case, it will limit your loss in case the asset will dump.
Worst case, this strict management strategy will make you exiting your position for no reason and you'll re-enter later (with a signal) at almost the same price or a bit higher
In the long run, this method will prevent you from having big losses
4 - Stop Loss and Take profits levels
It's really up to you. It depends of your capital and psychology
This indicator is made to give big moves but that's not 100% guaranteed. You can draw some trendlines or use moving averages in big timeframes to set your take profit and stop loss levels.
I personally use this also, along with fibonacci on the weekly/monthly timeframes for my take profit levels
As I'm a nice person, I'm linking the Fibonacci indicator that I use here
Automatic Multi-timeframes fibonacci zones
. You'll also need to request an invite for that one
4-bis - Trailing stop
Not financial advice but I use a supertrend and I have a software that will trail my stop according to that supertrend level
For LONG positions, we could set the trailing below the supertrend.
For SHORT positions, we could set the trailing above the supertrend.
You'll find the indicator here on tradingview for free under the name Supertrend V1.0 - Buy or Sell Signal
5 - Which assets
It's working with the default values on major/mid/small caps and for ALTS/BTC, ALTS/USD and ALTS/ETH pairing
YES, THIS IS MOST AWESOME THING OF THE ENTIRE UNIVERSE !!!
6 - Best setup
m15 timeframe is my preferred one for this method. Best Risk/Reward/Invalidations ratio among all other timeframes
I strongly recommend to use the Trend Signal with the input value 14 for the invalidations
If you enter on a BUY signal, and get a RED trend signal, exit immediately the position without waiting for any other confirmation/pullback or anything else
If you enter on a SELL signal, and get a BLUE trend signal, exit immediately the position without waiting for any other confirmation/pullback or anything else
For the trailing stop/Supertrend value, it depends of your capital and how big your stop loss should be. I personally use the settings in the Supertrend indicator
7 - Alerts
You can setup alerts for the primary and secondary signals in Tradingview so that you won't have to stare at the charts all day long. You mental healthy is my priority above everything else :)
8 - More to come
I personally use the alerts from this indicator coupled with a system to take the trades given by the tradingview alerts. I'll publish it later on if I feel the indicator collects enough interest from you guys

OBV Z-ScoresThis study calculates the On-Balance Volume (OBV) and displays it in terms of its Z-Score.
OBV is a great momentum indicator . As the name suggests, OBV predicts changes in price based on the security's volume flow.
Formula:
if (Current Price > Previous Price)
then Current OBV = Previous OBV + Current Volume
if (Current Price < Previous Price)
then Current OBV = Previous OBV - Current Volume
if (Current Price == Previous Price)
then Current OBV = Previous OBV
As the formula shows, the OBV goes a step beyond just looking at the pure volume of a security. Instead, it factors in relative price action from period to period to reflect investor sentiment. As a result, we often look to the OBV to spot bullish or bearish trends while they are in the early stages of development or simply predict impending uptrends or downtrends.
To make the OBV easier to visualize, we converted the value to a Z-Score. The Z-Score is a simple statistical measurement and represents the current OBV value's distance from the mean OBV value in terms of # of standard deviations.
Users can adjust the values for the 2 upper bounds for Z Scores and 2 lower bounds. Additionally, the n value for z score calculation can be adjusted in the input menu. A higher n value means the z score will be based on a longer lookback period. A lower value will result in more sensitive readings.
Overall, I think this is an interesting way to represent OBV values and will be a valuable leading indicator.
~Happy Trading~

Modiied Elder Ray Index(Bull or Bear)Here's a modified version of the Elder Ray Index created by the famed Dr.Alexander Elder. This indicator has proven to be especially helpful lately given the crazy state of crypto.
Slow Moving Average :
The top chart shows the moving average used to filter trends. I recommend using a higher window length(can be adjusted with the 'lenSlowMA' input option). I wanted this to be a very smooth moving average, so I used the following formula:
slow MA = ema(vwma(close, 64), 64)
This resulted in a pretty smooth line that still detects major price movements very well.
-The background and bar colors both change in response to the Slow MA's value. The background and bars change to green when a bullish trend is detected and red when bearish.
Bear and Bull Power :
To balance things out a little, I included two histogram's based on Elder's Ray. Here, a more responsive EMA with a shorter window length is used to calculate the bull and bear power values and track short-term price fluctuations.
NOTE: The length of the EMA used here can be adjusted in the input menu.
Bull Power = current high - EMA(close, 13)
Bear Power = current low - EMA(close, 13)

Momentum TraderThis study combines two versatile momentum indicators :
Chande Momentum Oscillator:
-Measures trend strength, with higher absolute values meaning greater strength.
-Also tracks divergence. When price increases, but is not accompanied by an increase in Chande Momentum Oscillator values, it signifies bearish divergence and a reversal is likely to follow.
-Shown as the teal and pink histogram.
Percentage Price Oscillator:
-Similar to the MACD, except that it expresses the difference between the two moving averages in terms of a percentage. This makes it a little easier to visualize.
-PPO values greater than zero indicate an uptrend, as that means the fast EMA is greater than the slow (and vice versa).
Entry and Exit Conditions:
Enter When:
1) Chande Momentum crosses over zero from negative to positive territory. AND
2) It has been less than 3 bars since Chande Momentum was less than the lower green line. AND
3) Chande Momentum is rising(positive slope).
Exit When:
1) Chande Momentum is greater than the upper line. AND
2) It has been less than 6 bars since the PPO value was greater than the upper bound. AND
3) PPO is less than 5 (meaning the difference between the two EMA's is less than 5%). AND
4)PPO has a negative slope.
This study comes with alert conditions for long entries and exits.
~Happy Trading~

Mayer MultiplerThe ‘Mayer Multiple’ is one of the most popular metrics and derives from the current price divided by the 200-day moving average (200-MA). The average value is 1.39, and historically, when it becomes equal to or greater than 2.4 it will retrace to under 1.5.
Simulations performed by Trace Mayer determined that in the past, the best long-term results were achieved by accumulating Bitcoin whenever the Mayer Multiple was below 2.4.
Since the simulations were based on historical data, they are purely educational and should not be the basis of any financial decision.
Credit:
bitcoinist.com
mayermultiple.info

Double ALMAIncludes fast and slow Arnaud Legoux Moving Averages (ALMA). ALMA is a moving average based on a Gaussian(normal) distribution that reduces lag while still retaining smoothness.
Input Options:
-Offset : Value in range {0,1} that adjusts the curve of the Gaussian Distribution. A higher value will result in higher responsiveness but lower smoothness. A lower value will mean higher smoothness but less responsiveness.
-Lengths : The lookback for each ALMA calculation.
-Sigma : Defines the sharpe of the curve coefficients.
The slow ALMA is the thickest red and green alternating line that indicates bullish or bearish movement. When slow ALMA is bullish, the graph's background changes to green. When the slow ALMA is bearish, the background is red.
The fast ALMA uses a smaller lookback and is more responsive than the slow ALMA as a result of the shorter length and higher default offset parameter.
The two dotted lines represent (slowALMA +/- 1.25 * stdev(slowALMA, slowALMA period *2)).
The indicator bases its buy and sell signals based on the trend identified by the slow ALMA and the fast ALMA's crossings of the standard deviation bands.
Comes with pre-set buy and sell alerts.

Double KAMA + VWMAThis study combines a fast and slow Kaufman Adaptive Moving Averages (KAMA) with a fast and slow Volume-Weighted Moving Average(VWMA).
The KAMA is definitely one of our favorite moving averages because it takes into account volatility and filters out false signals during periods of insignificant or horizontal price movement. This results in more patient, less impulsive trading. At its most basic, the KAMA's value remains relatively close in value to the price when volatility is low then lags slightly behind it during highly volatile movements and larger trends.
We've plotted two Kaufman's Adaptive Moving Averages:
-The first KAMA is the slow KAMA, which we use as a trend filter. It is shown on the graph as the thicker solid line that alternates between green and red. When the trend filter KAMA is bullish, the line turns green. It then turns red when bearish. Users can adjust the lengths of the fast and slow EMA for the KAMA's calculation in the input option menu, but it is important to remember that the number of periods should remain high in comparison to the fast KAMA as this allows it to track long-term price movements and trends.
-We then include a fast KAMA which has shorter EMA Lengths to focus in on movements within a smaller timeframe.
NOTE: The fast KAMA is only plotted when the trend filter KAMA is generating bullish signals. It is shown as the alternating pink and teal line above the main green line. When the fast KAMA is increasing, its line and the area between it and the slow KAMA are filled teal. When the fast KAMA is falling, its line and the area between the fast and slow KAMA lines are colored pink. This helps with timing exits.
Lastly, we've included a fast and slow VWMA to time long entries. These are only plotted when the Trend Filter KAMA is bearish. The fast VWMA is the teal solid line under the trend filter KAMA and the slow VWMA is the pink line. Optimal entries will occur when the fast VWMA crosses above the slow VWMA. When the slow VWMA is greater than the fast VWMA, the area between the two lines is filled red, while the same area is filled teal when the fast VWMA is greater than the slow.
I've included entry signals (shown on the screenshot as the lime green background highlights), but this is the basic version of the indicator. If you're interested in taking a look at the full version with alerts and entry + exit signals, feel free to send us a message!

VWMA/SMA Breakout and Divergence DetectorThis indicator compares four different values :
-Fast Simple Moving Average(SMA)
-Fast Volume Weighted Moving Average(VWMA)
-Slow SMA
-Slow VWMA
Comparing SMA's and VWMA's of the same length is a common trading tactic. Since volume is not taken into consideration when calculating Simple Moving Averages, we can gain valuable insights from the difference between the two lines.
Since volume should be increasing along with an upwards price movement, the VWMA should be greater than the SMA during a volume-supported uptrend. Thus, we can confirm an uptrend if the VWMA remains greater than the SMA. If the VWMA falls under the SMA in the midst of an upwards price movement, however, that indicates bearish divergence. The opposite is true for downtrends. If price is decreasing and volume is decreasing at the same time (as it should), then we can confirm the downtrend.
Interpreting the Graph:
If the slow SMA is greater than the slow VWMA, then the area representing the difference between the two lines is filled in red. If the slow VWMA is greater than the slow SMA, however, the area between the two is filled green.
If the fast SMA is greater than the fast VWMA, then the area between the two dotted lines is filled in red. On the other hand, the area will be filled green if the fast VWMA is greater than the slow SMA.
In addition to spotting divergences and confirming trends, the four lines can be used to spot breakouts. Typically, a VWMA crossover will precede the SMA crossover. When the fast VWMA crosses over the slow VWMA and then a SMA crossover follows shortly after, then it is a hint that a bullish trend is beginning to form.

Bitcoin Fat Volume IndicatorBitcoin Fat Volume Indicator
The script displays aggregate sums of Bitcoin dollar and Tether market volumes separately as follows:
USD markets (blue): gemini, coinbase, okcoin, kraken, bitfinex, bitstamp, btce, mtgox
Tether markets (orange): huobi, binance, bittrex, poloniex, hitbtc
The indicator should work on all time frames on any chart so long as volume data exists. Obviously for full history use Bitcoin Liquid Index.
The indicator is slow that's why I'm not including other stable coins or fiat markets at present.
Use settings to turn off Tether or USD bars as desired.

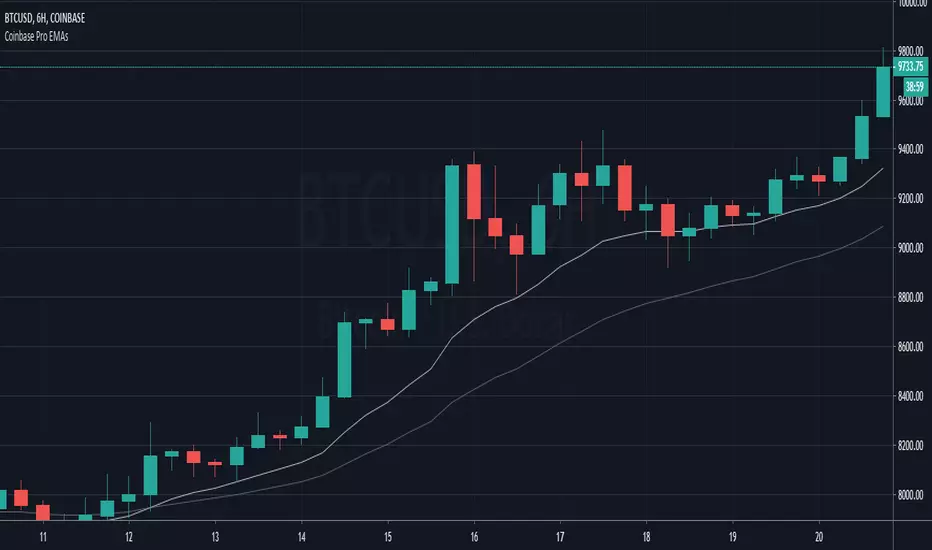
Coinbase Pro EMAsAn indicator to match the only overlays available on Coinbase Pro charts, the EMA12 and EMA26.
Bitcoin Golden Ratio Multiplier FibonacciA Script based on the wonderful article by Philip Swift (@PositiveCrypto) "The Golden Ratio Multiplier - Unlocking the mathematically organic nature of Bitcoin adoption"
Please read article for understanding use.
Best used on Daily

Golden Ratio Multiplier: Multiplied Moving AveragesThe script for plotting DMAs from the study made by @PositiveCrypto (twitter)

Golden Ratio Multiplier: Multiplied Moving AveragesMultiplied moving averages script visualizing the study made by @PositiveCrypto (twitter).

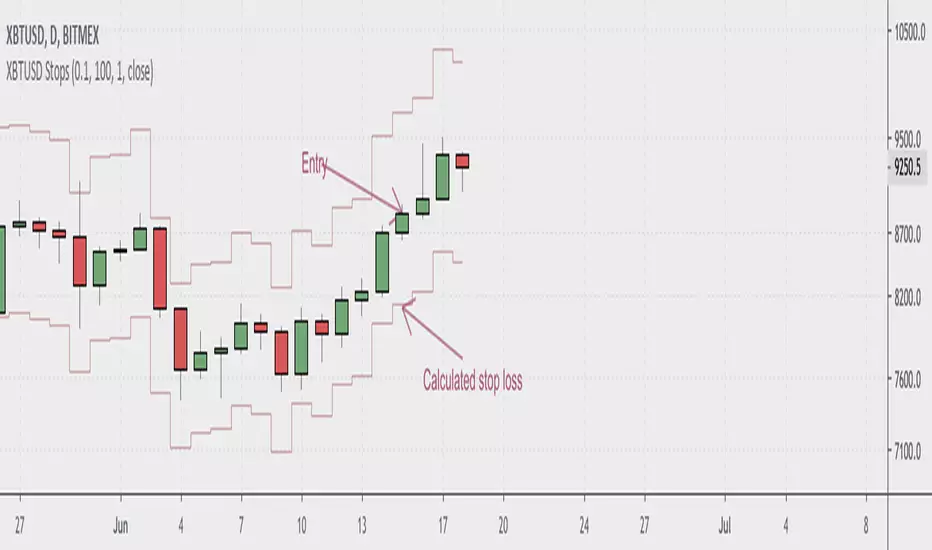
BitMex XBTUSD StopLossShows you where to place your stop loss when trading the Bitcoin swap and futures contracts on BitMex. Enter your account size, position size, and desired risk per trade in the indicator settings. If stop seems too tight, use a smaller position size. Most seamlessly used with cross leverage on BitMex. Make sure to keep an eye on the liquidation level for your trades.
PpSignal ADX/DI HistogramHere we have the ADX with DM histogram signal, and volatile Bollinger Band (period 13, Deviation 0.61).
the best signal is when adx is into volatility and dm histogram is going in the same directions.
For example if you detect a up channel...you will buy when DMI histogram is in buy signal (green) and Adx is abobe the bollinguer band. and in e green color.
