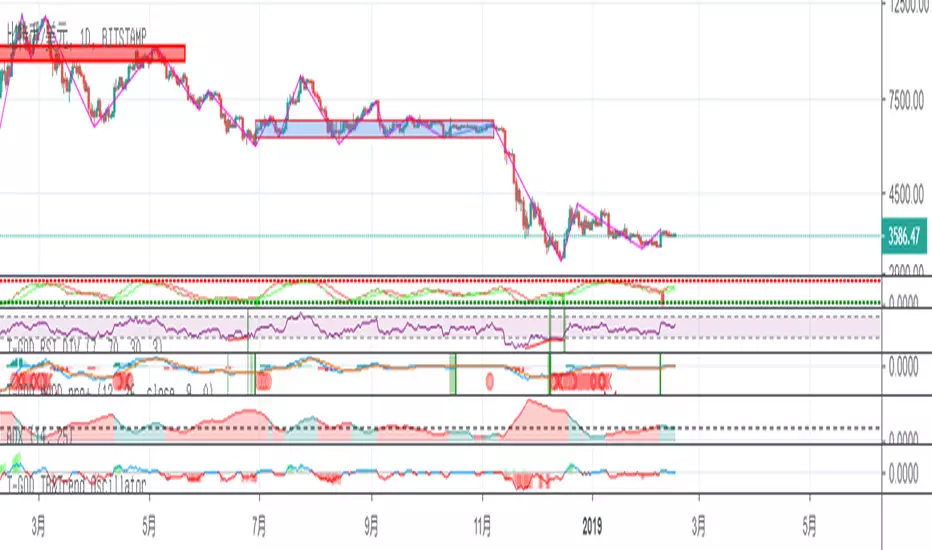
T-GOD TB&Trend OscillatorUsage:
Front side trading: In bumppy market. Use this oscillator to find the top and the bottom of the market. When the hist comes to green, you can find the market bottom by the lowest blue line. When the hist comes to red, the highest red line may help you to find the possible market top.
Back side trading: red line for long trend,blue line for short trend.
For reference only! !
Bump
WhenWasThePriceAction
Bars of largest range (volatility)
* see moments of strongest price action immediately
* colored & upDown by candle color
* amplifier: you see only the bull runs, and subsequent dumps
Very nice on the 5 years scale of BITSTAMP:BTCUSD - nothing comparable to 2013 has happened yet.
Internals:
squared_range = pow(high-low, 2)
That is essentially it already. The rest are details:
* gauge with (in case of Bitcoin exponentially rising) price
* show in red for negative candles
* take even higher polynomial (than 2) to show only the very largest values
* allow some user input (but there is not much more that can be chosen here.)
Sorry for such a simple formula - but sometimes the easiest things are powerful.
Please give feedback. www.tradingview.com and/or in the cryptocurrency chat. Thanks.
