Adaptive Buy Sell Signal [AvantCoin]
A comprehensive customized indicator for different markets
🔴Before you start🔴:
Please note that this tool is designed to assist you in analyzing the market, and NOT to make buy/sell decisions for you. You should combine its data with your own strategies and indicators before making any trading choices
====================
Market-Specific Optimizations
Auto-Detection (or Manual Selection)
It automatically detects which market you're trading:
Forex (EUR/USD, GBP/USD, etc.)
Stocks (AAPL, TSLA, etc.)
Indices (NAS100, SPX, etc.)
Commodities (Gold, Silver, Oil)
Crypto (BTC, ETH, etc.)
avantcoin.com
Forex-Specific Features:
✅ Session Filters: Avoids low-liquidity Asian session
✅ Session backgrounds: Green for London/NY overlap (best trading time)
✅ Tighter ADX threshold (20) - good for Forex trends
✅ Lower volatility filter - skips dead zones
⚙️ Min Confluence: 5 (balanced)
⚙️ Cooldown: 5 bars
⚙️ Volume threshold: 1.3x (Forex has consistent volume)
avantcoin.com
Stocks-Specific Features:
✅ Market hours filter: Only signals during NYSE hours.
✅ Gap detection: Avoids trading immediately after large gaps up/down
✅ Higher ADX threshold (22) - Stocks trend differently
✅ Stricter volume requirement (1.5x) - Stocks vary more
⚙️ Min Confluence: 6 (higher quality)
⚙️ Cooldown: 3 bars (stocks move faster)
Indices (Nasdaq, S&P; 500):
✅ Similar to stocks but slightly more lenient
✅ Lower ADX (18) - Indices are smoother
⚙️ Min Confluence: 5
⚙️ Cooldown: 4 bars
Commodities (Gold, Silver, Oil):
✅ Highest ADX requirement (23) - Only trade strong trends
✅ Higher volatility filter (1.6x) - Commodities can be wild
⚙️ Min Confluence: 6
⚙️ Cooldown: 6 bars (avoid whipsaws)
Crypto:
✅ 24/7 trading (no session restrictions)
✅ Lower ADX (15) - Crypto is always volatile
✅ Much higher volume threshold (2.0x) - Crypto volume spikes
⚙️ Min Confluence: 4 (crypto moves fast)
⚙️ Cooldown: 3 bars
📊 Visual Enhancements:
Market Type Badge at top of table (Forex, Stocks, etc.)
Session Status:
Forex: Shows 🟢 LDN/NY, 🔵 London, 🟠 NY, 🔴 Asian
Stocks: Shows 🟢 Open or 🔴 Closed
Session Background Colors on chart (optional)
Current Settings Display: Shows your Min score, ADX threshold, Cooldown
⚙️ How to Use:
For Forex:
Enable "Avoid Asian Session"
Best signals during London/NY overlap
For Stocks:
Enable "Trade Stock Hours Only"
Watch for gap warnings
avantcoin.com
Buy-sellsignal


Wickless Heikin Ashi B/S [CHE]Wickless Heikin Ashi B/S \
Purpose.
Wickless Heikin Ashi B/S \ is built to surface only the cleanest momentum turns: it prints a Buy (B) when a bullish Heikin-Ashi candle forms with virtually no lower wick, and a Sell (S) when a bearish Heikin-Ashi candle forms with no upper wick. Optional Lock mode turns these into one-shot signals that hold the regime (bull or bear) until the opposite side appears. The tool can also project dashed horizontal lines from each signal’s price level to help you manage entries, stops, and partial take-profits visually.
How it works.
The indicator computes standard Heikin-Ashi values from your chart’s OHLC. A bar qualifies as bullish if its HA close is at or above its HA open; bearish if below. Then the wick on the relevant side is compared to the bar’s HA range. If that wick is smaller than your selected percentage threshold (plus a tiny tick epsilon to avoid rounding noise), the raw condition is considered “wickless.” Only one side can fire; on the rare occasion both raw conditions would overlap, the bar is ignored to prevent false dual triggers. When Lock is enabled, the first valid signal sets the active regime (background shaded light green for bull, light red for bear) and suppresses further same-side triggers until the opposite side appears, which helps reduce overtrading in chop.
Why wickless?
A missing wick on the “wrong” side of a Heikin-Ashi candle is a strong hint of persistent directional pressure. In practice, this filters out hesitation bars and many mid-bar flips. Traders who prefer entering only when momentum is decisive will find wickless bars useful for timing entries within an established bias.
Visuals you get.
When a valid buy appears, a small triangle “B” is plotted below the bar and a green dashed line can extend to the right from the signal’s HA open price. For sells, a triangle “S” above the bar and a red dashed line do the same. These lines act like immediate, price-anchored references for stop placement and profit scaling; you can shift the anchor left by a chosen number of bars if you prefer the line to start a little earlier for visual alignment.
How to trade it
Establish context first.
Pick a timeframe that matches your style: intraday index or crypto traders often use 5–60 minutes; swing traders might prefer 2–4 hours or daily. The tool is agnostic, but the cleanest results occur when the market is already trending or attempting a fresh breakout.
Entry.
When a B prints, the simplest rule is to enter long at or just after bar close. A conservative variation is to require price to take out the high of the signal bar in the next bar(s). For S, invert the logic: enter short on or after close, or only if price breaks the signal bar’s low.
Stop-loss.
Place the stop beyond the opposite extreme of the signal HA bar (for B: under the HA low; for S: above the HA high). If you prefer a static reference, use the dashed line level (signal HA open) or an ATR buffer (e.g., 1.0–1.5× ATR(14)). The goal is to give the trade enough room that normal noise does not immediately knock you out, while staying small enough to keep the risk contained.
Take-profit and management.
Two pragmatic approaches work well:
R-multiple scaling. Define your initial risk (distance from entry to stop). Scale out at 1R, 2R, and let a runner go toward 3R+ if structure holds.
Trailing logic. Trail behind a short moving average (e.g., EMA 20) or progressive swing points. Many traders also exit on the opposite signal when Lock flips, especially on faster timeframes.
Position sizing.
Keep risk per trade modest and consistent (e.g., 0.25–1% of account). The indicator improves timing; it does not replace risk control.
Settings guidance
Max lower wick for Bull (%) / Max upper wick for Bear (%).
These control how strict “wickless” must be. Tighter values (0.3–1.0%) yield fewer but cleaner signals and are great for strong trends or low-noise instruments. Looser values (1.5–3.0%) catch more setups in volatile markets but admit more noise. If you notice too many borderline bars triggering during high-volatility sessions, increase these thresholds slightly.
Lock (one-shot until opposite).
Keep Lock ON when you want one decisive signal per leg, reducing noise and signal clusters. Turn it OFF only if your plan intentionally scales into trends with multiple entries.
Extended lines & anchor offset.
Leave lines ON to maintain a visual memory of the last trigger levels. These often behave like near-term support/resistance. The offset simply lets you start that line one or more bars earlier if you prefer the look; it does not change the math.
Colors.
Use distinct bull/bear line colors you can read easily on your theme. The default lime/red scheme is chosen for clarity.
Practical examples
Momentum continuation (long).
Price is above your baseline (e.g., EMA 200). A B prints with a tight lower wick filter. Enter on close; stop under the signal HA low. Price pushes up in the next bars; you scale at 1R, trail the rest with EMA 20, and finally exit when a distant S appears or your trail is hit.
Breakout confirmation (short).
Following a range, price breaks down and prints an S with no upper wick. Enter short as the bar closes or on a subsequent break of the signal bar’s low. If the next bar immediately rejects and prints a bullish HA bar, your stop above the signal HA high limits damage. Otherwise, ride the move, harvesting partials as the red dashed line remains unviolated.
Alerts and automation
Set alerts to “Once Per Bar Close” for stability.
Bull ONE-SHOT fires when a valid buy prints (and Lock allows it).
Bear ONE-SHOT fires for sells analogously.
With Lock enabled, you avoid multiple pings in the same direction during a single leg—useful for webhooks or mobile notifications.
Reliability and limitations
The script calculates from completed bars and does not use higher-timeframe look-ahead or repainting tricks. Heikin-Ashi smoothing can lag turns slightly, which is expected and part of the design. In narrow ranges or whipsaw conditions, signals naturally thin out; if you must trade ranges, either tighten the wick filters and keep Lock ON, or add a trend/volatility filter (e.g., trade B only above EMA 200; S only below). Remember: this is an indicator, not a strategy. If you want exact statistics, port the triggers into a strategy and backtest with your chosen entry, stop, and exit rules.
Final notes
Wickless Heikin Ashi B/S \ is a precision timing tool: it waits for decisive, wickless HA bars, provides optional regime locking to reduce noise, and leaves clear price anchors on your chart for disciplined management. Use it with a simple framework—trend bias, fixed risk, and a straightforward exit plan—and it will keep your execution consistent without cluttering the screen or your decision-making.
Disclaimer: This indicator is for educational use and trade assistance only. It is not financial advice. You alone are responsible for your risk and results.
Enhance your trading precision and confidence with Wickless Heikin Ashi B/S ! 🚀
Happy trading
Chervolino

Inside candle (Inside Bar) Strategy- by smartanuThe Inside Candle strategy is a popular price action trading strategy that can be used to trade in a variety of markets. Here's how you can trade the Inside Candle strategy using the Pine script code provided:
1. Identify an Inside Candle: Look for a candlestick pattern where the current candle is completely engulfed within the previous candle's high and low. This is known as an Inside Candle.
2. Enter a Long Position: If an Inside Candle is identified, enter a long position at the open of the next candle using the Pine script code provided.
3. Set Stop Loss and Take Profit: Set a stop loss at a reasonable level to limit your potential losses if the trade goes against you. Set a take profit at a reasonable level to take profit when the price reaches the desired level.
4. Manage the Trade: Monitor the trade closely and adjust the stop loss and take profit levels if necessary. You can use the Pine script code to automatically exit the trade when the stop loss or take profit level is hit.
5. Exit the Trade: Exit the trade when the price reaches the take profit level or the stop loss level is hit.
It's important to note that the Inside Candle strategy is just one of many strategies that traders use to trade the markets. It's important to perform your own analysis and use additional indicators before making any trades. Additionally, it's important to practice proper risk management techniques and never risk more than you can afford to lose.

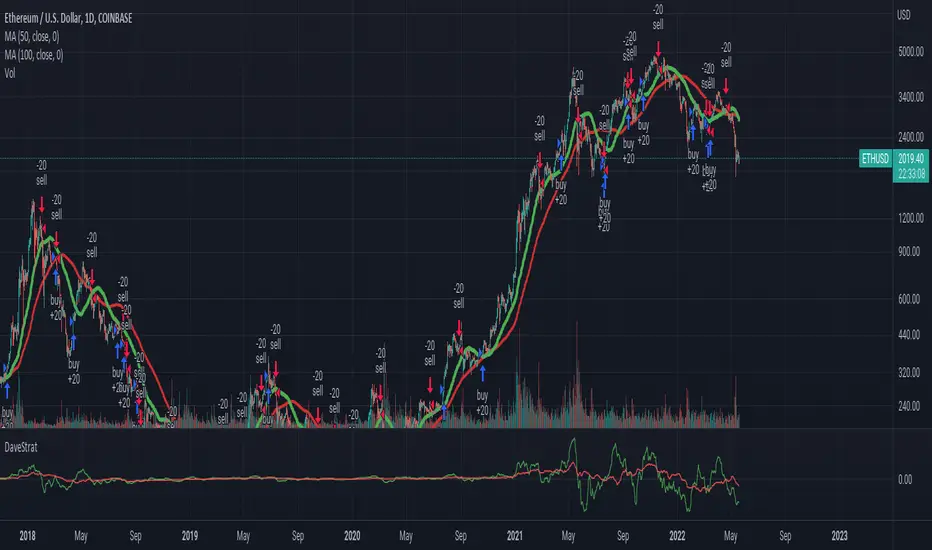
DaveStratThis script attempts to guess inflection points in cryptocurrency asset prices using change in two simple moving averages on the daily timescale.
CM_Twiggs Money FlowFull Credit goes to LazyBear for publishing Original Code.
I added:
Threshold lines that changes the color of Histogram based on if it exceeds Threshold lines. Ability to turn off and on.
Ability to Turn Histogram Off/On
Ability to turn Twiggs Money Flow Line Off/On

Premium Stochastic OscillatorThe PSO is a rewired version of a short-period stochastic. Unlike a standard stochastic oscillator, this indicator is normalized to register neutral values at zero while providing greater sensitivity to short-term price moves. This indicator uses a central zero line as a reference point and will oscillate above and below this point as price fluctuates. In addition, the PSO is smoothed by using a double exponential moving average to provide a more even response to turns in the market.
(from TASC magazine, August 2008 issue).
The Premium Stochastic Oscillator was introduced by technical analyst Lee Leibfarth.

Bull MountainsAre you a BEAR?
Then get out of here!
This indicator is only for long movements, its reading is simple and if you use it correctly it will give you very good results, the components are:
The highest quality configuration is as follows:
It is not necessary that all the components are aligned, the appearance of the upper mountain on the lower mountain is already a good sign, but if you add some seasoning more the soup will be better =)
Note: once the position is taken, it is the trader's responsibility to manage it. INSTRUMENTS WITH REAL VOLUME ARE REQUIRED FOR THIS INDICATOR.
tip: what would happen if you look for the signal in an upper frame and then look for an input in a lower frame? mmmmm....
tip: play with the 'Length' setting and see what happens
Bull a thumbs up please!
I wish you many greens !!
