[AN] AC ScalperScalp indicator.
Uses trend to switches to find the direction and entries. Has a built in exit system.
Also uses a trailing stop system in order to maximize gains.
Alerts can be added so trades can be automated.
Strategy that tests it:
Buysignal

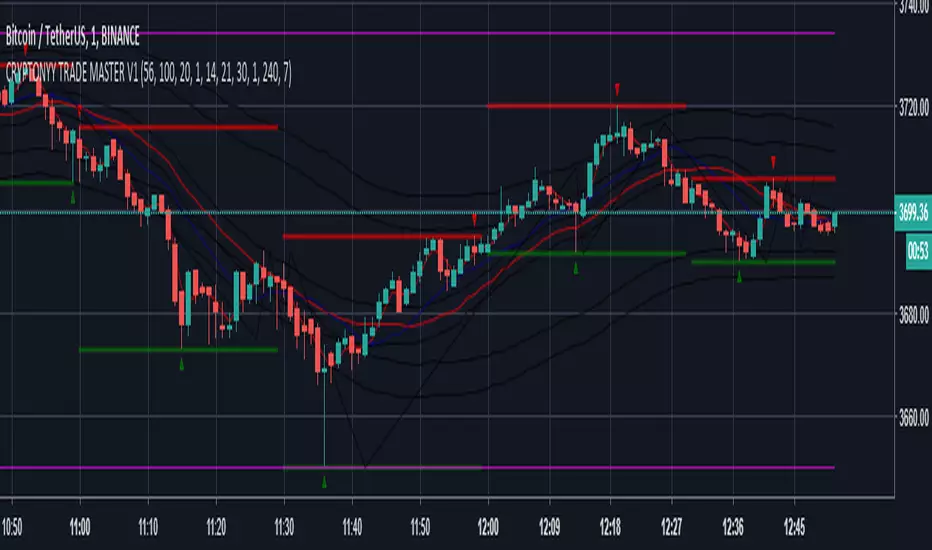
CRYPTONYY TRADE MASTER V1THIS SCRIPT IS ONLY MADE FOR BITMEX TRADERS.
IT WORKS ON 1MINUTE TIMEFRAME SMOOTHLY.
ADVANTAGES:
1. AUTO BUY/SELL SIGNALS.
2. 95% ACCURACY.
3. U WILL NEVER BE IN LOSS BECAUSE WE DEVELOPED THIS WITH OUR PERSONAL VOLATILITY INDICATOR.SO IF MARKET GOES OPPOSITE IT WILL GIVE U THE SIGNAL BEFORE YOUR LAST ENTRY PRICE.
4. DOUBLE CROSS INDICATOR.
5. MUCH VOLATILE=INCREASE THE SIGNAL ACCURACY.
6. 1MINUTE TIMEFRAME IS BEST TO TRADE WITH THIS SOFTWARE.
THOSE WHO WANT TO BUY THIS OR WANT DEMO COMMENT BELOW,I WILL MESSAGE YOU.
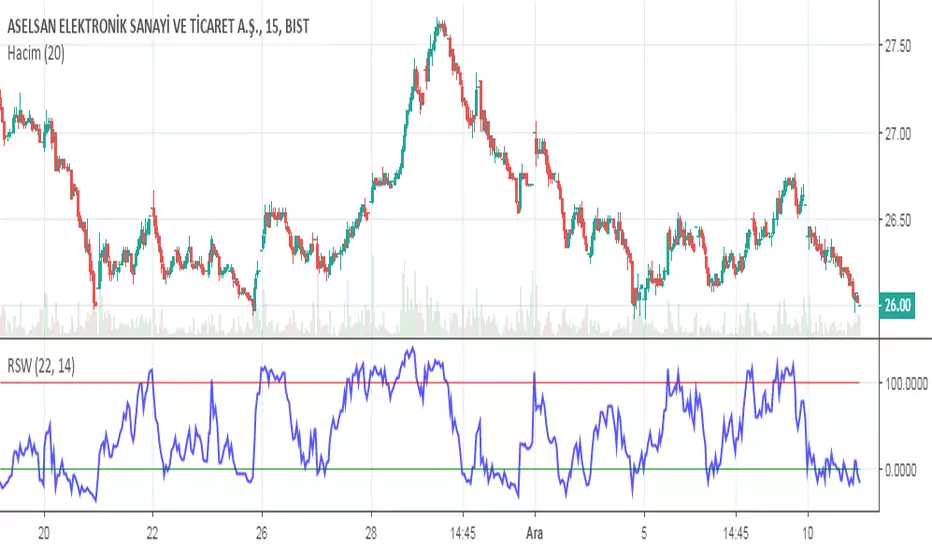
RSW - Realise Short WavesEnglish:
Works better in short term graphs, like 5mins, 15mins.
RSW aims to give you daytrading and stoploss signals.
Usage:
If crosses zero upwards: buy signal
If crosses zero downwards: stop signal
If crosses 100 upwards: buy signal
If crosses 100 downwards: sell signal
Türkçe:
Kısa vadeli grafiklerde daha verimli çalışır , mesela 5-15 dk.lık
RSW günlük al-sat-stop sinyalleri vermeyi amaçlar.
Kullanımı:
Sıfırı yukarı keserse: al sinyali
Sıfırı aşağı keserse: stop sinyali
100ü yukarı keserse: al sinyali
100ü aşağı keserse: sat sinyali
Total Power IndicatorHello traders!
This indicator was originally developed by Daniel Fernandez (Currency Trader magazine, 2011).
It is based on the two well-known indicators by Dr. Alexander Elder - Bulls Power and Bears Power.
Signals
1) Long when Bull and Total lines indicate 100 (it happens rarely)
2) Short when Bear and Total lines indicate 100 (it happens rarely)
3) Bull and Bear lines crossovers
4) Long when Bull line crosses Total line from below
5) Short when Bear line crosses Total line from below
6) Long/Short when Bull/Bear lines cross adjustable level.
Like and follow for more open source indicators!
Happy Trading!

Klinger Volume OscillatorThis indicator was originally developed by Stephen J. Klinger (Stocks & Commodities, V.15:12 (December, 1997): "Identifying Trends with Volume Analysis").
NOTE : this is the only correct version of Klinger Volume Oscillator in the public library.
Like and follow for more open source indicators!
Happy Trading!


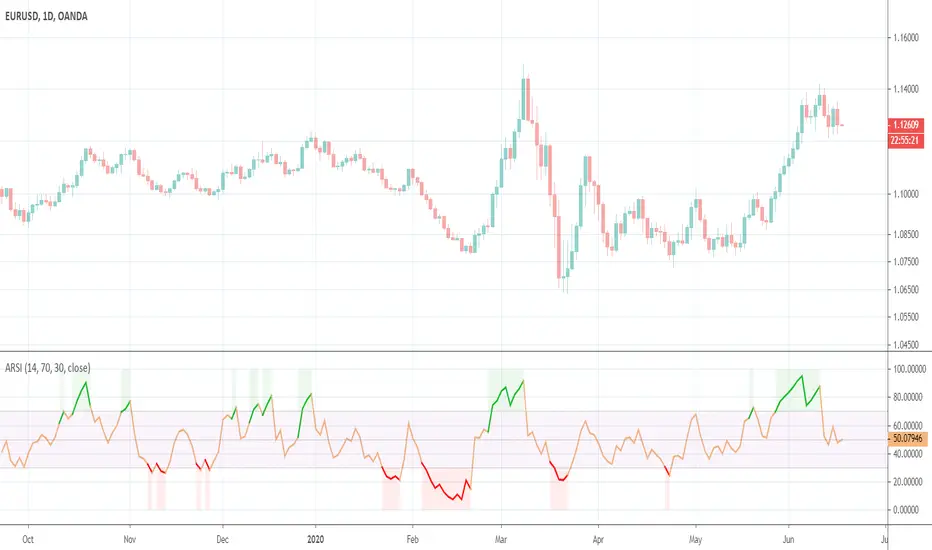
Asymmetrical RSIThis indicator was originally developed by Sylvain Vervoort (Stocks & Commodities, V.26:11 (October, 2008): "ARSI, The Asymmetrical RSI").
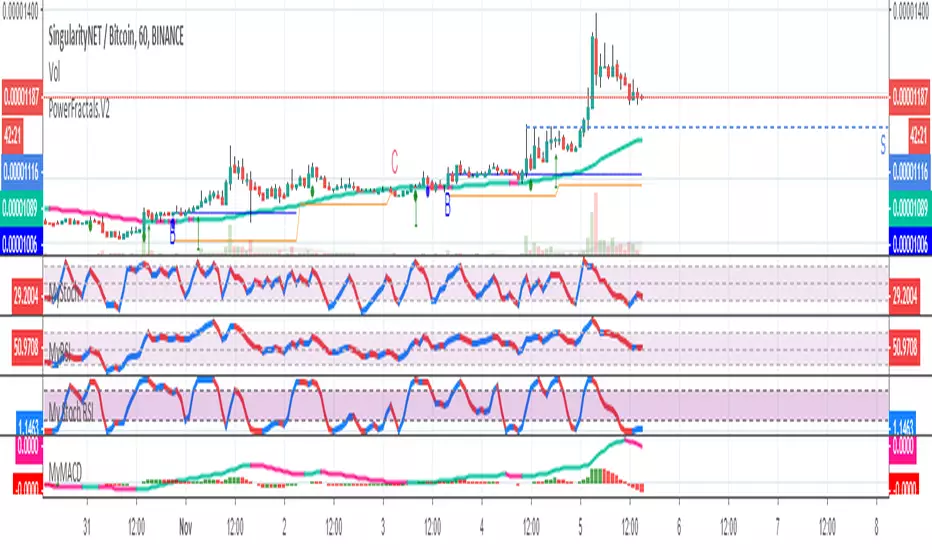
Power FractalsThis script is using fractals and other indicators/formulas to find long entries and exits.
It works best for volatile markets but I found it can work sometimes in ranging markets as well.
Don't take signals against the major trend as it also prints buy entries in bear markets (that are invalidated afterwards)
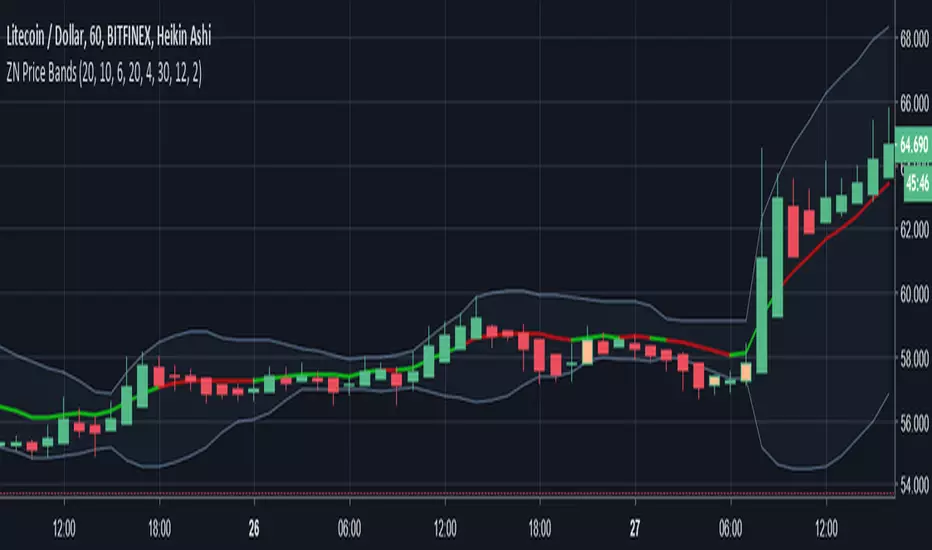
Librehash MV BandThis indicator does not need much of a description, although its utility is very obvious from first glance.
What this indicator is, is essentially a recreation of the Bollinger Bands (w a diff standard deviation calculation for the band formation) that also comes integrated with its own buy and sell signal as well.
This is one of the more valuable indicators out there for any and all traders that are looking to perform a Bollinger's like analysis in a more helpful, compact, and informative manner.
If you are looking to access this indicator, please shoot me a private message on here. This is an invite-only script, so there is a cost associated with the use of this indicator. Price and payment information will be relayed through our chat conversation.
Again, please reach out to me directly through a private message (not via comment to this post) if you have any questions about accessing this indicator.
Thank you.
Trading Energy FractalsThis script uses fractals from 4 different sources to calculate a final fractal sequence. These fractals are then used to find entries and exits.
Fractals are calculated from PRICE, RSI, STOCHASTIC and STOCHASTIC RSI using a consensus algorithm.
At the moment it works only for long entries.
There are also 2 MA. (50 and 15) to help us determine the direction of the trend. Take only the entries in the direction of the trend.

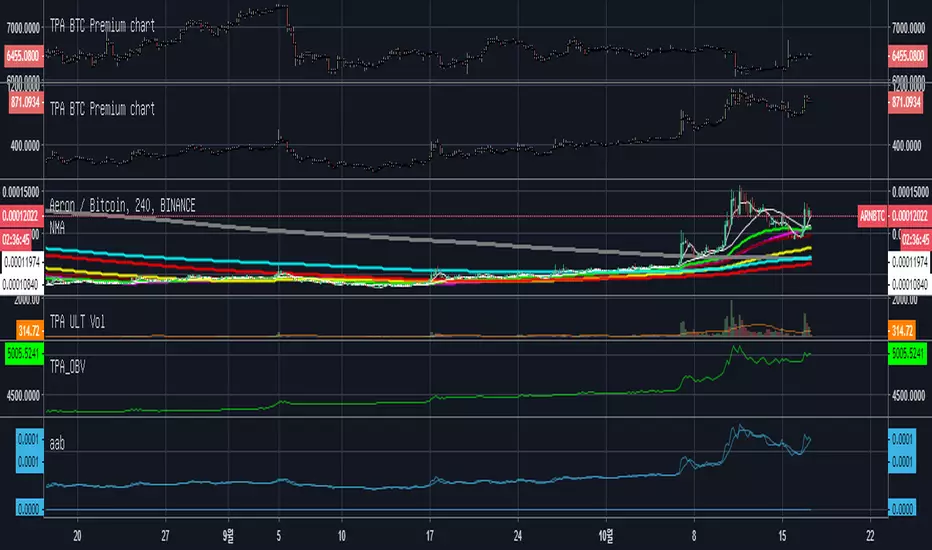
HowManyBitsCostFrom-Binance(1/4)
It is an index that checks how many copies have been made for a particular binary event from a certain date.
Check the "ConsiderCirculationSupply" item to check the purchase price against the market capitalization.
This is an example of ARN revenue forecasts through this indicator.
In the normal bit coin cycle, specify the date based on the finish high.
It is specified by Eliot wave standard 5 wave (high point)
So, when you fall down, you can get the same amount.
A total of four indicators must be combined to see all the Bainance stocks.
A quarter of a million are open for weekly testing.
특정 날짜로부터 바이낸스 종목에 대해 얼마나 매수 일어났는지 체크하는 지표입니다.
"ConsiderCirculationSupply"항목을 체크시 시가총액 대비 매수량을 체크합니다.
이 지표를 통해 ARN수익 예측한 예시입니다.
통상 비트코인 사이클에서 마무리 고점을 기준으로 날짜를 지정하면됩니다.
엘리엇파동 기준 5파에서 지정합니다.(고점)
그럼 하락떄 동일하게 빠지고 바닥권체크후 그때부터 매집된 양을 파악 가능합니다.
총4가지 지표가 합쳐져야 모든 바이낸스 종목을 볼 수 있습니다.
1/4만 일주일간 테스팅용으로 공개합니다.
Israr21 [Reverse Fisher]Hi there! That is my first script, which developed in Amazing Code.
A Green mark gives you opportunity to Buy/Long.Also gives opportunity to sell/short & came with Alerts,which will never miss your Chances. Contact me for More Info.....

Dream Indicator v 1.0UNDER DEVELOPMENT - PRIVATE RELEASE ONLY
Dream Indicator v 1.0
A trend following indicator optimized for use with heikin ashi charts.
Keeps you in a trade, and provides entry/exit points.
Effective across all time frames (higher is better, as with all indicators). MTF capable to provide either long-term trend following (higher time frame), or quicker entry/exit signals (lower time frame).
Requires a trade bias (e.g. divergence, support/resistance, 200 period MA).
This is a private release only, so I can grant access to specific users for feedback. A public release MAY follow in the future. Register your interest in the comments or PM me.

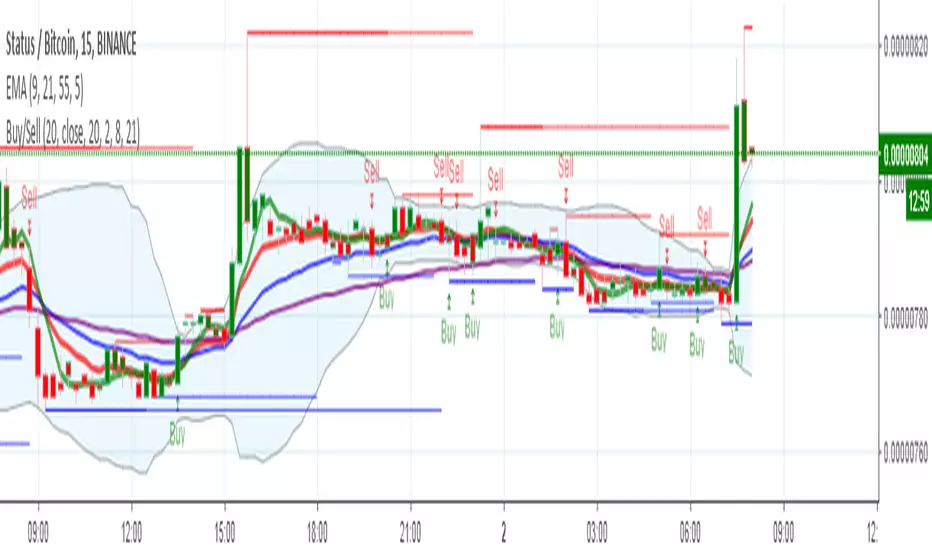
Scrybblez Alerts## Scrybblez Alerts ##
Request access for a trial here or by twitter to @scrybblez
0.What is this Indicator for?
This indicator contains the same code present in Scrybblez Strategy but instead of being a strategy, it is a study. Why is that? Tradingview works in a way that allows Strategies to signal entries and backtest results but does not allow them to send alerts. Studies on the other hand can prompt alerts.
Being able to backtest how well does your Indicator work is very important, but it's useless to have the perfect algorithm and then not being able to act on those signals in time, which is why I wrote this Study.
1.Alerts
Alerts can be set in a few different ways, first let's go through how you can receive them.
- Showing a popup
- Playing a sound
- Sending an email
- Sending an SMS
The first two are useful for when you're in front of the computer or around the house (to avoid being glued to the screen) and the second two for when you're away and want to know of an important event that just occurred.
Since they are quite limited people have come up with ways of making use of these alerts in ingenious ways, one of them for example is to make use of Browser extensions (Autoview, ProfitView,...) to make trades automatically and avoid missing those juicy entries that your indicator just found for you.
2.How to set the alerts?
This study has 9 alerts inside.
_ALERT TEST
The first alert is one I configured so that I can use it to debug if my alerts are prompting, there is nothing more painful than thinking you configured all your alerts correctly, then waiting for an alert to trigger only to see thatthe alert did not work because you misconfigured something or worse, that you prompted that alert once per minute... and you exited several times your current position.
To avoid this, we have this alert, it will ALWAYS trigger, use it to test if your alerts work but DO NOT USE it for anything else.
The remaining 8 alerts' "Message" comes pre-configured (in pairs) with bitmex and bitmex-testnet for ease of use with sample settings for using them with AutoView and Bitmex:
Description of sample settings provided for Autoview
Platform: Bitmex
Bitmex-Testnet Account: bitmex
Bitmex Account: bmex
Leverage: x1
Quantity: 99% of your portfolio
Actual Alerts to be configured
1) LONG
Condition: Scrybblez Alerts and * Open Long * is meant to be linked with both
Alert Condition: LONG and/or TESTNET LONG
2) CLOSE LONG
Condition: Scrybblez Alerts and * Close Long * is meant to be linked with both
Alert Condition: CLOSE LONG and/or TESTNET CLOSE LONG
3) SHORT
Condition: Scrybblez Alerts and * Open Short * is meant to be linked with both
Alert Condition: SHORT and/or TESTNET SHORT
4) CLOSE SHORT
Condition: Scrybblez Alerts and * Close Short * is meant to be linked with both
Alert Condition: CLOSE SHORT and/or TESTNET CLOSE SHORT
After linking the "Condition" with its corresponding "Alert Condition" I advise you to use the option "Once per close bar".
Finally I personally always tick for "Alert actions" both Play sound and Send Email .
If you are happy with using the sample settings provided above, please be aware that Bitmex is a trading platform where you risk being LIQUIDATED and you could potentially lose your entire portfolio. If you are still Ok with it, proceed at your own risk, I myself use either leverage x3 or x4 any higher than that and you're asking to be liquidated with an unexpected 20% spike (and these spikes have happened a few times before) or some heavy manipulation, I advise caution until you know what you are doing.
Also, please note that although I personally use this indicator to trade, the alerts that it provides are by no means to be taken as financial advice from me and you follow them at your own risk, we are all grownups here.
*** Reminder ***
Scrybblez Alerts works with the same code as Scrybblez Strategy , all stated there applies here as well.
How does this strategy work?
This strategy works particularly well with Bitcoin and can be applied to volatile coins with big swings with smaller movements.
It comes preconfigured with settings for 202 minutes.


RSI/MFI - MTF - Entry signals/Trend colored bars - JD@version=2
This indicator is designed to give early entry signals as well as to follow trend moves, according to different settings.
The indicator shows a histogram of the RSI ro MFI in relation to an ema of the RSI or MFI.
The histogram is then smoothed to give early reversal/entry signals.
The actual RSI/MFI line with oversold/overbought indication can be displayed or omitted, as preferred.
in addition to the RSI/MFI line or as an alternative to it, the background colour can be set to change folowing the RSI/MFI signals.
The timeframe can be chosen. Higher timeframes (eg. 3h) tend to give less false signals.
version 5.
added support for custom Multiple Time Frame selection.
added option for choice of RSI or MFI as base indicator.
added option for price bar coloring according to the indicator. (deselecting "borders" in the "style" tab is recommended)
price bar coloring can be adjusted for different strategies:
1. following the slope of the histogram (for faster entry/exit signals)
2. according to positive or negative histogram (for longer moves)
3. according to pos. or neg. RSI/MFI (for longer term trend holds)
4. uptrend: biased towards faster buy signals and slower sell signals to stay in the uptrend
5. downtrend: biased towards faster sell signals and slower buy signals to stay in the downtrend
A longer timeframe (eg. 3x) is recommended for following trend moves.
try different strategies to see what works better for RSI or MFI.
JD.

CryptogramTR with OPEN CODEIndicator is obtained by importing RSI(14) into HULL moving average source with 2 different periods, as one is long period and the other is short.
When green line (short period) cross upward the red line (long period) , this is a BUY; vice versa it is a SELL.
When HMA Short Period is set to 1 (one), yielding line is absolutely the same line of RSI (14). You can change it into 8(eight) preferably.
İndikatör, RSI(14) indikatörünün, hull hareketli ortalamasının kod kaynağı olarak atanması ile elde edilmiştir. Uzun ve kısa olmak üzere 2 ayrı periyot kullanılmıştır.
Yeşil çizgi yani kısa periyotlu çizgi, kırmızı yani uzun periyotlu olanı yukarı keserse AL, tersi durum SAT olarak düşünülmelidir.
Hull Kısa Periyodu 1 iken oluşan yeşil çizgi, RSI(14) indikatörünü vermektedir. Kısa periyot olarak tercihinize göre bu değeri 8 olarak da kullanabilirsiniz.

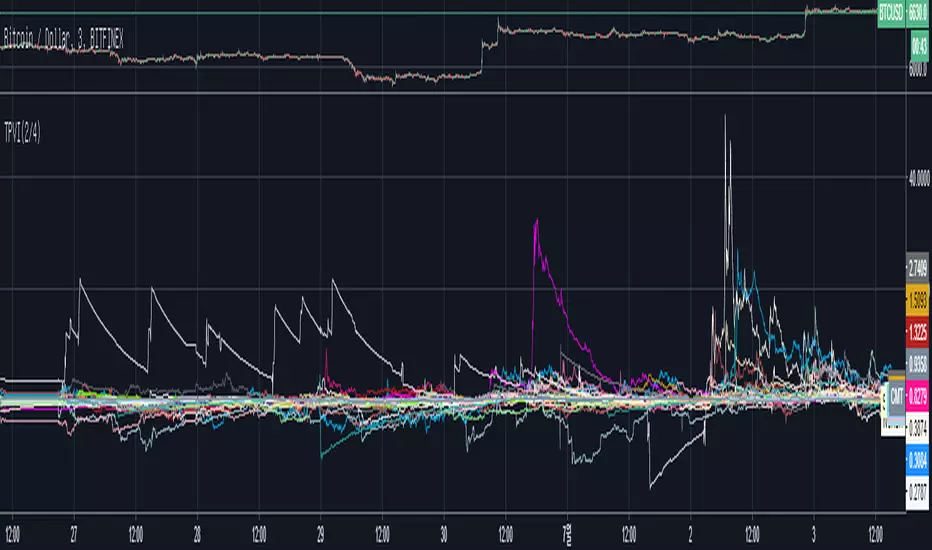
TPA Price&Volume Index(4/4)TPVI is an indicator of price volatility and volume.
The crypto currency is also equipped with variables to set the score depending on whether it is light or heavy.
Supports all of Binance's existing markets (currently 141) (excluding arn, to be supported later)
The setting is based on current sensitivity of 995 and high, low, close average reflectance.
It is recommended to change to 993 for skelper who usually take it shortly then 998 is recommended for those who are swinging.
The lower the sensitivity, the more sensitive the price is.
There is also an sma check box and a len box.
This is a device to view moving averages when the score is too large and difficult to check properly, and averages the index score by the length of len.
By default, the 3min chart is used to catch up quickly, but it is also good for viewing long trends. However, you will need to reset the sensitivity for the chart at that time.
The usage is the same as above, and I am using this index to generate a lot of profit. Please invest all successful investments.
기본적으로 텔레방통한 알람 사용시 3분봉에 맞춰서 지표 쓰시면 됩니다.
TPVI (TPA Price&Volume Index)
(1/4)
(2/4)
(3/4)
(4/4)
TPVI ALERT
(1/4)
(2/4)
(3/4)
(4/4)
TPVI,가격변동과 볼륨을 함께 담은 지표입니다.
또한 해당 crypto 화폐가 가볍냐 무겁냐에 따라 점수를 책정하기 위한 변수도 탑재하고있습니다.
Binance의 전 시장(현재 141개)에 대해 지원합니다.(arn제외,추후지원예정)
세팅은 현재 민감도 995이고 high,low,close평균 반영을 기준으로 이뤄집니다.
통상 그때그때 짧게 가져가시는 스켈퍼 분들은 993으로 변경하시길 추천드리고 998은 스윙하시는 분들에게 추천드립니다.
민감도는 낮은 값을 가질수록 가격에 민감하게 반응합니다.
또한 sma체크란과 len 란이 있습니다.
이는 점수의 고저폭이 커 제대로 확인하기 힘들때 이동평균화 하여 보기 위한 장치로서 해당 지표점수를 len의 길이만큼 평균냅니다.
기본적으로 3min 차트를 사용하면 빠르게 상승을 잡아내기 위해 사용하지만, 긴 추세를 보는데도 좋습니다. 단, 해당시간의 차트에 대해 민감도를 재설정해야합니다.
사용법은 위와 같고 현재 필자도 이 지표를 이용해 많은 수익을 창출하고있습니다. 모두 성공투자하시기 바랍니다.

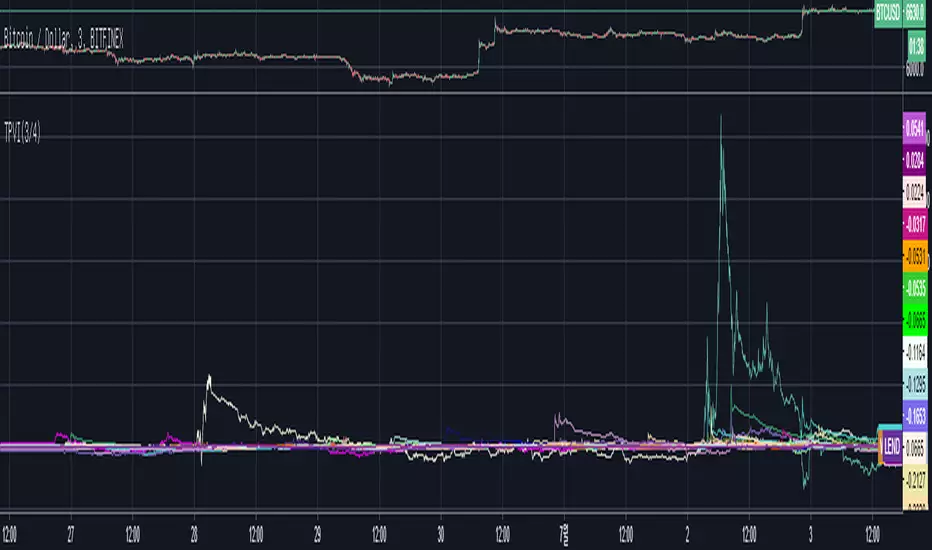
TPA Price&Volume Index(3/4)TPVI is an indicator of price volatility and volume.
The crypto currency is also equipped with variables to set the score depending on whether it is light or heavy.
Supports all of Binance's existing markets (currently 141) (excluding arn, to be supported later)
The setting is based on current sensitivity of 995 and high, low, close average reflectance.
It is recommended to change to 993 for skelper who usually take it shortly then 998 is recommended for those who are swinging.
The lower the sensitivity, the more sensitive the price is.
There is also an sma check box and a len box.
This is a device to view moving averages when the score is too large and difficult to check properly, and averages the index score by the length of len.
By default, the 3min chart is used to catch up quickly, but it is also good for viewing long trends. However, you will need to reset the sensitivity for the chart at that time.
The usage is the same as above, and I am using this index to generate a lot of profit. Please invest all successful investments.
기본적으로 텔레방통한 알람 사용시 3분봉에 맞춰서 지표 쓰시면 됩니다.
TPVI (TPA Price&Volume Index)
(1/4)
(2/4)
(3/4)
(4/4)
TPVI ALERT
(1/4)
(2/4)
(3/4)
(4/4)
TPVI,가격변동과 볼륨을 함께 담은 지표입니다.
또한 해당 crypto 화폐가 가볍냐 무겁냐에 따라 점수를 책정하기 위한 변수도 탑재하고있습니다.
Binance의 전 시장(현재 141개)에 대해 지원합니다.(arn제외,추후지원예정)
세팅은 현재 민감도 995이고 high,low,close평균 반영을 기준으로 이뤄집니다.
통상 그때그때 짧게 가져가시는 스켈퍼 분들은 993으로 변경하시길 추천드리고 998은 스윙하시는 분들에게 추천드립니다.
민감도는 낮은 값을 가질수록 가격에 민감하게 반응합니다.
또한 sma체크란과 len 란이 있습니다.
이는 점수의 고저폭이 커 제대로 확인하기 힘들때 이동평균화 하여 보기 위한 장치로서 해당 지표점수를 len의 길이만큼 평균냅니다.
기본적으로 3min 차트를 사용하면 빠르게 상승을 잡아내기 위해 사용하지만, 긴 추세를 보는데도 좋습니다. 단, 해당시간의 차트에 대해 민감도를 재설정해야합니다.
사용법은 위와 같고 현재 필자도 이 지표를 이용해 많은 수익을 창출하고있습니다. 모두 성공투자하시기 바랍니다.
TPA Price&Volume Index 2TPVI is an indicator of price volatility and volume .
The crypto currency is also equipped with variables to set the score depending on whether it is light or heavy.
Supports all of Binance's existing markets (currently 141) (excluding arn -0.65% , to be supported later)
The setting is based on current sensitivity of 995 and high, low, close average reflectance.
It is recommended to change to 993 for skelper who usually take it shortly then 998 is recommended for those who are swinging.
The lower the sensitivity, the more sensitive the price is.
There is also an sma check box and a len 0.52% box.
This is a device to view moving averages when the score is too large and difficult to check properly, and averages the index score by the length of len 0.52% .
By default, the 3min chart is used to catch up quickly, but it is also good for viewing long trends. However, you will need to reset the sensitivity for the chart at that time.
The usage is the same as above, and I am using this index to generate a lot of profit. Please invest all successful investments.
기본적으로 텔레방통한 알람 사용시 3분봉에 맞춰서 지표 쓰시면 됩니다.
TPVI (TPA Price&Volume Index)
(1/4)
(2/4)
(3/4)
(4/4)
TPVI ALERT
(1/4)
TPVI alert(1/4)
(2/4)
TPVI alert(2/4)
(3/4)
TPVI alert(3/4)
(4/4)
TPVI alert(4/4)
TPVI,가격변동과 볼륨을 함께 담은 지표입니다.
또한 해당 crypto 화폐가 가볍냐 무겁냐에 따라 점수를 책정하기 위한 변수도 탑재하고있습니다.
Binance의 전 시장(현재 141개)에 대해 지원합니다.(arn제외,추후지원예정)
세팅은 현재 민감도 995이고 high,low,close평균 반영을 기준으로 이뤄집니다.
통상 그때그때 짧게 가져가시는 스켈퍼 분들은 993으로 변경하시길 추천드리고 998은 스윙하시는 분들에게 추천드립니다.
민감도는 낮은 값을 가질수록 가격에 민감하게 반응합니다.
또한 sma체크란과 len 0.52% 란이 있습니다.
이는 점수의 고저폭이 커 제대로 확인하기 힘들때 이동평균화 하여 보기 위한 장치로서 해당 지표점수를 len의 길이만큼 평균냅니다.
기본적으로 3min 차트를 사용하면 빠르게 상승을 잡아내기 위해 사용하지만, 긴 추세를 보는데도 좋습니다. 단, 해당시간의 차트에 대해 민감도를 재설정해야합니다.
사용법은 위와 같고 현재 필자도 이 지표를 이용해 많은 수익을 창출하고있습니다. 모두 성공투자하시기 바랍니다.