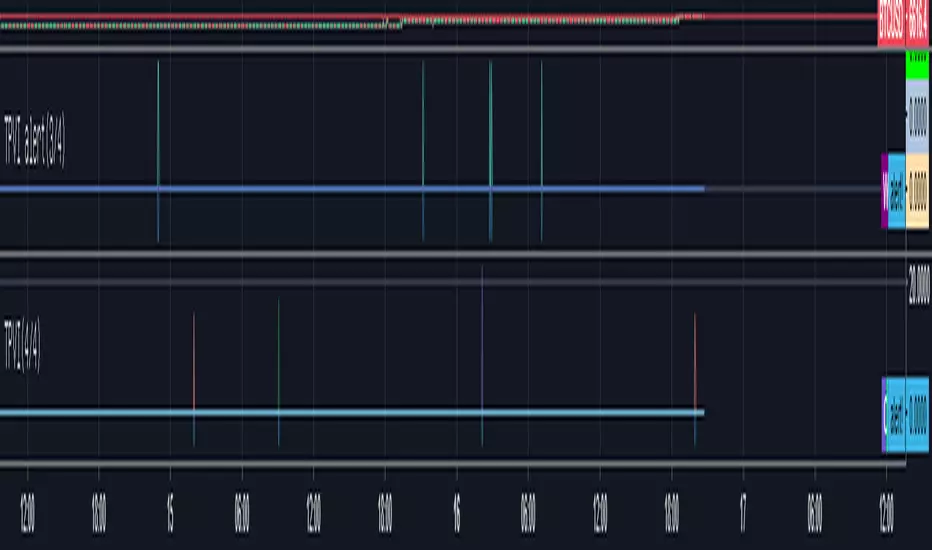
TPVI alert(3/4)a Indicators for using alarms.
It captures a strong buying moment or momentary strong buying.
Basically, it is made for the purpose of catching and trading when the TPVI index is bouncing.
How to use is as follows.
Once you have registered TPVI 1,2,3,4 and TPVI ALERT 1,2,3,4.
The reason why there are four versions is because it exceeds the maximum number of items of BINANCE company (142) due to limit of the data which can be included in the Hanji table.
If you can use your computer on a regular basis, you can use TPVI to trade it. If you are outside or doing something else, you can use a telegram alarm or use your own alarm to refer to the traide.
1. For telegram users
In the telegram room, when the alarm of (1/4), (2/4), (3/4), (4/4) is detected, the TPVI ALERT indicator will bring up the window with four indicators on. And check the window where the alarm came out from 1/4 ~ 4/4. There will be a coin with a non-zero indicator value. Right-click on the right scale and select "Indicator Name" and "No Overlapping Label".You'll see the name of the indicator on the right, but find the name of the indicator other than the one on page 0.
The values of indicators are not important. Each value corresponds to an alarm on alarm off, and off equals 0 on the corresponding indicator.The reason why each value is different is that if all coins are the same, it becomes impossible to visually check them on the surface.Find the name of the relevant indicator on the TPVI and bet if it is rising.
2. When using Indicators through personal alarms
In this case, add an alarm -> select TPVI ALERT -> alert! Select value -> less than -2
This allows you to set the desired alarm if a specific value has sprung from the corresponding indicator of 1, 2, 3, or 4 (configurable).
Cumulative profits are enormous thanks to coin counterparts. Please enjoy your profits as well. Thank you.
TPVI지표의 알람사용을 원할시 필요한 지표입니다.
매집 또는 순간적인 강한 매수증가를 잡아냅니다.
기본적으로 TPVI 지표가 튀어오를떄 잡아내 매매를 하기 위한 목적으로 만들어졌습니다.
사용방법은 다음과 같습니다.
일단 TPVI 1,2,3,4와 TPVI ALERT 1,2,3,4를 등록해둡니다.
4가지 버전이 있는 이유는 한지표에 담을수 있는 데이터의 한계 때문에 BINANCE회사의 최대 종목갯수(142)를 초과하기때문입니다.
평상시 컴퓨터가 가능할때는 TPVI를 참고하여 매매를 하시면 되고, 밖에있거나 다른 일을 하고 있을때 텔레그램 알람을 이용하거나 본인이 직접 알람을 걸어 매매에 참고하시면 됩니다.
1. 텔레그램 이용유저의 경우
텔레그램 방에 (1/4),(2/4),(3/4),(4/4) 에서 매집감지 라는 알람이 오면 TPVI ALERT 지표 네가지가 켜져있는 창을 킵니다. 그리고 1/4 ~ 4/4 중 알람이 왔던 창을 확인합니다. 지표의 값이 0이 아닌 코인이 있을겁니다. 사용시 우측 눈금을 우클릭하시고 "지표이름" 은 키시고 "오버래핑 라벨 없음"은 끄시기 바랍니다.
그럼 오른쪽에 지표의 이름이 나올텐데 0쪽에 곂친 지표 말고 다른 지표의 이름을 찾으십시오.
지표들의 값은 중요하지 않습니다. 각각의 값은 알람 on 알람 off에 해당하고 off는 0 on은 해당 지표의 값 입니다.각각의 값이 다른 이유는 해당하는 코인이 모두 같은 값이면 지표상 곂쳐서 시각적으로 확인이 불가능 해 지기 때문입니다.
해당하는 지표의 이름를 TPVI에서 찾고 상승세라면 배팅하십시오.
2. 개인적인 알람을 통해 지표를 사용하는 경우
이 경우 알람추가 -> TPVI ALERT 선택 -> alert! 값 선택 -> -2 보다 작을 경우 선택
이렇게 하면 1, 2, 3, 4 중 해당하는 지표에서 특정 값이 튄 경우(설정가능) 원하는 알람을 걸 수 있습니다.
코인 반등장에 힘입어 누적수익이 어마어마합니다. 여러분들도 수익 즐기시기바랍니다. 감사합니다.
Buysignal
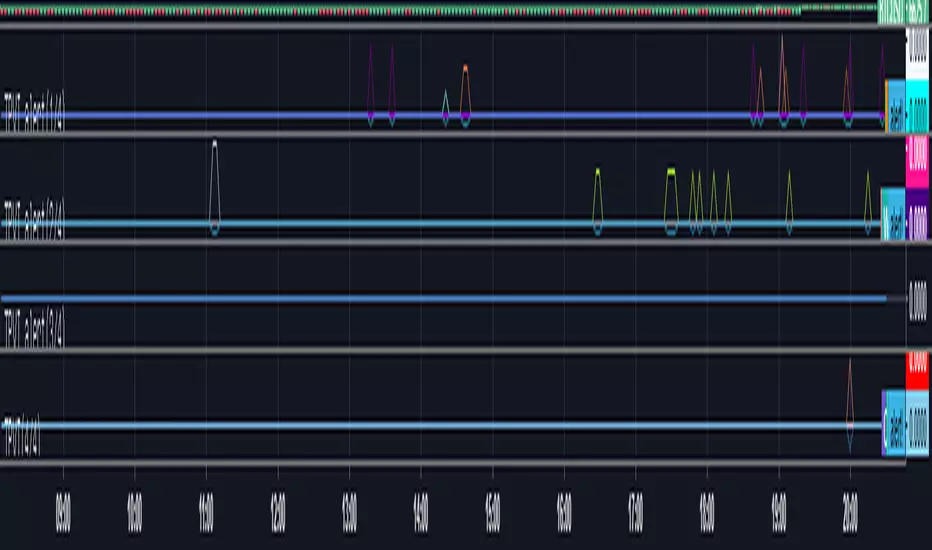
TPVI alert(2/4)a Indicators for using alarms.
It captures a strong buying moment or momentary strong buying.
Basically, it is made for the purpose of catching and trading when the TPVI index is bouncing.
How to use is as follows.
Once you have registered TPVI 1,2,3,4 and TPVI ALERT 1,2,3,4.
The reason why there are four versions is because it exceeds the maximum number of items of BINANCE company (142) due to limit of the data which can be included in the Hanji table.
If you can use your computer on a regular basis, you can use TPVI to trade it. If you are outside or doing something else, you can use a telegram alarm or use your own alarm to refer to the traide.
1. For telegram users
In the telegram room, when the alarm of (1/4), (2/4), (3/4), (4/4) is detected, the TPVI ALERT indicator will bring up the window with four indicators on. And check the window where the alarm came out from 1/4 ~ 4/4. There will be a coin with a non-zero indicator value. Right-click on the right scale and select "Indicator Name" and "No Overlapping Label".You'll see the name of the indicator on the right, but find the name of the indicator other than the one on page 0.
The values of indicators are not important. Each value corresponds to an alarm on alarm off, and off equals 0 on the corresponding indicator.The reason why each value is different is that if all coins are the same, it becomes impossible to visually check them on the surface.Find the name of the relevant indicator on the TPVI and bet if it is rising.
2. When using Indicators through personal alarms
In this case, add an alarm -> select TPVI ALERT -> alert! Select value -> less than -2
This allows you to set the desired alarm if a specific value has sprung from the corresponding indicator of 1, 2, 3, or 4 (configurable).
Cumulative profits are enormous thanks to coin counterparts. Please enjoy your profits as well. Thank you.
TPVI지표의 알람사용을 원할시 필요한 지표입니다.
매집 또는 순간적인 강한 매수증가를 잡아냅니다.
기본적으로 TPVI 지표가 튀어오를떄 잡아내 매매를 하기 위한 목적으로 만들어졌습니다.
사용방법은 다음과 같습니다.
일단 TPVI 1,2,3,4와 TPVI ALERT 1,2,3,4를 등록해둡니다.
4가지 버전이 있는 이유는 한지표에 담을수 있는 데이터의 한계 때문에 BINANCE회사의 최대 종목갯수(142)를 초과하기때문입니다.
평상시 컴퓨터가 가능할때는 TPVI를 참고하여 매매를 하시면 되고, 밖에있거나 다른 일을 하고 있을때 텔레그램 알람을 이용하거나 본인이 직접 알람을 걸어 매매에 참고하시면 됩니다.
1. 텔레그램 이용유저의 경우
텔레그램 방에 (1/4),(2/4),(3/4),(4/4) 에서 매집감지 라는 알람이 오면 TPVI ALERT 지표 네가지가 켜져있는 창을 킵니다. 그리고 1/4 ~ 4/4 중 알람이 왔던 창을 확인합니다. 지표의 값이 0이 아닌 코인이 있을겁니다. 사용시 우측 눈금을 우클릭하시고 "지표이름" 은 키시고 "오버래핑 라벨 없음"은 끄시기 바랍니다.
그럼 오른쪽에 지표의 이름이 나올텐데 0쪽에 곂친 지표 말고 다른 지표의 이름을 찾으십시오.
지표들의 값은 중요하지 않습니다. 각각의 값은 알람 on 알람 off에 해당하고 off는 0 on은 해당 지표의 값 입니다.각각의 값이 다른 이유는 해당하는 코인이 모두 같은 값이면 지표상 곂쳐서 시각적으로 확인이 불가능 해 지기 때문입니다.
해당하는 지표의 이름를 TPVI에서 찾고 상승세라면 배팅하십시오.
2. 개인적인 알람을 통해 지표를 사용하는 경우
이 경우 알람추가 -> TPVI ALERT 선택 -> alert! 값 선택 -> -2 보다 작을 경우 선택
이렇게 하면 1, 2, 3, 4 중 해당하는 지표에서 특정 값이 튄 경우(설정가능) 원하는 알람을 걸 수 있습니다.
코인 반등장에 힘입어 누적수익이 어마어마합니다. 여러분들도 수익 즐기시기바랍니다. 감사합니다.

TPVI alert(1/4)a Indicators for using alarms.
It captures a strong buying moment or momentary strong buying.
Basically, it is made for the purpose of catching and trading when the TPVI index is bouncing.
How to use is as follows.
Once you have registered TPVI 1,2,3,4 and TPVI ALERT 1,2,3,4.
The reason why there are four versions is because it exceeds the maximum number of items of BINANCE company (142) due to limit of the data which can be included in the Hanji table.
If you can use your computer on a regular basis, you can use TPVI to trade it. If you are outside or doing something else, you can use a telegram alarm or use your own alarm to refer to the traide.
1. For telegram users
In the telegram room, when the alarm of (1/4), (2/4), (3/4), (4/4) is detected, the TPVI ALERT indicator will bring up the window with four indicators on. And check the window where the alarm came out from 1/4 ~ 4/4. There will be a coin with a non-zero indicator value. Right-click on the right scale and select "Indicator Name" and "No Overlapping Label".You'll see the name of the indicator on the right, but find the name of the indicator other than the one on page 0.
The values of indicators are not important. Each value corresponds to an alarm on alarm off, and off equals 0 on the corresponding indicator.The reason why each value is different is that if all coins are the same, it becomes impossible to visually check them on the surface.Find the name of the relevant indicator on the TPVI and bet if it is rising.
2. When using Indicators through personal alarms
In this case, add an alarm -> select TPVI ALERT -> alert! Select value -> less than -2
This allows you to set the desired alarm if a specific value has sprung from the corresponding indicator of 1, 2, 3, or 4 (configurable).
Cumulative profits are enormous thanks to coin counterparts. Please enjoy your profits as well. Thank you.
TPVI지표의 알람사용을 원할시 필요한 지표입니다.
매집 또는 순간적인 강한 매수증가를 잡아냅니다.
기본적으로 TPVI 지표가 튀어오를떄 잡아내 매매를 하기 위한 목적으로 만들어졌습니다.
사용방법은 다음과 같습니다.
일단 TPVI 1,2,3,4와 TPVI ALERT 1,2,3,4를 등록해둡니다.
4가지 버전이 있는 이유는 한지표에 담을수 있는 데이터의 한계 때문에 BINANCE회사의 최대 종목갯수(142)를 초과하기때문입니다.
평상시 컴퓨터가 가능할때는 TPVI를 참고하여 매매를 하시면 되고, 밖에있거나 다른 일을 하고 있을때 텔레그램 알람을 이용하거나 본인이 직접 알람을 걸어 매매에 참고하시면 됩니다.
1. 텔레그램 이용유저의 경우
텔레그램 방에 (1/4),(2/4),(3/4),(4/4) 에서 매집감지 라는 알람이 오면 TPVI ALERT 지표 네가지가 켜져있는 창을 킵니다. 그리고 1/4 ~ 4/4 중 알람이 왔던 창을 확인합니다. 지표의 값이 0이 아닌 코인이 있을겁니다. 사용시 우측 눈금을 우클릭하시고 "지표이름" 은 키시고 "오버래핑 라벨 없음"은 끄시기 바랍니다.
그럼 오른쪽에 지표의 이름이 나올텐데 0쪽에 곂친 지표 말고 다른 지표의 이름을 찾으십시오.
지표들의 값은 중요하지 않습니다. 각각의 값은 알람 on 알람 off에 해당하고 off는 0 on은 해당 지표의 값 입니다.각각의 값이 다른 이유는 해당하는 코인이 모두 같은 값이면 지표상 곂쳐서 시각적으로 확인이 불가능 해 지기 때문입니다.
해당하는 지표의 이름를 TPVI에서 찾고 상승세라면 배팅하십시오.
2. 개인적인 알람을 통해 지표를 사용하는 경우
이 경우 알람추가 -> TPVI ALERT 선택 -> alert! 값 선택 -> -2 보다 작을 경우 선택
이렇게 하면 1, 2, 3, 4 중 해당하는 지표에서 특정 값이 튄 경우(설정가능) 원하는 알람을 걸 수 있습니다.
코인 반등장에 힘입어 누적수익이 어마어마합니다. 여러분들도 수익 즐기시기바랍니다. 감사합니다.
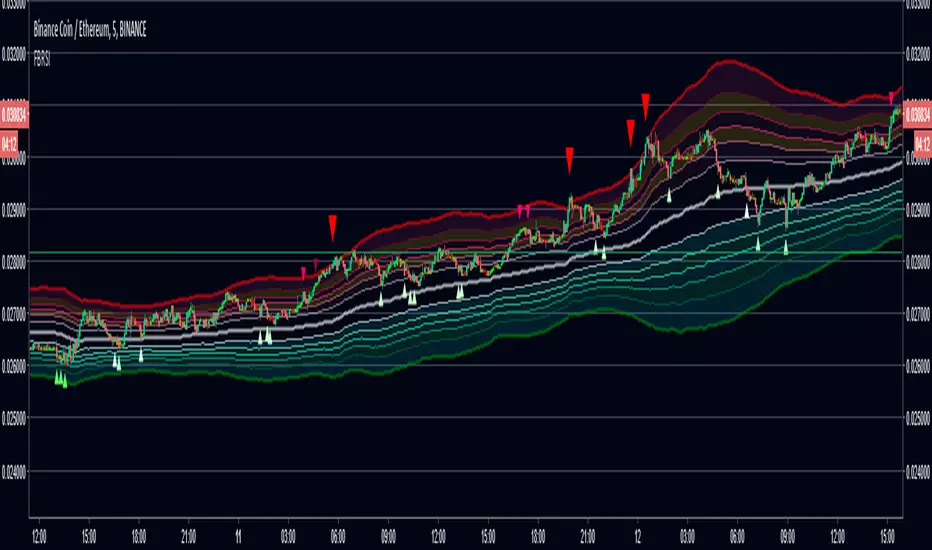
FIB Band Signals with RSI FilterOriginal Author: Rashad
Added by Rashad 6-26-16
These Bollinger bands feature Fibonacci retracements to very clearly show areas of support and resistance . The basis is calculate off of the Volume Weighted Moving Average . The Bands are 3 standard deviations away from the mean. 99.73% of observations should be in this range.
Updated by Dysrupt 7-12-18
-Buy signals added on lower bands, mean and upper 3 bands
-Sell signals added to upper 3 bands
-RSI filter applied to signals
-Alerts not yet added
-Long Biased
NOTE: This is NOT a set and forget signal indicator. It is extremely versatile for all environments by adjusting the RSI filter and checking the band signals needed for the current trend and trading style.
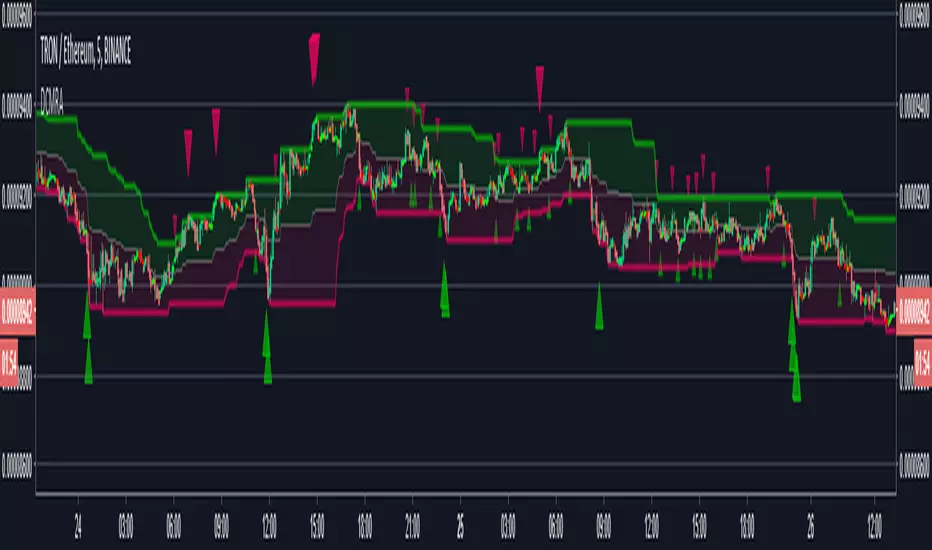
Donchian Mean Reversion AlertsDonchian Channels mean reversion signals/alerts with RSI filtering with signals applied to the mean, for strong trend situations.
Original Author: ChrisMoody
Modified Donchonian Channel with separate adjustments for upper and lower levels
Purpose is if you expect big move up, Use lower input example 3 or 4, and longer lower input, 40 - 100 and use lower input line as a stop out
Opposite if you expect big move down
Mid Line Rule in Long Example. If lower line is below entry take partial profits at Mid Line and move stop to Break even.
If Lower line moves above entry price before price retraces to midline use Lower line as Stop...Opposite if Shorting
Created by user ChrisMoody 1-30-2014
Updated 7-11-2018 by Dysrupt
Revamped for mean reversion strategy
Created midline alerts for strong trending upside buy signals/downside sell signals.
Added RSI Filtering
Added Alerts
Removed bar color change
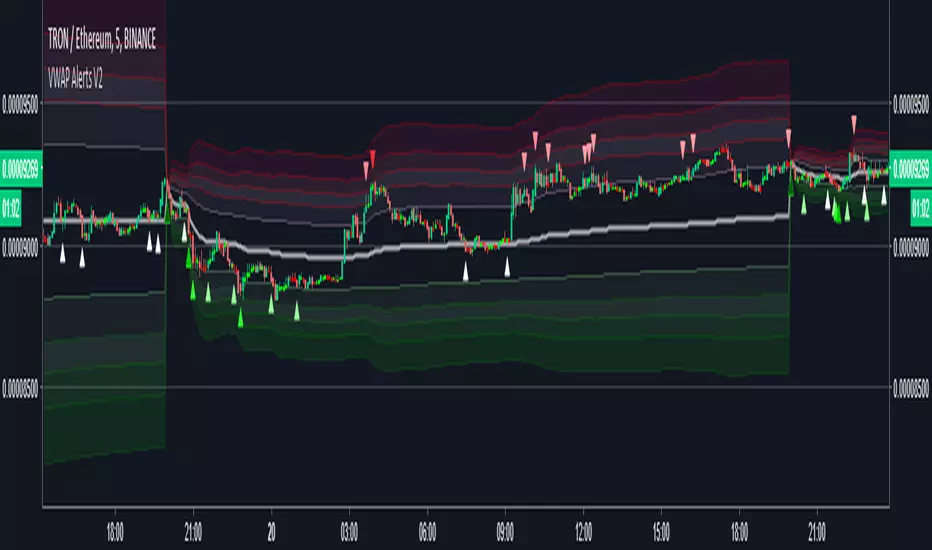
VWAP Alerts V2Alerts added to "VWAP Stdev Bands v2" by SandroTurriate
Changes
-Adjusted trigger conditions for higher signal sensitivity
-Color change on bands and signals for better readability and ease on the eyes
-Alerts added for up to 4 deviations up and down
-Re-enabled deviations 4 and 5
-Re-enabled previous close
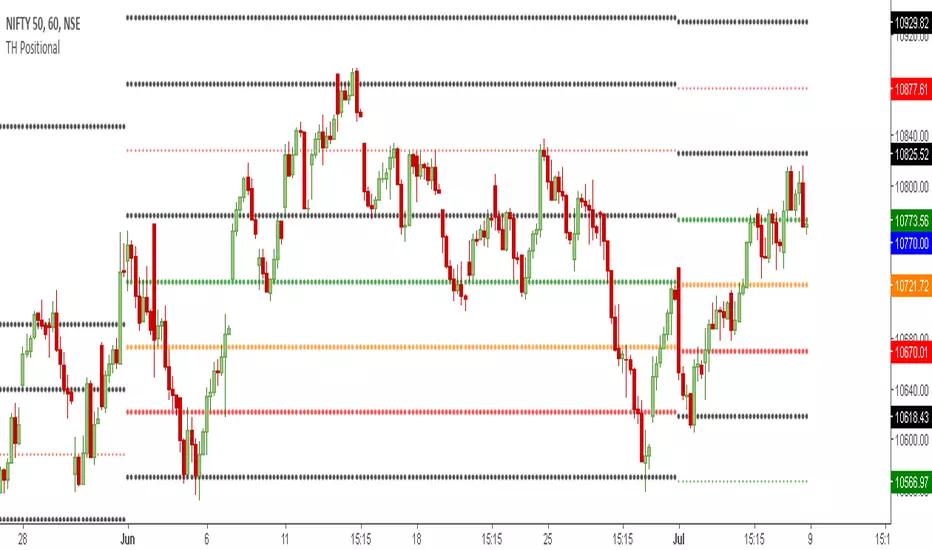
TH Positional | Buy & Sell Levels Monthly ViewTradersHunt's Positional Indicator is designed for Intraday or Monthly Positional Trading for Indian Market but it can also be used for Global Markets and Commodities . It is based on Support & Resistance Levels as per Historical Data.
The details are as follows;
Orange line is Trendsetter which means price closing above or below it will take the instrument in that direction. Green Level indicates strong buy price, and Orange level can be used as SL if trader is taking long position. Basically, a trader can use these levels as best Support and Resistance levels based on the ORB selected.
visit our website www.tradershunt.com for more information.
TH Trend | Trend Levels for the WeekTradersHunt's Trend Indicator is designed for Intraday or Weekly Positional Trading for Indian Market but it can also be used for Global Markets and Commodities . It is based on Support & Resistance Levels as per Historical Data.
The details are as follows;
Orange line is Trendsetter which means price closing above or below it will take the instrument in that direction. Green Level indicates strong buy price, and Orange level can be used as SL if trader is taking long position. Basically, a trader can use these levels as best Support and Resistance levels based on the ORB selected.
visit our website www.tradershunt.com for more information.

TH ORB | Buy & Sell Levels Based on ORBTradersHunt's ORB Indicator is designed for Intraday Trading for Indian Market but it can also be used for Global Markets and Commodities . It is based on Support & Resistance Levels based on Opening Range Technique. User can select different ORB ranges like 1min, 10min, 15/30/45min, 1/2/3 HOUR etc.
The details are as follows;
Orange line is Trendsetter which means price closing above or below it will take the instrument in that direction. Green Level indicates strong buy price, and Orange level can be used as SL if trader is taking long position. Basically, a trader can use these levels as best Support and Resistance levels based on the ORB selected.
visit our website www.tradershunt.com for more information.

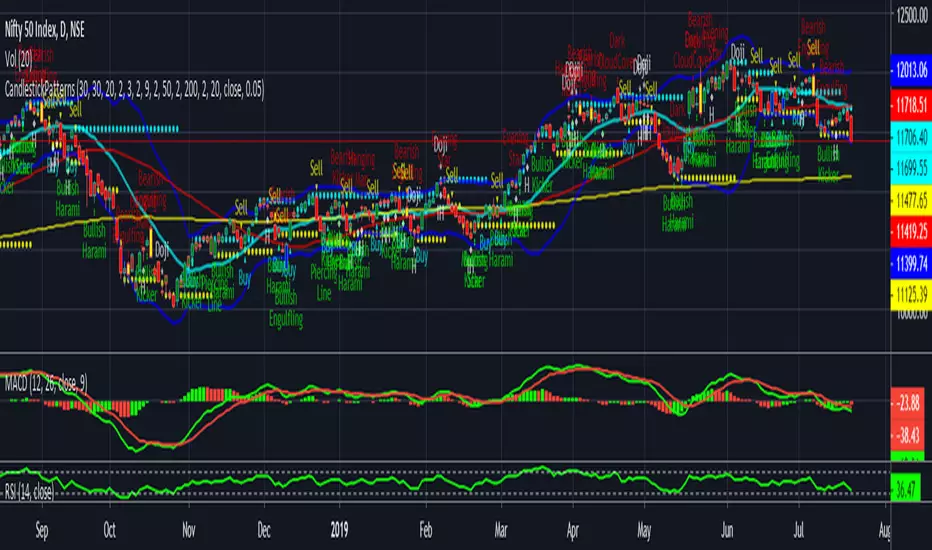
CandlestickPatternsIf moving average SMA (green line) crosses above SMA (red line) is uptrend , stock price will move up gradually. If suppose moving average SMA (green line) crosses below SMA (red line) is downtrend, stock price will move down. Also please validate with MACD & RSI for reference will get more clarification.
The default script have:
1) Bollinger Bands
2) Moving Average
3) Buy & Sell Signals
4) Engulfing patterns (like Doji , Bearish Harami, Bullish Harami, Bearish Engulfing , Bullish Engulfing , Piercing Line, Bullish Belt, Bullish Kicker, and Bearish Kicker)
The Piercing Line, Bullish Belt, and the Kickers will usually show up better in the daily charts.
Cryptosniper2ENGLISH:
Cryptosniper2
It is a creator indicator of Cryptofxsignals - Product of Paybit S.A.S
Which has an opportunity to buy or sell in multiple markets used for the market of cryptocurrencies.
This indicator has combined buy / sell signals of support and resistance
Characteristics of the indicator
Crosses of Moving Averages - Cryptofxma - Mobile media crossing 20,50,100,200
Measure price histories to automatically calculate supports and resistances, calculating the highs and porces, weeks and monthly
Calculate the RSI levels
Calculate Macd crosses
If the price candle breaks the support or resistance to the upside and all the conditions a purchase signal is marked
If the price candle breaks the resistance or support to the downside and all the conditions a sale signal is marked
Español:
Cryptosniper2
Es un indicador creador de Cryptofxsignals - Producto de Paybit S.A.S
El cual tiene una oportunidad de comprar o vender en multiples mercados usados para el mercado de las criptomonedas.
Este indicador tiene señales de compra / venta combinadas de soporte y resistencia
Caracteristicas del indicador
Cruces de Medias Móviles - Cryptofxma - Cruce de medios moviles 20,50,100,200
Mide historicos de precios para calcular automaticamente soportes y resistencias, calculando los altos y porcias, semanas y mensuales
Calcula los niveles RSI
Calcula cruces de Macd
Si la vela de precio rompe el soporte o resistencia a la alza y todas las condiciones se marca una señal de compra
Si la vela de precio rompe la resistencia o soporte a la baja y todas las condiciones se marca una señal de venta

Moving Averages DifferenceSimple indicator for crossing moving averages to identify trend and adjust bias

TPA BTC INDEX COLOR only for BTC/Legal currency, 4H(240min)TPA BTC INDEX COLOR only for BTC/Legal currency, 4H(240min)
또땃 비트 인덱스컬러 (BTCUSD나 KRW용)
Because we use Google Translator, translation may not be smooth.
------------------------------------------------
1.단기존 (Short term zone)
라임색에 줍고 주황~빨간색에 턴다.
빨강->라임 또는 라임->빨강 손에서는 주의한다.
알트존이 초록불일때는 단기존이 초록일때 줍지만 알트존이 붉은색으로 변하면 빨리 털거나 단기존이 주황~빨강쯤 왔을때 턴다
Pick it up in lime and sell it in orange to red.
Be careful in the red - > lime or lime - > red section.
When alt zone is a green light, pick it up when it is green. When Alt Zone turns red, it sells quickly or when it comes to orange or red.
------------------------------------------------
2.알트존 (Alt zone)
알트코인 투자시 급락 가능성이 적고 상방추세를 탔을때 투자를하기 위해서는 알트존이 초록불일때 투자를 하면 된다.
There is little possibility of a sharp drop in investment when investing in alt coins, and investment can be made when Alt Zone is green.
------------------------------------------------
3.계절 존(Season zone)
계절존이 초록색(여름)이면 향후 상방을 향해 갈 확률이 높은 상황이다.
적색이면 하락할 확률이 전체적으로 높다.방어적 투자할것
If the zone is green (summer), chances are high that it will move upward.
There is a high overall probability of falling in red.We need defensive investment.
------------------------------------------------
4.광기장 고점파악용(Madness zone)
광기장 판단은 장기존이 붉은색인체로 지속될때 광기장으로 명한다. 해당 구간은 급격한상승 하락이 있으므로(퍼센티지상)
4번라인의 색이 붉게 되면 매도한다. 옅은 주황이나 연두에 줍고 해당라인이 붉게된 근처에서 설거지 파동에 매도를 하면 된다.
The decision to determine whether " Madness Zone " is to be made by longtermzone as the continuation of red. Because of the sharp decline in the corresponding section, sell the fourth line when it turns red. You can pick it up in light orange or green tea and sell it on last waves near the line.
------------------------------------------------
5.장기존(long term zone)
저점매수하기 좋은 라인은 초록색으로 매도가 인접하면 붉은색으로 표기된다.
A good line to buy a low point is green, and if a sell is adjacent, it is marked red.
------------------------------------------------
Only for BTC/ Chart(4h, 240min)
알트존,계절존 모두 녹색인 구간에서 투자하는게 가장 안전하다.
계절존이 붉은데 알트존이 초록이라면 보험용 금액을 만들어라.
계절존이 초록인데 알트존이 붉은 색 이라면 단기존이 초록일때 주워라.
It is safest to invest in green zone, alt zone and season zone.
If the season zone is red and the alt zone is green, make an insurance premium.
If the season zone is green and the alt zone is red, pick it up when the original is green.
------------------------------------------------
업그레이드 예정:
색 변경시 알람 컨디션.
알트코인 차트를 켜도 TPA BTC INDEX COLOR 를 사용할수 있게 하는 기능.
Upcoming upgrade:
Alarm condition when color change.
Ability to use TPA BTC INDEX COLOR even when turning on an Altcoin chart.

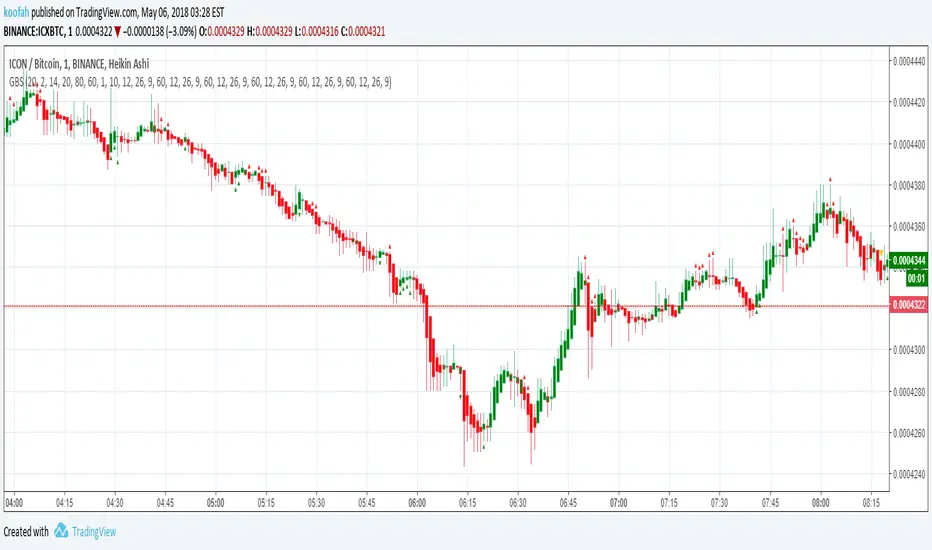
Buy Signal and Entry points (alpha)
Here is some study for my new bot project. 🤖
Indicator shows entry points (buy signals). Bets results on 15M TF and higher. (1H recommended)
Pay attention to how the script gives signals before the pumps. 📈📈📈
You can cut false signals by using stop-loss orders (recommended).
Use on you own risk.
This is alpha version of script. May be updated in the future.
=================================================================
Стратегия разработанная для нашего торгового бота. 🤖
Индикатор показывает точки входа на покупку. Показывает хорошие результаты на ТФ 15М и выше. (Рекомендую 1Ч)
Обратите внимание на то, как скрипт срабатывает перед пампами. 📈📈📈
Чтобы купировать ложные сигналы, рекомендую использовать стоп-лосс ордера.
Это альфа версия скрипта, возможно будет дорабатываться и обновляться. Но это не точно :)

RSI-MTF-Histo-EntryThis indicator gives a histogram of RSI in relation to an ema of the RSI.
The histogram is then smoothed to reduce false signals.
The actualiteit RSI line with overbought/overvols signals can be added or omitted as preferred.
The background can be color coded if the RSI is above or below 50.
Version 2. Added support for MTF. Longer timesframes (1h-3h) tend to give better entry results.
As an example the indicator was added two times, one for the current timeframe and one for a longer timeframe.


EMAGAIN + RSI Buy Signals with alerts for AutoviewThis indicator uses the lower of the fast & slow EMA together with RSI to plot buy signals. Alerts can then be created for bots like Autoview to automatically place orders at exchanges supported by the bot.
To create alerts:
- New Alert
- Select the EMAGAIN + RSI Buy Signals with alerts for Autoview", "Buy" and "Buy Signal" under condition
- Select "Once per Bar" or if you want to avoid repainting "Once per Bar close". Note that "Once per bar close" will place the buy order a bit later in most cases where "Once per bar" will buy earlier
Comments & suggestions welcome
---------------------------------------------------------------------
Informational videos on my Tradingview scripts below:
www.youtube.com

Trend Continuation FactorTrend Continuation Factor indicator script.
This indicator was originally developed by M.H. Pee (Stocks & Commodities V. 20:3 (58-64): Trend Continuation Factor).

RSI-Histo-Entry_JDThis indicator shows a histogram of the RSI in relation to an ema of the RSI.
The histogram is then smoothed to give early reversal/entry signals.
The actual RSI line with oversold/overbought indication can be displayed or omitted, as preferred.
In addiction to the RSI line or as an alternative to it, the background colour can be set to change folowing the RSI signals.
JD.

ProfitTrailer v2 LOWBB & RSI Buy SignalsThis script will display buy signals when configured LOWBB & RSI Conditions are met. I've created this script to help ProfitTrailer 2.0 subscribers understand when the bot will buy based on their selected RSI & BB values.
I will create more of these scripts so let me know in the comments if you would like to see some of the other strategies for example EMAGAIN + RSI + MACD or LOWBB + MACD etc. I will add the sell signals shortly.

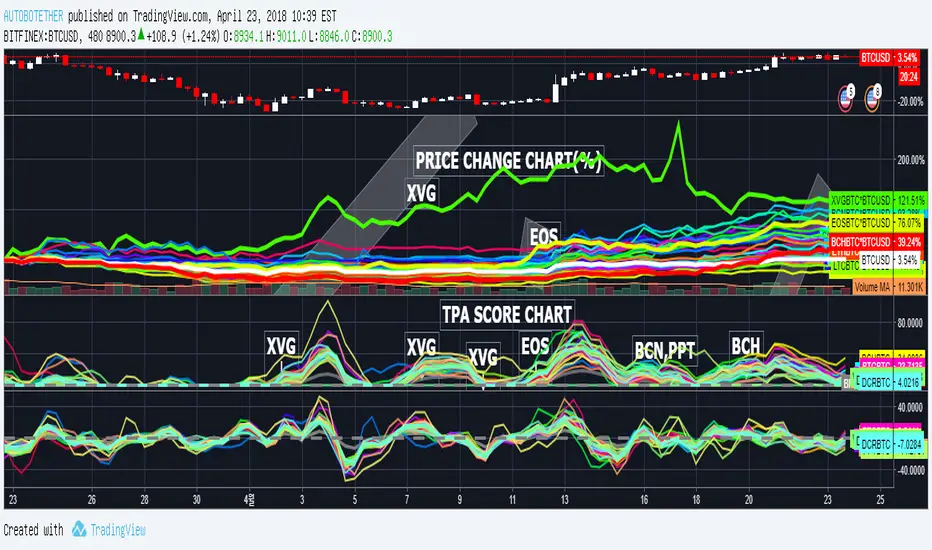
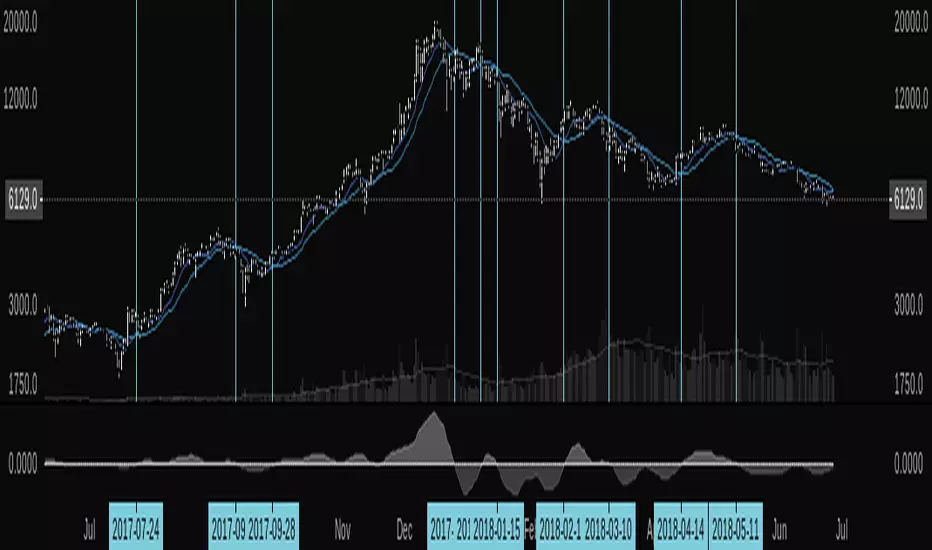
TAKE PROFIT AGAIN SCORE(TPA)_MARKETCAP verTAKE PROFIT AGAIN SCORE(TPA)_MARKETCAP
또땃 스코어 상위시총 ver
------------------------------------------------------------------------------
This indicator is designed to find coins that are strong in market conditions.
It is recommended that users have an understanding of basic charts.
Careful investment is needed after the trend of the score itself has been on the downward trend.
Coins usually give the strongest return that run at the top of the score.
The realization of the profit on the chart must be done by the person himself.
When purchasing coins at the top of the score chart, we recommend the number of sheets at the adjustment point on the chart.
Because this index is a trend score, you may not be able to catch the start wave. To do this, use a starting wave catcher.
The coins listed in this index are coins of the highest rank in order of Market Cap and will be updated at regular intervals.
At last year's rise of coin, it is based on catching light coin, Qtum, ripple, Ada , Stella, Tron rise.
Indicator vouchers will only be available to a small number of paid subscribers.
Thank you.
---------------------------------------------------------------------------------------------
이 지표는 시장 상황에서 강세를 띠는 코인을 찾아내기 위해 만들어 졌습니다.
기본적인 차트에 대한 이해가 있는 사용자가 사용하길 권합니다.
스코어자체의 추세가 하향을 한 이후는 신중한 투자가 필요합니다.
통상 가장 강한 수익을 주는 코인이 스코어 최상단을 달립니다.
차트상의 수익실현은 본인이 직접 수행해야 합니다.
통상 스타팅 파동을 잡아내는 스타팅 파동 캐쳐와 함께 사용합니다.
스코어차트상 최상단의 코인을 매수 할 시 차트상 조정지점에서 매수를 권합니다.
본 지표는 트렌드 점수 이기 때문에 시작 파동을 잡아내지 못할 수 있습니다.
이를 위해선 스타팅웨이브 캐쳐를 함께 사용합니다.
본 지표에 나와있는 코인들은 마켓 캡으로 상위등급의 코인들이며 일정 간격으로 업데이트 될 것입니다.
작년 코인상승장에서, 라이트코인,Qtum,리플,에이다,스텔라,트론 상승을 잡아낸 기반지표 입니다.
지표 이용권은 소수의 유료 구독 사용자들에게만 공개될 예정입니다.
감사합니다.
추가적으로 시장 싸이클 상에서 바닥 이후 가장 효과를 발휘하는 지표입니다.
마켓캡 상위 코인들에 대한 지표적용을 함으로 단발펌핑물림이나, 안정성을 떠난 매매에서 당신을 보호할 수 있습니다.