Dark Cloud [TradingFinder] Piercing Line Reversal chart Pattern
🔵 Introduction
"Reversal candlestick patterns" are among the Japanese candlestick patterns considered as alerts for a potential change in the current price trend. It is often assumed that by identifying reversal candlestick patterns, the price trend will definitely change, either from bullish to bearish or from bearish to bullish. However, this claim is not entirely accurate, and a change in price trend does not always mean a reversal.
Nonetheless, the importance of reversal candlestick patterns remains significant. By recognizing these patterns, you can better predict changes in the trend with higher probability and make better trading decisions.
🔵 Dark Cloud
The "Dark Cloud" pattern occurs when, after an upward trend, buyers continue to drive the price up in the first candle. However, in the next candle, with sellers entering and increasing selling pressure, the price starts to decrease compared to the close of the previous candle.
This price decrease is significant enough that in the last candle, the price goes lower than the open of the previous candle, serving as a warning sign for a potential change in price trend.
The fundamental principles for the formation of the "Dark Cloud" pattern include :
1.Two candles consisting of a positive candle (first candle) and a negative candle (second candle) whose main body should be above the halfway point of the first candle's main body but does not completely cover it.
2.The color of the main body of the second candle should be opposite to the color of the main body of the first candle.
Factors affecting the strength of the "Dark Cloud" pattern include :
1.The length of the bodies of both candles, especially the second candle, which increases the strength of the pattern.
2.The gap between the two bodies can also indicate the strength of the pattern.
3.The absence of a lower shadow in the second candle also indicates the strength of the pattern.
4.If the pattern forms in a price resistance range, it has more strength.
🔵 Piercing Line
The "Piercing Line" pattern occurs when, after a downward trend, sellers decrease the price by offering their shares on the first day. However, on the next day, with buyers entering and increasing demand, the price starts to increase compared to the close of the previous day.
This increase is significant enough that in the last candle, the price goes higher than the open of the previous day, serving as a warning sign for a reversal in the price trend. Overall, this pattern is the opposite of the "Dark Cloud" pattern and occurs under a bearish trend.
The fundamental principles for the formation of the "Piercing Line" pattern include :
1.Two candles consisting of a negative candle (first candle) and a positive candle (second candle) whose main body should be above the halfway point of the first candle's main body but does not completely cover it.
2.The color of the main body of the second candle should be opposite to the color of the main body of the first candle.
Factors affecting the strength of the "Piercing Line" pattern include :
1.The length of the bodies of both candles, especially the second candle, which increases the strength of the pattern.
2.The gap between the two bodies can also indicate the strength of the pattern.
3.The absence of an upper shadow in the second candle also indicates the strength of the pattern.
4.If the pattern forms in a price support range, it has more strength.
🔵 How to Use
The "green circle" symbol corresponds to the "Strong Piercing Line" signal, the "blue triangle" symbol corresponds to the "Weak Piercing Line" signal, the "red circle" symbol corresponds to the "Strong Dark Cloud" signal, and the "red triangle" symbol corresponds to the "Weak Dark Cloud" signal.
🔵 Setting
Using the "Show Dark Cloud" and "Show Piercing Line" buttons, you can enable or disable the display of Dark Cloud and Piercing Line.
Candlesticksignals

CandleStick [TradingFinder] - All Reversal & Trend Patterns🔵 Introduction
"Candlesticks" patterns are used to predict price movements. We have included 5 of the best candlestick patterns that are common and very useful in "technical analysis" in this script to identify them automatically. The most important advantage of this indicator for users is saving time and high precision in identifying patterns.
These patterns are "Pin Bar," "Dark Cloud," "Piercing Line," "3 Inside Bar," and "Engulfing." By using these patterns, you can predict price movements more accurately and therefore make better decisions in your trades.
🔵 How to Use
Pin Bar : This pattern consists of a Candle where "Open Price," "Close Price," "High Price," and "Low Price" form the "Candle Body," and it also has "Long Shadow" and "Short Shadow." In the visual appearance of the Pin Bar pattern, we have a candle body and a pin bar shadow, where the candle body is smaller relative to the shadow.
Just as the candle body plays an important role in analysis, the pin bar shadow can also be influential. The larger the pin bar shadow, the stronger the expectation of a trend reversal.
When a "bearish pin bar" occurs at resistance or the chart ceiling, it can be predicted that the price trend will be downward. Similarly, at support points and the chart floor, a "bullish pin bar" can indicate an upward price movement.
Additionally, patterns like "Hammer," "Shooting Star," "Hanging Man," and "Inverted Hammer" are types of pin bars. Pin bars are formed in two ways: bullish pin bars have a long lower shadow, and bearish pin bars have a long upper shadow. Important: Displaying "Bullish Pin Bar" is labeled "BuPB," and "Bearish Pin Bar" is labeled "BePB."
Dark Cloud : The Dark Cloud pattern is one type of two-candle patterns that occurs at the end of an uptrend. The 2-candle pattern indicates the shape of this pattern, which actually consists of 2 candles, one bullish and one bearish. This pattern indicates a trend reversal and is quite powerful.
The Dark Cloud pattern is seen when, after a bullish candle at the end of an uptrend, a bearish candle opens at a higher level (weakly, equal, or higher) than the closing point of the bullish candle and finally closes at a point approximately in the middle of the previous candle. In this indicator, the Dark Cloud pattern is identified as "Wick" and "Strong" .
The difference between these two lies in the strictness of their conditions. Important: Strong Dark Cloud is labeled "SDC," and Weak Dark Cloud is labeled "WDC."
Piercing Line : The Piercing candlestick pattern consists of 2 candles, the first being bearish and consistent with the previous trend, and the second being bullish. The conditions of the pattern are such that the first candle is bearish and a price gap is created between the two candles upon the opening of the next candle because its opening price is below (weakly equal to or less than) the closing price of the previous candle.
Additionally, its closing price must be at least 50% above the red candle.
This means that the second candle must penetrate at least 50% into the first candle. Important: Strong Piercing Line is labeled "SPL," and Weak Piercing Line is labeled "WPL."
3 Inside Bar (3 Bar Reversal) : The 3 Inside Bar pattern is a reversal pattern. This pattern consists of 3 consecutive candles and can be either bullish or bearish. In the bullish pattern (Inside Up) formed at the end of a downtrend, the last candle must be bullish, and the third candle from the end must be bearish.
Additionally, the close price must be more than 50% of the third candle from the end. In the bearish pattern (Inside Down) formed at the end of an uptrend, the last candle must be bearish, and the third candle from the end must be bullish. Additionally, the close price must be less than 50% of the third candle from the end. Important: Bullish 3 Inside Bar is labeled "Bu3IB," and Bearish 3 Inside Bar is labeled "Be3IB."
Engulfing : The Engulfing candlestick pattern is a reversal pattern and consists of at least two candles, where one of them completely engulfs the body of the previous or following candle due to high volatility.
For this reason, the term "engulfing" is used for this pattern. This pattern occurs when the price body of a candle encompasses one or more candles before it. Engulfing candles can be bullish or bearish. Bullish Engulfing forms as a reversal candle at the end of a downtrend.
Bullish Engulfing indicates strong buying power and signals the beginning of an uptrend. This pattern is a bullish candle with a long upward body that completely covers the downward body before it. Bearish Engulfing, as a reversal pattern, is a long bearish candle that engulfs the upward candle before it.
Bearish Engulfing forms at the end of an uptrend and indicates the pressure of new sellers and their strong power. Additionally, forming this pattern at resistance levels and the absence of a lower shadow increases its credibility. Important: Bullish Engulfing is labeled "BuE," and Bearish Engulfing is labeled "BeE."
🔵 Settings
This section, you can use the buttons "Show Pin Bar," "Show Dark Cloud," "Show Piercing Line," "Show 3 Inside Bar," and "Show Engulfing" to enable or disable the display of each of these candlestick patterns.

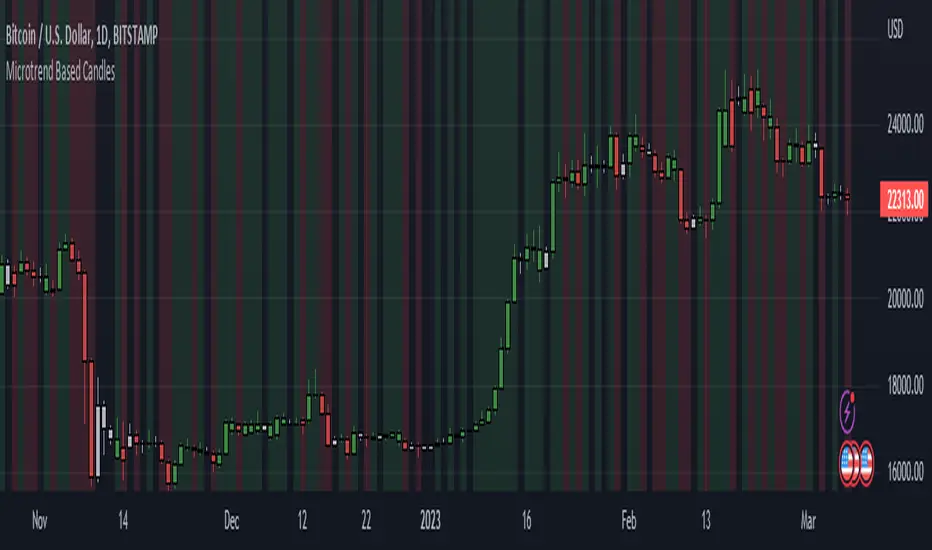
Enhanced Candle Sticks [AlgoAlpha]🚀🌟 Introducing the Enhanced Candle Sticks by AlgoAlpha, a Pine Script tool designed to provide traders with an enhanced view of market dynamics through candlestick analysis. This script aims to visualise if price has hit the high or low of the candle first, aiding in back-testing, and to identify smaller trends using market structure.📊🔍
Key Features:
Timeframe Flexibility: Users can select their desired timeframe for analysis, offering a range of options from M15 to H12. This flexibility allows for detailed and specific timeframe analysis.
Micro Trend Identification: The script includes an option to enable 'MicroTrends', giving traders insights into smaller movements and trends within the larger market context.
Customizable Visuals: Traders can customize the colors of bullish and bearish candlesticks, enhancing visual clarity and personalizing the chart to their preferences.
State Tracking: The script tracks the 'state' of the market on lower timeframes to detect if the high or the low was formed first.
Warning System: When the selected timeframe does not match the chart timeframe, the script generates a warning, ensuring accurate analysis and preventing potential misinterpretations.
Usages:
Enhanced Back-testing: Users can now get a more accurate interpretation of the candlesticks by know if the high or the low came first (denoted with ⩚ or ⩛), especially in scenarios where the high and the low of the larger timeframe candle is touching both the take-profit and stop-loss levels.
Squeeze Analysis: Users can identify squeezes in price when the microtrend shows both an uptrend and a downtrend, possibly giving more insight into the market.
Lower Timeframe Market Structure Analysis: Microtrends form when the low of the candle is consecutively increasing and the high is consecutively falling, which means on a lower timeframe, price is forming higher lows or lower highs.
Basic Logic Explanation:
- The script starts by setting up the necessary parameters and importing the required library. Users can customize the timeframe, colors, and whether to enable micro trends and candlestick plotting.
- It then calculates the lower timeframe (1/12th of the current timeframe) for more detailed analysis. The `minutes` function helps in converting the selected timeframe into minutes.
- The script tracks new bars and calculates the highest and lowest values within an hour, using `ta.highestSince` and `ta.lowestSince`.
- It determines the market 'state' by checking if the current high is breaking the previous high and if the current low is breaking the previous low on lower timeframes to determine if the high or the low was formed first.
- The script uses the `plotchar` and `plotcandle` functions to visually represent these trends and states on the chart. This visual representation is key for quick and effective analysis.
Alerts:
Alerts can be set for microtrend formations:
This script is a valuable tool for traders looking to deepen their market analysis with enhanced candlestick visualization and micro trend tracking. 📈🔶💡

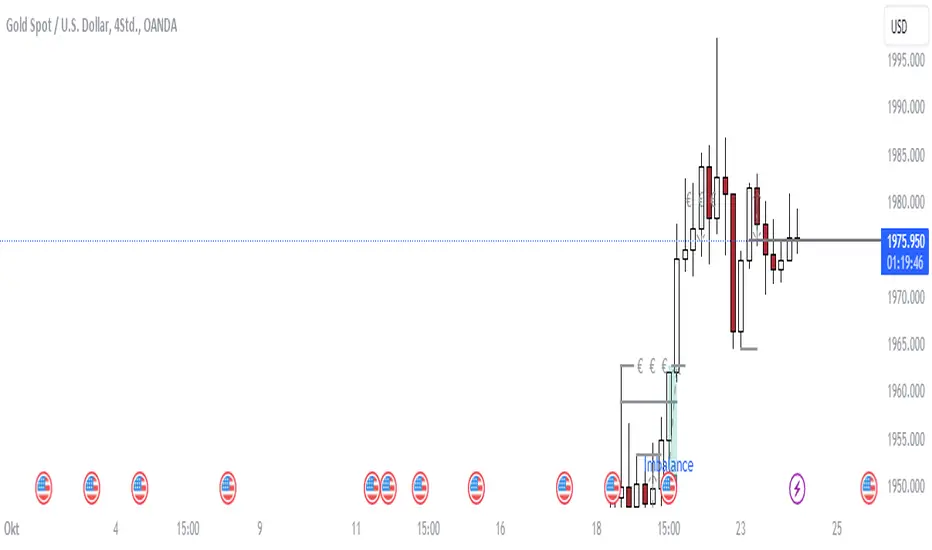
Flat Combo DetectorFlat Combo Detector (FCD)
Introduction:
The Flat Combo Detector is a unique tool crafted to aid traders in identifying potential trend reversals. Unlike standard indicators that primarily focus on moving averages or oscillators, the FCD bases its signals on specific candlestick patterns that manifest at crucial trend pivot points.
I use it mostly on OANDA:XAUUSD Gold
How It Works:
The logic of the Flat Combo Detector revolves around the formation of consecutive bearish and bullish candles with particular attributes:
Bearish to Bullish Transition:
Primary Candle : A bearish candle where the close is lower than the open and its close is equal to its low.
Following Candle: A bullish candle where the close is higher than the open, and the open approximates its low (within a user-defined tolerance).
Signal : A green triangle plotted below the price bar, indicating a potential shift from a bearish to bullish trend.
Bullish to Bearish Transition:
Primary Candle: A bullish candle where the close is higher than the open and equals its high.
Following Candle : A bearish candle where the close is lower than the open, and the open approximates its high (within a user-defined tolerance).
Signal : A red triangle plotted above the price bar, indicating a potential transition from a bullish to bearish trend.
Usage Guidance:
For traders unfamiliar with Pine Script, using this indicator is straightforward. Once added to the chart, look for the green and red triangle signals. A green triangle below a price bar suggests a possible bullish reversal, while a red triangle above a price bar hints at a potential bearish reversal. Always consider these signals in conjunction with other technical analysis tools and the broader market context to optimize decision-making.
Associated Strategy:
I've also developed a trading strategy that utilizes these specific entry points identified by the FCD. If you find the signals from this indicator helpful, you might also be interested in exploring the strategy for a comprehensive trading approach. Always remember to backtest and validate any strategy before live trading.
Chart Presentation:
The published chart associated with this script has been kept clean to ensure clarity. Users will only observe the main price bars/candles along with the green and red triangle signals generated by the FCD.
Conclusion:
The Flat Combo Detector provides traders with a fresh perspective on trend reversal points. Its focus on specific candlestick patterns makes it a valuable tool, especially when used in combination with other technical indicators. Always ensure to practice prudent risk management and consult multiple analysis methods before making trading decisions.
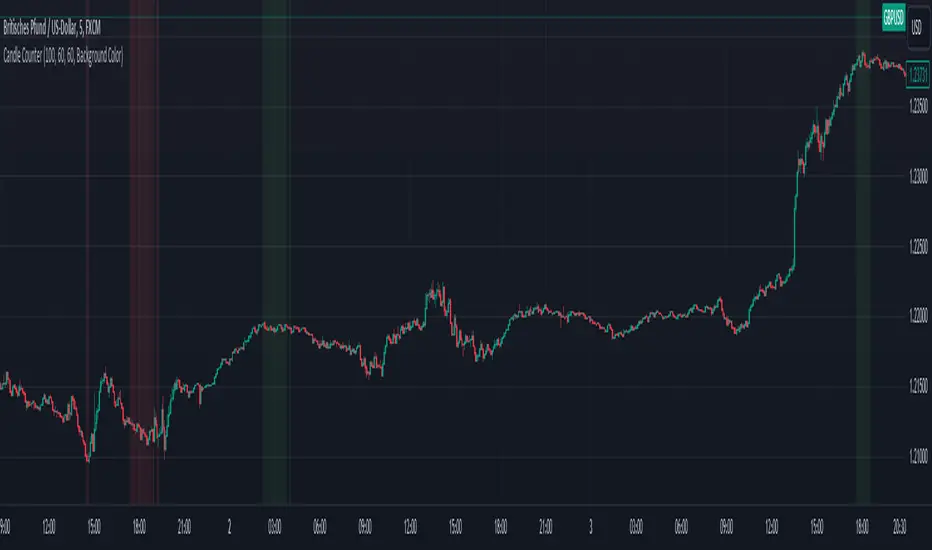
Bullish vs. Bearish Candle CounterFollowing an exhaustive analysis of the most recent 50,000 candles within a given currency pair, a notable equilibrium between bearish and bullish candles has emerged as a persistent market phenomenon. This equilibrium, indicative of the market's continuous endeavor to establish parity, has spurred the development of the following indicator.
The indicator meticulously scrutinizes the preceding 100 candles, promptly triggering an on-chart marker when either bullish or bearish candle counts surpass the threshold of 60%. This marker serves as an invaluable tool, providing traders with a potential signal for the initiation of a trend reversal.
As such, this indicator serves as a valuable asset in a trader's toolkit, offering insights into shifts in market sentiment and the prospect of emerging trends.
Key Features:
- Customizable Candle Count: Traders can set the number of candlesticks to be analyzed in the input parameters, allowing flexibility in their analysis.
- Bullish and Bearish Percentage: Users can define their desired percentage for both bullish and bearish candles in the indicator's settings. The indicator calculates the percentage of each candle type within the specified range.
- Arrow Signals: The indicator plots arrows above or below the current candle, indicating bullish or bearish conditions based on the defined percentage thresholds. A green arrow signifies bullish sentiment, while a red arrow denotes bearish sentiment.
How to Use:
- Adjust Parameters: In the indicator settings, users can customize the number of candlesticks to be analyzed, as well as set their preferred percentages for both bullish and bearish conditions.
- Interpret Arrows: The indicator generates arrows above or below the current candle, reflecting the prevailing market sentiment. A green arrow suggests a bullish bias, while a red arrow indicates a bearish bias.
- Trade with Confidence: Traders can use this indicator as a tool to gauge market sentiment and make informed trading decisions. It helps identify potential entry and exit points based on the chosen percentage thresholds.
TrendLine CrossThis indicator "TrendLine Cross", is designed to plot trend lines so you can spot potential trend reversal points on the charts. The main function is to draw several lines on the chart and identify the crossings between these lines, which can be significant indicators for trading. The lines are based on different periods which can be changed in the settings tabs.
Let's see the characteristics of the trend lines:
_Low Line Color(Green Line): This line connects the lowest point of low prices in the "low_time" period with the lowest point of low prices in the "high_time" period. Indicates a possible short-term support level on the chart.
_Liquidity Up Line Color (Golden Line): This line connects the lowest point of low prices in the "low_time" period with the highest point of low prices in the same period. It represents a liquidity zone and an important resistance in the chart.
_Lower Line Color (Blue Line): This horizontal line connects the lowest point of low prices in the "LowerLine_period" with the lowest point of low prices in the "high_time" period. Indicates a possible long-term support level.
_Upper Line Colorr: This line represents a connection between the highest points of the "high_time" period and the lowest point of the "LowerLine_period". Indicates a possible long-term resistance level.
_Up Line Color (Red Line): This line connects the highest point of high prices in the "high_time" period with the highest point of high prices in the "LowerLine_period". It represents a possible long-term resistance level.
_Liquidity Down Line Color(Golden Line): This line connects the highest point of high prices in the "high_time" period with the highest point of low prices in the "low_time" period. It represents a liquidity point and an important support zone.
The indicator becomes particularly interesting when the lines make crossings. These crossovers could suggest a potential trend change in the market. For example:
Change from Bearish to Bullish: If the "long-term" line (black) crosses the "short- or long-term" line (green or blue) from top to bottom, it could indicate a shift from a bearish to a bullish market , suggesting the opportunity for long positions.
_Changing from Bullish to Bearish: If the "long-term" line (blue) crosses the "short-term" line (red or black) from bottom to top, it could indicate a shift from a bullish to a bearish market, suggesting the opportunity for short positions.
Generally speaking, crossings between these lines can be key points of interest for traders, as they can signal significant changes in price direction.

Directional Pressure (maybexo)Liquidity Candles, observed in financial markets, display distinctive candlestick patterns that are noteworthy. These candles exhibit intentional price behavior aimed at triggering stop-loss orders and momentarily misleading traders. The pattern typically starts with a price movement against the current trend, activating stop-loss orders and capitalizing on liquidity from traders anticipating the prevailing trend. Subsequently, the price swiftly changes course, breaking and conclusively closing beyond the prior candle's range, often surprising unsuspecting traders.
Characteristics:
1. Liquidity Grab:
- Liquidity Candles initiate with a deliberate move against the existing trend, aimed at triggering stop-loss orders and gathering liquidity from traders who have placed stops in anticipation of the initial trend.
- Notably, the size of the wick in this liquidity grab is significant; a larger wick indicates a more substantial liquidity grab and can strengthen the indication of a potential market reversal.
2. Swift Reversal and Breakout:
- Following the liquidity grab, the price swiftly changes direction, breaking and conclusively closing above or below the previous candle's range.
3. Institutional Behavior:
- These candles are often linked to institutional trading behavior, suggesting potential involvement by significant market participants due to their distinct and deliberate price action.
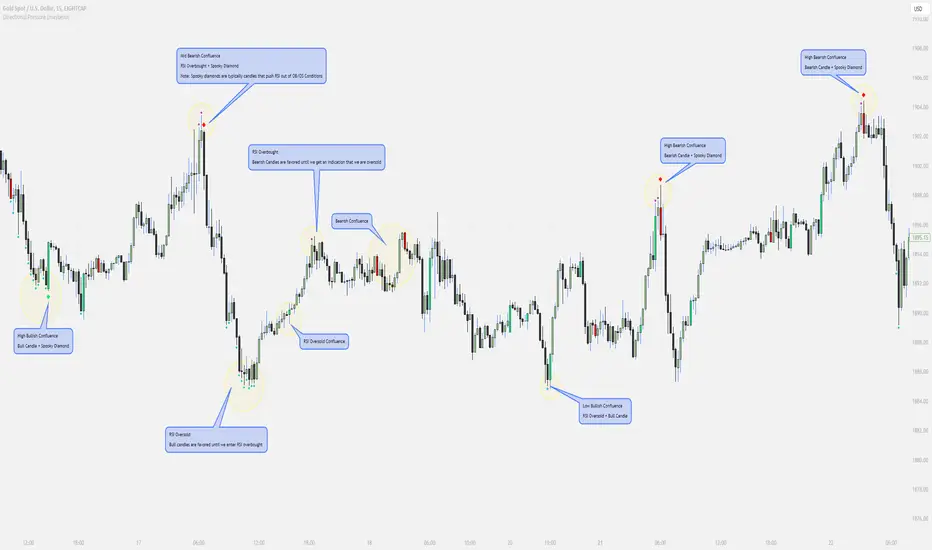
// Diamonds
1. RSI Diamonds:
The RSI Diamonds represent RSI entering either overbought or oversold levels.
These Diamonds serve as an early indication for "Spooky Diamonds" as Spooky Diamonds can only form in these conditions
2. Spooky Diamonds:
The Spooky Diamonds highlight specific candle conditions, aiding in the identification of bullish or bearish momentum in the market while considering the RSI status.
Bullish Candle Momentum: The candle size is greater than the previous candle multiplied by a user-defined factor (filterMultiplier) and the closing price is higher than the opening price. This can suggest bullish momentum.
Bearish Candle Momentum: The candle size is greater than the previous candle multiplied by the filterMultiplier, and the closing price is lower than the opening price. This can suggest bearish momentum.
Important Notes:
The Candles + Diamonds should not be used in isolation as buy or sell signals but rather as additional information for your trading strategy.
The goal of this indicator is to provide a visual representation of RSI data and potential momentum during overbought or oversold conditions.
By utilizing the diamonds and candles, you can easily identify RSI levels and their interaction with candles, aiding in decision-making within your trading strategy.
Disclaimer: Always consider your risk tolerance and conduct thorough analysis before making any trading decisions.
Inspiration Credits:
Vanitati
Mr. Casino
Range Breakout Signals (Intrabar) [LuxAlgo]The Range Breakout Signals (Intrabar) is a novel indicator highlighting trending/ranging intrabar candles and providing signals when the price breaks the extremities of a ranging intrabar candles.
🔶 USAGE
The indicator highlights candles with trending intrabar prices, with uptrending candles being highlighted in green, and down-trending candles being highlighted in red.
This highlighting is affected by the selected intrabar timeframe, with a lower timeframe returning a more precise estimation of a candle trending/ranging state.
When a candle intrabar prices are ranging the body of the candle is hidden from the chart, and one upper & lower extremities are displayed, the upper extremity is equal to the candle high and the lower extremity to the candle low. Price breaking one of these extremities generates a signal.
The indicator comes with two modes, "Trend Following" and "Reversal", these modes determine the extremities that need to be broken in order to return a signal. The "Trend Following" mode as its name suggests will provide trend-following signals, while "Reversal" will aim at providing early signals suggesting a potential reversal.
🔶 DETAILS
To determine if intrabar prices are trending or ranging we calculate the r-squared of the intrabar data, if the r-squared is above 0.5 it would suggest that lower time frame prices are trending, else ranging.
This approach allows almost obtaining a "settings" free indicator, which is uncommon. The intrabar timeframe setting only controls the intrabar precision, with a timeframe significantly lower than the chart timeframe returning more intrabar data as a result, this however might not necessarily affect the displayed information by the indicator.
🔶 SETTINGS
Intrabar Timeframe: Timeframe used to retrieve the intrabar data within a chart candle. Must be lower than the user chart timeframe.
Auto: Select the intrabar timeframe automatically. This setting is more adapted to intraday charts.
Mode: Signal generation mode.
Filter Out Successive Signals: Allows removing successive signals of the same type, returning a more easily readable chart.

blackOrb CandleAddressing the Shortcomings of Conventional Candle Charts
I. Surmounting Volatility Challenges
In the realm of combined heightened or subdued volatility and erratic market conditions, traditional candlestick charts are susceptible to deficiencies in isolating extraneous data noise (e.g. high/low wicks, given their frequent incongruity with pivotal market dynamics or arbitrary green/red coloring of candle bodies).
II. Precision in Application
Novice traders may erroneously construe and misemploy traditional candlestick patterns, culminating in erroneous trading determinations. In addressing this challenge, this indicator can help to identify critical signal confluences, enhancing potential signals accuracy.
III. Strategy at the Core
Relying solely on candlestick charts lacks potency without an underpinning well-knit strategy. blackOrb's methodology integrates discernment of pivotal chart configurations with the meticulous construction of comprehensive strategies to mirror a comprehension of potential market dynamics.
blackOrb's Aspirations: Overcoming Enunciated Challenges of Traditional Candle Charts
- Customizable Data Analysis
Engendering the evolution of candle charts involves the judicious adjustment of multifarious open/high/low/close iterations coupled with evaluative mechanisms such as Heikin Ashi and MA smoothing, combined with stochastic calculations.
- Holistic Perspective
Seamless deployment of trading strategies is engendered through salient facets, encompassing up- and downside ratios as well as adaptable true range visualizations, attuned to unfolding price dynamics.
- Personalized Approach
Adaptations in trading styles are seamlessly accommodated, as this indicator offers stochastic candle coloring with customizable stochastic look-back evaluation phases. A selection of over 20 color schemes accommodates individual preferences to differentiate various chart setups at first glance.
Note: However, it's important to recognize that the efficacy of evaluation coloring might be compromised during periods of lateral price movement, characterized by less prominent market trends.
- Ghost Mode for Comparative Insights
Unveiling correlations and divergences, the Ghost Mode overlays two candle charts, which can reveal price trajectories and reactions (e.g. Apple stock's potential response to the NASDAQ 100 Technology Sector Index).
Note: This approach may not capture nuanced correlations during intricate market scenarios.
Technical Methodology
At its core, the stochastic calculation methodology of this indicator centers around the following formula:
100 * (close - lowest(low, length)) / (highest(high, length) - lowest(low, length))
This key formula employs a stochastic calculation methodology that assesses the percentage deviation of the closing price from the lowest low over a specified timeframe (length), relative to the span between the highest high and the lowest low. The outcome is normalized within a range of 0 to 100, providing insights into the relative position of the closing price within the high-low range. Traders can define the specific periods over which the stochastic calculation is performed.
Based on this stochastic analysis, the indicator integrates candle coloring, affording users the flexibility to adjust the sensitivity of candle coloring according to customized stochastic look-back evaluation phases. Consequently, the coloration of candles by length evaluation can mirror a comprehension of market dynamics.
By allowing traders to designate specific periods for the stochastic calculation, it fosters adaptability in combination with the following technical features:
- Conjoining optional transparent Heikin Ashi and/or a weighted MA alternative to harness the virtues of smoothing sans confounding authentic price data and candle dynamics
- Individual electable focus range encompassing retrospection and real-time alignments
- Intra-temporal evaluations, sub-domains & amalgamated value permutations
- Prioritizing individually chosen focus time intervals within the realm of real price highs and lows
- Elaborate price display (e.g. high/low/ohlc4/close) upon chart-hover, accentuating close price implications
- Features offering diverse scaling options, alongside adaptable and customizable price display
- Unveiling uncluttered and directed candle body visualization, implementing wicks to the transparent candle body, given their frequent incongruity of high/low data with pivotal market dynamics
Note on Usability
This indicator isn't intended for standalone trading application. Instead, it offers an alternative approach to traditional candle charts, serving as a supplementary tool for orientation within broader trading strategies.
Irrespective of market conditions, it can harmonize with a wider range of trading styles and instruments/trading pairs/indices like Stocks, Gold, EURUSDSPX500, GBPUSD, BTCUSD and Oil.
Inspiration and Publishing
Taking genesis from the inspirations amongst others provided by TradingView Pine Script Wizard Kodify, blackOrb Candles is an multi-encompassing script meticulously forged from scratch. It aspires to furnish a comprehensive candle chart approach, borne out of personal experiences and a strong dedication in supporting the trading community. We eagerly await valuable feedback to refine and further enhance

Price Percentage Shaded CandlesDescription:
The Price Percentage Shaded Candles indicator (P%SC) is a technical analysis tool designed to represent price candles on a chart with shading intensity based on the percentage change between the open and close prices. This overlay indicator enhances visual analysis by providing a visual representation of price movement intensity.
How it Works:
The P%SC indicator calculates the percentage change between the open and close prices of each candle. It then determines the shading intensity of the price candles based on this percentage change. Higher percentage changes result in darker shading, while lower percentage changes result in lighter shading.
Usage:
To effectively utilize the Price Percentage Shaded Candles indicator, follow these steps:
1. Apply the Price Percentage Shaded Candles indicator to your chart by adding it from the available indicators.
2. Configure the indicator's inputs:
- Specify the color for bullish candles using the "Bullish Color" input.
- Specify the color for bearish candles using the "Bearish Color" input.
3. Observe the shaded candles on the chart:
- Bullish candles are colored with the specified bullish color and shaded according to the percentage change.
- Bearish candles are colored with the specified bearish color and shaded according to the percentage change.
4. Interpret the shaded candles:
- Darker shading indicates a higher percentage change and stronger price movement during the corresponding candle.
- Lighter shading indicates a lower percentage change and weaker price movement during the corresponding candle.
5. Combine the analysis of shaded candles with other technical analysis tools, such as trend lines, support and resistance levels, or candlestick patterns, to identify potential trade setups.
6. Implement appropriate risk management strategies, including setting stop-loss orders and position sizing, to manage your trades effectively and protect your capital.
Note: The Price Percentage Shaded Candles indicator provides insights into the shading intensity of price candles based on percentage changes. However, it is recommended to use this indicator in conjunction with other technical analysis tools and perform thorough analysis before making trading decisions.
ADX Momentum Shaded CandlesDescription:
The "ADX Momentum Shaded Candles" indicator (ADXMSC) is an overlay indicator that enhances candlestick charts by adding shading based on the momentum derived from the Average Directional Index (ADX). This indicator provides visual cues about the strength of bullish and bearish momentum by adjusting the transparency of the candlesticks.
How it Works:
The indicator utilizes the ADX indicator to calculate the values of +DI (Directional Indicator Plus) and -DI (Directional Indicator Minus) based on user-defined parameters. It then determines the transparency levels for the bullish and bearish candlesticks based on the calculated values of +DI and -DI. Higher values of +DI or -DI result in lower transparency levels, while lower values increase transparency.
Transparency Calculation:
The transparency of the bullish and bearish candlesticks is adjusted based on the values of +DI and -DI, which reflect the momentum of the price movement. Transparency is inversely proportional to these values, with higher values resulting in lower transparency. To calculate transparency, the indicator uses the formula 100 minus the value of +DI or -DI multiplied by 2. This ensures that higher values of +DI or -DI produce more opaque candlesticks.
Usage:
To effectively use the "ADX Momentum Shaded Candles" indicator (ADXMSC), follow these steps:
1. Apply the indicator to your chart by adding it from the available indicators.
2. Observe the candlesticks on the chart:
- Bullish candlesticks are represented by the original bullish color with adjusted transparency.
- Bearish candlesticks are represented by the original bearish color with adjusted transparency.
3. Analyze the transparency levels of the candlesticks to assess the strength of bullish and bearish momentum. Less transparent candlesticks indicate stronger momentum, while more transparent ones suggest weaker momentum.
4. Combine the visual information from the shaded candlesticks with other technical analysis tools, such as support and resistance levels, trend lines, or oscillators, to confirm potential trade opportunities.
5. Customize the indicator's parameters, such as the ADX length and smoothing, to suit your trading preferences.
6. Implement appropriate risk management strategies, including setting stop-loss orders and position sizing, to manage your trades effectively and protect your capital.

The Golden Candlestick PatternThe Golden pattern is a three-candlestick configuration based on a variation of the golden ratio (2.618) from the Fibonacci sequence.
The bullish Golden pattern is composed of a normal bullish candlestick with any type of body, followed by a bigger bullish candlestick with a close price that is at least 2.618 times the size of the first candlestick (high to low). Finally, there must be an important condition that is, a third candlestick that comes back to test the open of the second candlestick from where the entry is given.
The bearish Golden pattern is composed of a normal bearish candlestick with any type of body, followed by a bigger bearish candlestick with a close price that is at least 2.618 times the size of the first candlestick (high to low). Finally, there must be an important condition that is, a third candlestick that comes back to test the open of the second candlestick from where the entry is given.

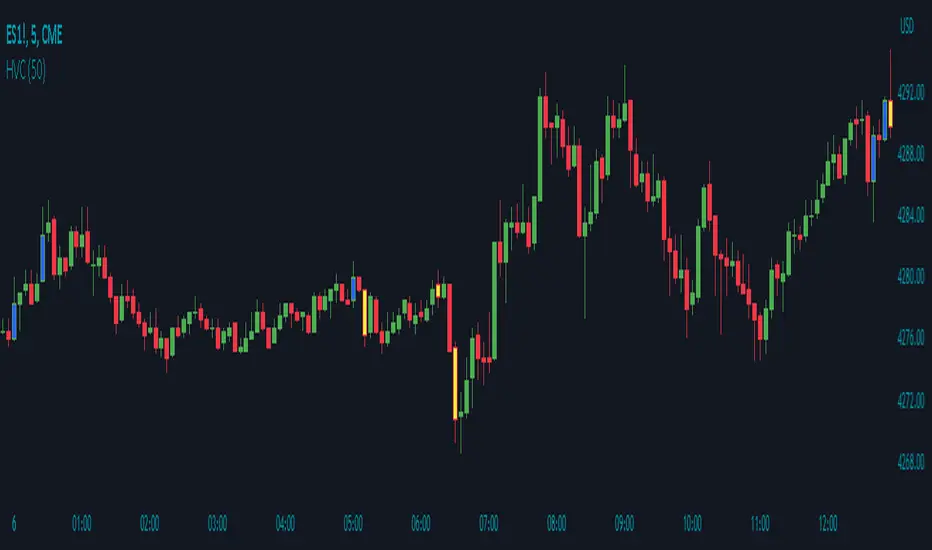
High Volume Candles by Time PeriodDescription:
The High Volume Candles indicator (HVC) is a technical analysis tool designed to identify candles with high trading volume. It allows traders to quickly spot periods of significant market activity based on volume.
How it Works:
The HVC indicator analyzes the volume of each candle in relation to the highest volume observed over a specified lookback period. The indicator compares the current volume with the highest volume within the defined lookback period and identifies candles that have volume equal to or greater than this threshold. It then distinguishes between bullish and bearish candles and assigns custom colors to highlight these high volume occurrences.
Usage:
To effectively utilize the High Volume Candles indicator, follow these steps:
1. Apply the HVC indicator to your chart by adding it from the available indicators.
2. Customize the lookback period according to your trading preferences. This parameter determines the number of previous candles to consider when calculating the highest volume.
3. Observe the candles on the chart:
- Bullish candles (blue by default) indicate periods of high volume when the closing price is higher than the opening price.
- Bearish candles (yellow by default) indicate periods of high volume when the closing price is lower than the opening price.
4. Pay attention to the color-coded volume indications within the candles, which highlight periods of high trading activity.
5. Analyze the volume patterns in conjunction with price action to identify potential trading opportunities. High volume candles often indicate increased market participation and can suggest significant price moves or reversals.
6. Combine the analysis of high volume candles with other technical analysis tools, such as trend lines, support and resistance levels, or indicators, to confirm potential trade setups.
7. Implement appropriate risk management strategies, including setting stop-loss orders and position sizing, to manage your trades effectively and protect your capital.
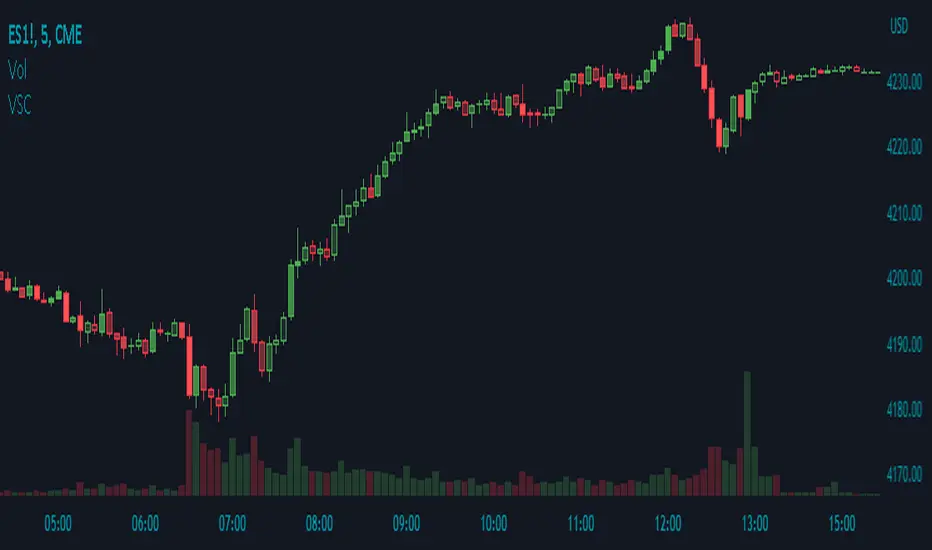
Volume Shaded CandlesDescription:
The Volume Shaded Candles indicator (VSC) is a technical analysis tool designed to represent price candles on a chart with transparency based on the volume traded during each candle. This overlay indicator enhances visual analysis by providing a visual representation of volume intensity.
How it Works:
The VSC indicator calculates the volume-to-transparency ratio by dividing the current volume by the highest volume within the last 10 periods. The ratio is then used to determine the shading intensity of the price candles. Higher volume relative to the recent highest volume results in lower transparency, while lower volume results in higher transparency.
Usage:
To effectively utilize the Volume Shaded Candles indicator, follow these steps:
1. Apply the Volume Shaded Candles indicator to your chart by adding it from the available indicators.
2. Configure the indicator's inputs:
- Specify the color for bullish candles using the "Bullish Color" input.
- Specify the color for bearish candles using the "Bearish Color" input.
3. Observe the shaded candles on the chart:
- Bullish candles are colored with the specified bullish color and shaded according to the volume intensity.
- Bearish candles are colored with the specified bearish color and shaded according to the volume intensity.
4. Interpret the shaded candles:
- Darker shading indicates higher volume during the corresponding candle.
- Lighter shading indicates lower volume during the corresponding candle.
5. Combine the analysis of shaded candles with other technical analysis tools, such as trend lines, support and resistance levels, or candlestick patterns, to identify potential trade setups.
6. Implement appropriate risk management strategies, including setting stop-loss orders and position sizing, to manage your trades effectively and protect your capital.
Crypto Uptrend Script + Pullback//Volume CandlesDescription: his is an adaption of my Pullback candle - This works on all timeframes and Markets (Forex//Stocks//)
Crypto Uptrend Script with Pullback Candle allows traders to get into a trend when the price is at end of a pullback and entering a balance phase in the market (works on all markets). The use of Moving averages to help identify a Trends and the use of Key levels to help traders be aware of where strong areas are in the market.
This script can work really well in Crypto Bull Runs when used on HTF and with confluences
The script has key support and resistance zones which are made up of quarterly data. Price reacts to these areas but patience is required as price will take time to come into these areas
I have updated the Pullback Candle with the use of Volume to filter out the weak Pullback Candles -
There are new candles to the script.
The First candle is the Bullish Volume Candle - This candle is set to a multiplier of 2x with a crossover of 50/100 on Volume - this then will paint a purple candle.
Uses of the Bullish Volume Candle:
Breakthrough of key areas // special chart patterns
Rejection of key areas
End of a impulse wave (Profit Takers)
The second candle is a Hammer - I prefer using the Hammers on Higher Timeframes however they do work on all timeframes. .
The third candle is a Exhaustion of impulse downward move.
Uses of this candle - can denote a new trend but has to be with confluence to a demand area // support area or with any use of technical analysis - using this alone is not advised
The fourth candle is a indecision candle in the shape of a Doji - this candle can help identify if the trend is in a continuation or a reversal
This script can work really well in Crypto Bull Runs
Disclaimer: There will be Pullbacks with High Volume (Breakouts) and not go the way as intended but this script is to allow traders to get into trends at good price levels. The script can paint signals in areas where price is too expensive so please do your own due diligence on the markets as this script is to help get into good areas of price
Please leave a thumbs up if you like this script and message me for information on how to use the script.

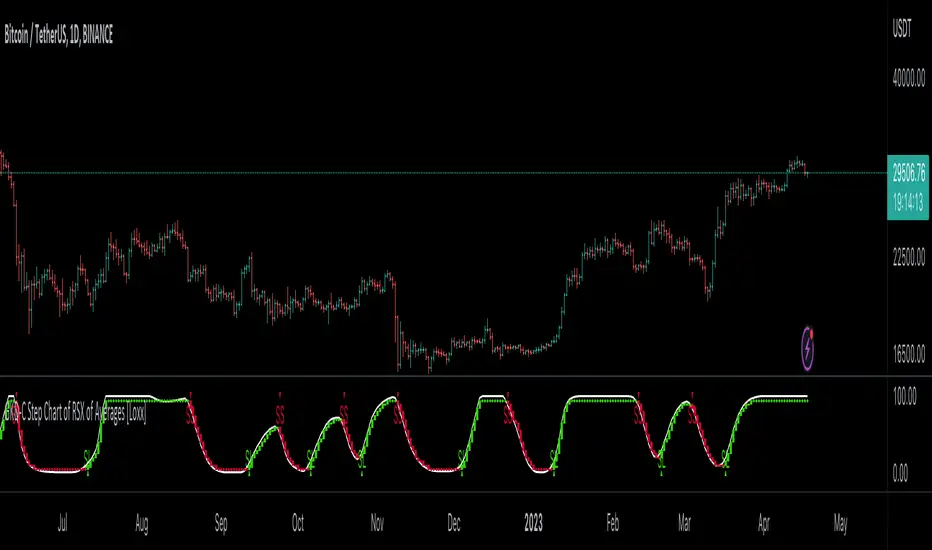
GKD-C Step Chart of RSX of Averages [Loxx]Giga Kaleidoscope GKD-C Step Chart of RSX of Averages is a Confirmation module included in Loxx's "Giga Kaleidoscope Modularized Trading System".
█ GKD-C Step Chart of RSX of Averages
What is the RSX?
The Jurik RSX is a technical indicator developed by Mark Jurik to measure the momentum and strength of price movements in financial markets, such as stocks, commodities, and currencies. It is an advanced version of the traditional Relative Strength Index (RSI), designed to offer smoother and less lagging signals compared to the standard RSI.
The main advantage of the Jurik RSX is that it provides more accurate and timely signals for traders and analysts, thanks to its improved calculation methods that reduce noise and lag in the indicator's output. This enables better decision-making when analyzing market trends and potential trading opportunities.
A Comprehensive Analysis of the stepChart() Algorithm for Financial Technical Analysis
Technical analysis is a widely adopted method for forecasting financial market trends by evaluating historical price data and utilizing various statistical tools. We examine an algorithm that implements the stepChart() function, a custom indicator designed to assist traders in identifying trends and making more informed decisions. We will provide an in-depth analysis of the code, exploring its structure, purpose, and functionality.
The code can be divided into two main sections: the stepChart() function definition and its application to charting data. We will first examine the stepChart() function definition, followed by its application.
stepChart() Function Definition
The stepChart() function takes two arguments: a floating-point number 'srcprice' representing the source price and a simple integer 'stepSize' to determine the increment for evaluating trends.
Within the function, five floating-point variables are initialized: steps, trend, rtrend, rbar_high, and rbar_low. These variables will be used to compute the step chart values and store the trends and bar high/low values.
The 'bar_index' variable is employed to identify the current bar in the price chart. If the current bar is the first one (bar_index == 0), the function initializes the steps, rbar_high, rbar_low, trend, and rtrend variables using the source price and step size. If stepSize is greater than 0, the variables are initialized using the rounded value of srcprice divided by stepSize, multiplied by stepSize. Otherwise, they are initialized to srcprice.
In the following part of the function, the code checks if the absolute difference between the source price and the previous steps value is less than the step size. If true, the current steps value remains unchanged. If not, the code enters a while loop that continues incrementing or decrementing the steps value by the step size until the absolute difference between the source price and the steps value is less than or equal to the step size.
Next, the trend variable is calculated based on the relationship between the current steps value and the previous steps value. The rbar_high, rbar_low, and rtrend variables are updated accordingly.
Finally, the function returns a list containing rbar_high, rbar_low, and rtrend values.
Application of the stepChart() Function
In this section, the stepChart() function is applied to the RSX of the smoothed moving average of the closing prices of a financial instrument. The moving average and RSX functions are used to calculate the moving average and RSX, respectively.
The stepChart() function is called with the RSX values and the user-defined step size. The resulting values are stored in the rbar_high, rbar_low, and rtrend variables.
Next, the bar_high, bar_low, bar_close, and bar_open variables are set based on the values of rbar_high, rbar_low, and rtrend. These variables will be used to plot the stepChart() on the price chart. The bar_high variable is set to rbar_high, and the bar_low variable is set to rbar_high if rbar_high is equal to rbar_low, or to rbar_low otherwise. The bar_close variable is set to bar_high if rtrend equals 1, and to bar_low otherwise. Lastly, the bar_open variable is set to bar_low if rtrend equals 1, and to bar_high otherwise.
Finally, we use the built in Pine function plotcandle to plot the candles on the chart.
The stepChart() function is an innovative technical analysis tool designed to help traders identify trends in financial markets. By combining the RSX and moving average indicators and utilizing the step chart approach, this custom indicator provides a visually appealing and intuitive representation of price trends. Understanding the intricacies of this code can prove invaluable for traders looking to make well-informed decisions
Core components of an NNFX algorithmic trading strategy
The NNFX algorithm is built on the principles of trend, momentum, and volatility. There are six core components in the NNFX trading algorithm:
1. Volatility - price volatility; e.g., Average True Range, True Range Double, Close-to-Close, etc.
2. Baseline - a moving average to identify price trend
3. Confirmation 1 - a technical indicator used to identify trends
4. Confirmation 2 - a technical indicator used to identify trends
5. Continuation - a technical indicator used to identify trends
6. Volatility/Volume - a technical indicator used to identify volatility/volume breakouts/breakdown
7. Exit - a technical indicator used to determine when a trend is exhausted
What is Volatility in the NNFX trading system?
In the NNFX (No Nonsense Forex) trading system, ATR (Average True Range) is typically used to measure the volatility of an asset. It is used as a part of the system to help determine the appropriate stop loss and take profit levels for a trade. ATR is calculated by taking the average of the true range values over a specified period.
True range is calculated as the maximum of the following values:
-Current high minus the current low
-Absolute value of the current high minus the previous close
-Absolute value of the current low minus the previous close
ATR is a dynamic indicator that changes with changes in volatility. As volatility increases, the value of ATR increases, and as volatility decreases, the value of ATR decreases. By using ATR in NNFX system, traders can adjust their stop loss and take profit levels according to the volatility of the asset being traded. This helps to ensure that the trade is given enough room to move, while also minimizing potential losses.
Other types of volatility include True Range Double (TRD), Close-to-Close, and Garman-Klass
What is a Baseline indicator?
The baseline is essentially a moving average, and is used to determine the overall direction of the market.
The baseline in the NNFX system is used to filter out trades that are not in line with the long-term trend of the market. The baseline is plotted on the chart along with other indicators, such as the Moving Average (MA), the Relative Strength Index (RSI), and the Average True Range (ATR).
Trades are only taken when the price is in the same direction as the baseline. For example, if the baseline is sloping upwards, only long trades are taken, and if the baseline is sloping downwards, only short trades are taken. This approach helps to ensure that trades are in line with the overall trend of the market, and reduces the risk of entering trades that are likely to fail.
By using a baseline in the NNFX system, traders can have a clear reference point for determining the overall trend of the market, and can make more informed trading decisions. The baseline helps to filter out noise and false signals, and ensures that trades are taken in the direction of the long-term trend.
What is a Confirmation indicator?
Confirmation indicators are technical indicators that are used to confirm the signals generated by primary indicators. Primary indicators are the core indicators used in the NNFX system, such as the Average True Range (ATR), the Moving Average (MA), and the Relative Strength Index (RSI).
The purpose of the confirmation indicators is to reduce false signals and improve the accuracy of the trading system. They are designed to confirm the signals generated by the primary indicators by providing additional information about the strength and direction of the trend.
Some examples of confirmation indicators that may be used in the NNFX system include the Bollinger Bands, the MACD (Moving Average Convergence Divergence), and the MACD Oscillator. These indicators can provide information about the volatility, momentum, and trend strength of the market, and can be used to confirm the signals generated by the primary indicators.
In the NNFX system, confirmation indicators are used in combination with primary indicators and other filters to create a trading system that is robust and reliable. By using multiple indicators to confirm trading signals, the system aims to reduce the risk of false signals and improve the overall profitability of the trades.
What is a Continuation indicator?
In the NNFX (No Nonsense Forex) trading system, a continuation indicator is a technical indicator that is used to confirm a current trend and predict that the trend is likely to continue in the same direction. A continuation indicator is typically used in conjunction with other indicators in the system, such as a baseline indicator, to provide a comprehensive trading strategy.
What is a Volatility/Volume indicator?
Volume indicators, such as the On Balance Volume (OBV), the Chaikin Money Flow (CMF), or the Volume Price Trend (VPT), are used to measure the amount of buying and selling activity in a market. They are based on the trading volume of the market, and can provide information about the strength of the trend. In the NNFX system, volume indicators are used to confirm trading signals generated by the Moving Average and the Relative Strength Index. Volatility indicators include Average Direction Index, Waddah Attar, and Volatility Ratio. In the NNFX trading system, volatility is a proxy for volume and vice versa.
By using volume indicators as confirmation tools, the NNFX trading system aims to reduce the risk of false signals and improve the overall profitability of trades. These indicators can provide additional information about the market that is not captured by the primary indicators, and can help traders to make more informed trading decisions. In addition, volume indicators can be used to identify potential changes in market trends and to confirm the strength of price movements.
What is an Exit indicator?
The exit indicator is used in conjunction with other indicators in the system, such as the Moving Average (MA), the Relative Strength Index (RSI), and the Average True Range (ATR), to provide a comprehensive trading strategy.
The exit indicator in the NNFX system can be any technical indicator that is deemed effective at identifying optimal exit points. Examples of exit indicators that are commonly used include the Parabolic SAR, the Average Directional Index (ADX), and the Chandelier Exit.
The purpose of the exit indicator is to identify when a trend is likely to reverse or when the market conditions have changed, signaling the need to exit a trade. By using an exit indicator, traders can manage their risk and prevent significant losses.
In the NNFX system, the exit indicator is used in conjunction with a stop loss and a take profit order to maximize profits and minimize losses. The stop loss order is used to limit the amount of loss that can be incurred if the trade goes against the trader, while the take profit order is used to lock in profits when the trade is moving in the trader's favor.
Overall, the use of an exit indicator in the NNFX trading system is an important component of a comprehensive trading strategy. It allows traders to manage their risk effectively and improve the profitability of their trades by exiting at the right time.
How does Loxx's GKD (Giga Kaleidoscope Modularized Trading System) implement the NNFX algorithm outlined above?
Loxx's GKD v1.0 system has five types of modules (indicators/strategies). These modules are:
1. GKD-BT - Backtesting module (Volatility, Number 1 in the NNFX algorithm)
2. GKD-B - Baseline module (Baseline and Volatility/Volume, Numbers 1 and 2 in the NNFX algorithm)
3. GKD-C - Confirmation 1/2 and Continuation module (Confirmation 1/2 and Continuation, Numbers 3, 4, and 5 in the NNFX algorithm)
4. GKD-V - Volatility/Volume module (Confirmation 1/2, Number 6 in the NNFX algorithm)
5. GKD-E - Exit module (Exit, Number 7 in the NNFX algorithm)
(additional module types will added in future releases)
Each module interacts with every module by passing data between modules. Data is passed between each module as described below:
GKD-B => GKD-V => GKD-C(1) => GKD-C(2) => GKD-C(Continuation) => GKD-E => GKD-BT
That is, the Baseline indicator passes its data to Volatility/Volume. The Volatility/Volume indicator passes its values to the Confirmation 1 indicator. The Confirmation 1 indicator passes its values to the Confirmation 2 indicator. The Confirmation 2 indicator passes its values to the Continuation indicator. The Continuation indicator passes its values to the Exit indicator, and finally, the Exit indicator passes its values to the Backtest strategy.
This chaining of indicators requires that each module conform to Loxx's GKD protocol, therefore allowing for the testing of every possible combination of technical indicators that make up the six components of the NNFX algorithm.
What does the application of the GKD trading system look like?
Example trading system:
Backtest: Strategy with 1-3 take profits, trailing stop loss, multiple types of PnL volatility, and 2 backtesting styles
Baseline: Hull Moving Average
Volatility/Volume: Hurst Exponent
Confirmation 1: Step Chart of RSX of Averages as shown on the chart above
Confirmation 2: Williams Percent Range
Continuation: Fisher Transform
Exit: Rex Oscillator
Each GKD indicator is denoted with a module identifier of either: GKD-BT, GKD-B, GKD-C, GKD-V, or GKD-E. This allows traders to understand to which module each indicator belongs and where each indicator fits into the GKD protocol chain.
Giga Kaleidoscope Modularized Trading System Signals (based on the NNFX algorithm)
Standard Entry
1. GKD-C Confirmation 1 Signal
2. GKD-B Baseline agrees
3. Price is within a range of 0.2x Volatility and 1.0x Volatility of the Goldie Locks Mean
4. GKD-C Confirmation 2 agrees
5. GKD-V Volatility/Volume agrees
Baseline Entry
1. GKD-B Baseline signal
2. GKD-C Confirmation 1 agrees
3. Price is within a range of 0.2x Volatility and 1.0x Volatility of the Goldie Locks Mean
4. GKD-C Confirmation 2 agrees
5. GKD-V Volatility/Volume agrees
6. GKD-C Confirmation 1 signal was less than 7 candles prior
Volatility/Volume Entry
1. GKD-V Volatility/Volume signal
2. GKD-C Confirmation 1 agrees
3. Price is within a range of 0.2x Volatility and 1.0x Volatility of the Goldie Locks Mean
4. GKD-C Confirmation 2 agrees
5. GKD-B Baseline agrees
6. GKD-C Confirmation 1 signal was less than 7 candles prior
Continuation Entry
1. Standard Entry, Baseline Entry, or Pullback; entry triggered previously
2. GKD-B Baseline hasn't crossed since entry signal trigger
3. GKD-C Confirmation Continuation Indicator signals
4. GKD-C Confirmation 1 agrees
5. GKD-B Baseline agrees
6. GKD-C Confirmation 2 agrees
1-Candle Rule Standard Entry
1. GKD-C Confirmation 1 signal
2. GKD-B Baseline agrees
3. Price is within a range of 0.2x Volatility and 1.0x Volatility of the Goldie Locks Mean
Next Candle:
1. Price retraced (Long: close < close or Short: close > close )
2. GKD-B Baseline agrees
3. GKD-C Confirmation 1 agrees
4. GKD-C Confirmation 2 agrees
5. GKD-V Volatility/Volume agrees
1-Candle Rule Baseline Entry
1. GKD-B Baseline signal
2. GKD-C Confirmation 1 agrees
3. Price is within a range of 0.2x Volatility and 1.0x Volatility of the Goldie Locks Mean
4. GKD-C Confirmation 1 signal was less than 7 candles prior
Next Candle:
1. Price retraced (Long: close < close or Short: close > close )
2. GKD-B Baseline agrees
3. GKD-C Confirmation 1 agrees
4. GKD-C Confirmation 2 agrees
5. GKD-V Volatility/Volume Agrees
1-Candle Rule Volatility/Volume Entry
1. GKD-V Volatility/Volume signal
2. GKD-C Confirmation 1 agrees
3. Price is within a range of 0.2x Volatility and 1.0x Volatility of the Goldie Locks Mean
4. GKD-C Confirmation 1 signal was less than 7 candles prior
Next Candle:
1. Price retraced (Long: close < close or Short: close > close)
2. GKD-B Volatility/Volume agrees
3. GKD-C Confirmation 1 agrees
4. GKD-C Confirmation 2 agrees
5. GKD-B Baseline agrees
PullBack Entry
1. GKD-B Baseline signal
2. GKD-C Confirmation 1 agrees
3. Price is beyond 1.0x Volatility of Baseline
Next Candle:
1. Price is within a range of 0.2x Volatility and 1.0x Volatility of the Goldie Locks Mean
2. GKD-C Confirmation 1 agrees
3. GKD-C Confirmation 2 agrees
4. GKD-V Volatility/Volume Agrees
]█ Setting up the GKD
The GKD system involves chaining indicators together. These are the steps to set this up.
Use a GKD-C indicator alone on a chart
1. Inside the GKD-C indicator, change the "Confirmation Type" setting to "Solo Confirmation Simple"
Use a GKD-V indicator alone on a chart
**nothing, it's already useable on the chart without any settings changes
Use a GKD-B indicator alone on a chart
**nothing, it's already useable on the chart without any settings changes
Baseline (Baseline, Backtest)
1. Import the GKD-B Baseline into the GKD-BT Backtest: "Input into Volatility/Volume or Backtest (Baseline testing)"
2. Inside the GKD-BT Backtest, change the setting "Backtest Special" to "Baseline"
Volatility/Volume (Volatility/Volume, Backte st)
1. Inside the GKD-V indicator, change the "Testing Type" setting to "Solo"
2. Inside the GKD-V indicator, change the "Signal Type" setting to "Crossing" (neither traditional nor both can be backtested)
3. Import the GKD-V indicator into the GKD-BT Backtest: "Input into C1 or Backtest"
4. Inside the GKD-BT Backtest, change the setting "Backtest Special" to "Volatility/Volume"
5. Inside the GKD-BT Backtest, a) change the setting "Backtest Type" to "Trading" if using a directional GKD-V indicator; or, b) change the setting "Backtest Type" to "Full" if using a directional or non-directional GKD-V indicator (non-directional GKD-V can only test Longs and Shorts separately)
6. If "Backtest Type" is set to "Full": Inside the GKD-BT Backtest, change the setting "Backtest Side" to "Long" or "Short
7. If "Backtest Type" is set to "Full": To allow the system to open multiple orders at one time so you test all Longs or Shorts, open the GKD-BT Backtest, click the tab "Properties" and then insert a value of something like 10 orders into the "Pyramiding" settings. This will allow 10 orders to be opened at one time which should be enough to catch all possible Longs or Shorts.
Solo Confirmation Simple (Confirmation, Backtest)
1. Inside the GKD-C indicator, change the "Confirmation Type" setting to "Solo Confirmation Simple"
1. Import the GKD-C indicator into the GKD-BT Backtest: "Input into Backtest"
2. Inside the GKD-BT Backtest, change the setting "Backtest Special" to "Solo Confirmation Simple"
Solo Confirmation Complex without Exits (Baseline, Volatility/Volume, Confirmation, Backtest)
1. Inside the GKD-V indicator, change the "Testing Type" setting to "Chained"
2. Import the GKD-B Baseline into the GKD-V indicator: "Input into Volatility/Volume or Backtest (Baseline testing)"
3. Inside the GKD-C indicator, change the "Confirmation Type" setting to "Solo Confirmation Complex"
4. Import the GKD-V indicator into the GKD-C indicator: "Input into C1 or Backtest"
5. Inside the GKD-BT Backtest, change the setting "Backtest Special" to "GKD Full wo/ Exits"
6. Import the GKD-C into the GKD-BT Backtest: "Input into Exit or Backtest"
Solo Confirmation Complex with Exits (Baseline, Volatility/Volume, Confirmation, Exit, Backtest)
1. Inside the GKD-V indicator, change the "Testing Type" setting to "Chained"
2. Import the GKD-B Baseline into the GKD-V indicator: "Input into Volatility/Volume or Backtest (Baseline testing)"
3. Inside the GKD-C indicator, change the "Confirmation Type" setting to "Solo Confirmation Complex"
4. Import the GKD-V indicator into the GKD-C indicator: "Input into C1 or Backtest"
5. Import the GKD-C indicator into the GKD-E indicator: "Input into Exit"
6. Inside the GKD-BT Backtest, change the setting "Backtest Special" to "GKD Full w/ Exits"
7. Import the GKD-E into the GKD-BT Backtest: "Input into Backtest"
Full GKD without Exits (Baseline, Volatility/Volume, Confirmation 1, Confirmation 2, Continuation, Backtest)
1. Inside the GKD-V indicator, change the "Testing Type" setting to "Chained"
2. Import the GKD-B Baseline into the GKD-V indicator: "Input into Volatility/Volume or Backtest (Baseline testing)"
3. Inside the GKD-C 1 indicator, change the "Confirmation Type" setting to "Confirmation 1"
4. Import the GKD-V indicator into the GKD-C 1 indicator: "Input into C1 or Backtest"
5. Inside the GKD-C 2 indicator, change the "Confirmation Type" setting to "Confirmation 2"
6. Import the GKD-C 1 indicator into the GKD-C 2 indicator: "Input into C2"
7. Inside the GKD-C Continuation indicator, change the "Confirmation Type" setting to "Continuation"
8. Inside the GKD-BT Backtest, change the setting "Backtest Special" to "GKD Full wo/ Exits"
9. Import the GKD-E into the GKD-BT Backtest: "Input into Exit or Backtest"
Full GKD with Exits (Baseline, Volatility/Volume, Confirmation 1, Confirmation 2, Continuation, Exit, Backtest)
1. Inside the GKD-V indicator, change the "Testing Type" setting to "Chained"
2. Import the GKD-B Baseline into the GKD-V indicator: "Input into Volatility/Volume or Backtest (Baseline testing)"
3. Inside the GKD-C 1 indicator, change the "Confirmation Type" setting to "Confirmation 1"
4. Import the GKD-V indicator into the GKD-C 1 indicator: "Input into C1 or Backtest"
5. Inside the GKD-C 2 indicator, change the "Confirmation Type" setting to "Confirmation 2"
6. Import the GKD-C 1 indicator into the GKD-C 2 indicator: "Input into C2"
7. Inside the GKD-C Continuation indicator, change the "Confirmation Type" setting to "Continuation"
8. Import the GKD-C Continuation indicator into the GKD-E indicator: "Input into Exit"
9. Inside the GKD-BT Backtest, change the setting "Backtest Special" to "GKD Full w/ Exits"
10. Import the GKD-E into the GKD-BT Backtest: "Input into Backtest"
Baseline + Volatility/Volume (Baseline, Volatility/Volume, Backtest)
1. Inside the GKD-V indicator, change the "Testing Type" setting to "Baseline + Volatility/Volume"
2. Inside the GKD-V indicator, make sure the "Signal Type" setting is set to "Traditional"
3. Import the GKD-B Baseline into the GKD-V indicator: "Input into Volatility/Volume or Backtest (Baseline testing)"
4. Inside the GKD-BT Backtest, change the setting "Backtest Special" to "Baseline + Volatility/Volume"
5. Import the GKD-V into the GKD-BT Backtest: "Input into C1 or Backtest"
6. Inside the GKD-BT Backtest, change the setting "Backtest Type" to "Full". For this backtest, you must test Longs and Shorts separately
7. To allow the system to open multiple orders at one time so you can test all Longs or Shorts, open the GKD-BT Backtest, click the tab "Properties" and then insert a value of something like 10 orders into the "Pyramiding" settings. This will allow 10 orders to be opened at one time which should be enough to catch all possible Longs or Shorts.
Requirements
Inputs
Confirmation 1: GKD-V Volatility / Volume indicator
Confirmation 2: GKD-C Confirmation indicator
Continuation: GKD-C Confirmation indicator
Solo Confirmation Simple: GKD-B Baseline
Solo Confirmation Complex: GKD-V Volatility / Volume indicator
Solo Confirmation Super Complex: GKD-V Volatility / Volume indicator
Stacked 1: None
Stacked 2+: GKD-C, GKD-V, or GKD-B Stacked 1
Outputs
Confirmation 1: GKD-C Confirmation 2 indicator
Confirmation 2: GKD-C Continuation indicator
Continuation: GKD-E Exit indicator
Solo Confirmation Simple: GKD-BT Backtest
Solo Confirmation Complex: GKD-BT Backtest or GKD-E Exit indicator
Solo Confirmation Super Complex: GKD-C Continuation indicator
Stacked 1: GKD-C, GKD-V, or GKD-B Stacked 2+
Stacked 2+: GKD-C, GKD-V, or GKD-B Stacked 2+ or GKD-BT Backtest
Additional features will be added in future releases.
50% candlestick closeThis indicator is useful at important level, when you want to see some bullish or bearish signs in candlestick.
At your important support level you can buy, if candlestick close is above 50% of its range, with low of this candlestick as SL.
At your important resistance level you can sell, if candlestick close is below 50% of its range, with high of this candlestick as SL.

Candle and BG Trend IdentifierThis indicator simply changes the background and color of candle based on the previous candle's close. If a candle closes high than the previous candle's high it will be indicated via green coloring. If a candle closes lower than the previous candle's low it will be indicated in red coloring. Additionally, grey colored candles appear when neither occur - often signifying consolidation.
These candles can be used to identify previous small lasting and long ranging trends. Areas that are heavily saturated with one specific color will likely indicate a trend.
If you are not able to see the colored candles, disable your main candle overlay in the top left by clicking on the eye icon.
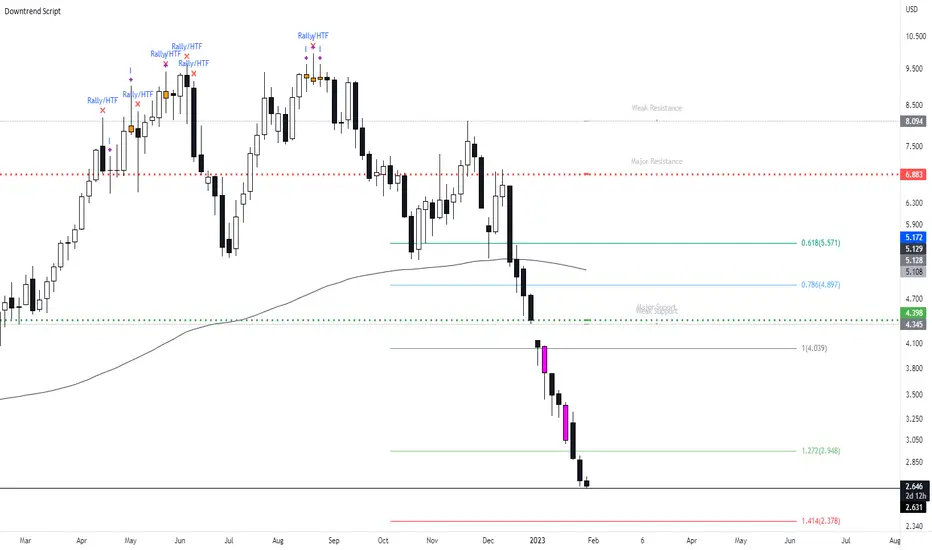
New Bearish Downtrend Script - Perfect for Short SellingIts been a while since i last uploaded a script, what i have for you today is a script which works very efficiently for downtrends and spotting reversals. This is a script i use on a weekly basis when looking to short sell.
This script includes :
Updated** Rally Candles for HTF and LTF ( End of Impulsive move signal) - The psychology of the candle when used with market information can be viewed as a end or near to the end of a big impulsive leg - when this candle occurs in BEARISH CONDITIONS, we can assume price is likely to move away short term.
Major and Minor Support Levels HTF (Areas of interest)
The Psychology on these levels is price will do something at these key levels - it takes in the last quarter price action of High Open Low Close to generate the price levels and when price comes into these areas we are likely to see a bounce or rejection from this area.
Bearish Breakout Volume Candle - This candle will paint a Purple colour bar when volume breaks above the 7day average - this shows strong momentum in the market and will usually be seen when price is in a downtrend with strong momentum.. However when this does occur we can expect a short term bounce or base so don't trade the volume bar alone.
Indecision Candles - Psychology of this candle is to show exhaustion in the trend and ideally what to see this candle appear with Rally Candles at key areas for stronger set up. When the trend is moving up, the bearish doji can appear - i tend to look at this situation as a pause in the trend.
200 EMA
Everything in this script has alert conditions to provide an edge in the markets
This is an example of how the script will look on the HTF I'm using the Daily Timeframe for reference on TSLA
This is an example of how the script looks like on the LTF, price hit the Major Resistance twice and failed to hit the 3rd time and on each leg of the impulse, the chart portrayed the LTF Rally Candles
Heres an example on how to use both Major Resistance ( Area of Interest) Rally Candle and Volume Breakout as a trade set up idea - This setup idea was on Crude Oil last week and into this week.
When added to confluences such as Supply Zones, Mitigation Levels, Quasimodo patterns etc... this will enhance the script.
I will answer any questions if i haven't made the script clear or take any requests to improve the script.
Also will be uploading the Bullish Uptrend Script soon.
Higher Timeframe Price Action ScannerThis is a higher timeframe scanner that detects the price action trend on multiple timeframes and displays them all as red or green dots. You’ll be able to see the real time and historical price action trends so you can trade in the same direction of the overall trend on higher timeframes. You can also set it to scan a different ticker if you choose. If you find pairs that correlate very well, you can use two scanners and look at both of them for extra trend confluence.
CALCULATIONS
This scanner uses the same price action formula from our other indicator titled 1 Minute Scalping Indicator which can be found on our profile. It has Scalp Mode and Swing Mode. Both modes use the exact same price action parameters for signals, but Swing Mode will only give signals when the price action parameters are met AND the close is higher than the previous high for bull signals or when the close is lower than the previous low for bear signals.
HOW TO USE
The top line of the scanner shows the price action trend for the current chart timeframe and the rest are using the higher timeframe that you set in the input settings. They start with higher timeframe #1 as the second line from the top and go down from there.
When most or all of the dots are green, you should be looking for long positions and when most or all of the dots are red, you should be looking for short positions.
Since this scanner is using pure price action to identify trends, it’s a reliable way to see what multiple timeframes are doing.
PAIRINGS
Use this with the 1 Minute Scalping Indicator so you can get the signals and candles colored per the price action on your chart as well as see the higher timeframe price action trend from the scanner. Using both together will help you make better trading decisions.
MARKETS
You can use this scanner on any market.
TIMEFRAMES
This scanner will scan the current chart timeframe and display the result on the top line, then the lines below that will display the results from the higher timeframes you choose in the settings. It has timeframes from 1 minute all the way up to 1 year.

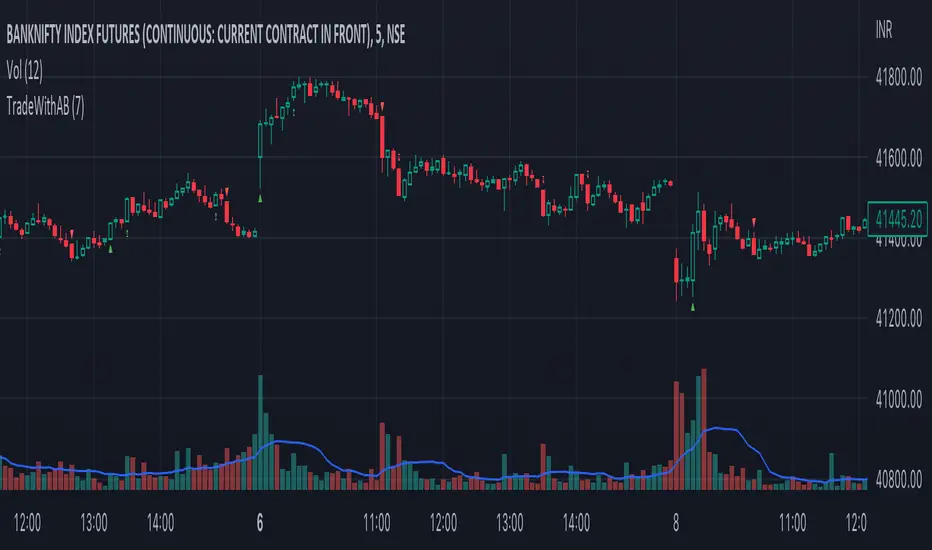
TradeWithAB SignalsThis indicator specifically designed for Momentum trading by an Intraday trader on index( Nifty , BankNifty ) and Equity stocks. This indicator works with DMI and PRICE ACTIONS which gives automated Buy and Sell signals along with Stop loss and Trailing Stop loss when certain criteria are met. It is not a Holy Grail system that gives you continuous profits and it has some limited downfalls also which can be controlled by proper risk Management and position sizing. This is a premium invite only indicator which can be use after given access to you by us. There are some guidelines on how to use this indicator which are given below and you have to follow these guidelines very strictly to get the maximum results.
Guidelines :-
1. Default Timeframe - 5 min
2. You have to take almost all the trade generated by this indicator on a particular stock/index for better results.
3. Signal confirmation is required for enter the trade as it will give you maximum profits.
4. GREEN TRIANGLE is represented as BUY Signal whereas RED TRIANGLE is represented as SELL Signal.
5. GREEN ARROW is considered as BUY TRAILING STOP LOSS as well as BUY RE-ENTRY for some scenarios.
6. RED ARROW is considered as SELL TRAILING STOP LOSS and SELL RE-ENTRY for some scenarios.
7. Ignore the signals(if any) of 1st candle(9:15)and last candle(3:25)of the day for better results.
BUY Trade Management :-
1. Trade should be initiated if and only if there is a buy signal(Green Triangle) is generated.
2. You should only enter the trade at the CLOSE of the signal generated candle.
3. Your Stop loss should be placed at the LOW of the signal generated candle.
4. There is a trailing Stop loss signal (Green Arrow) after the buying signal is generated.
5. You should trail your Stop loss at the LOW of the trailing Stop loss signal generated candle.
6. You should trail your Stop loss repeatedly until your trailing Stop loss got hit and hence Exit your buy trade.
7. After Exiting the trade you always have option to re-enter at the next trailing Stop loss signal(green arrow) generated candle CLOSE and put your Stop loss at LOW of that candle and repeat the same trailing stop loss procedures.
SELL Trade Management :-
1. Trade should be initiated if and only if there is a sell signal(Red Triangle) is generated.
2. You should only enter the trade at the CLOSE of the signal generated candle.
3. Your Stop loss should be placed at the HIGH of the signal generated candle.
4. There is a trailing Stop loss signal (Red Arrow) after the selling signal is generated.
5. You should trail your Stop loss at the HIGH of the trailing Stop loss signal generated candle.
6. You should trail your Stop loss repeatedly until your trailing Stop loss got hit and hence Exit your sell trade.
7. After Exiting the trade you have always option to re-enter at the next trailing Stop loss signal(red arrow) generated candle CLOSE and put your Stop loss at HIGH of that candle and repeat the same trailing stop loss procedures.
Disclaimer :-
*I am not a SEBI Registered Analyst and shall not be liable for any profit, loss or liability resulting, directly or indirectly from the use and results of the indicator. This is not a Holy Grail setup, sometimes the traders hit Stop loss and sometimes it gives amazing results as well.
Instructions to access to this invite-only script:-
*Send us a message if you wish to gain access to this indicator. The subscribers will get benefits of any future development or updates in the current script without any extra charges. Other trading style like swing and positional trading will also available in future updates.
Pro Trading Art - Candlestick Patterns with alertAll candlestick pattern based on "Japanese candlestick charting techniques".
Currently Supported List of Candlestick Patterns :
Hammer
Hanging Man
Inverted Hammer
Shooting Star
Morning Star
Evening Star
Bullish Engulfing
Bearish Engulfing
Important Points:
1. You can create alert for all patterns.
2. You can modify multiplier(Length Of Shadow) for Hammer, Hanging Man, Inverted Hammer and Shooting Star
3. You can modify EMA length for upward and downward validation of any pattern.

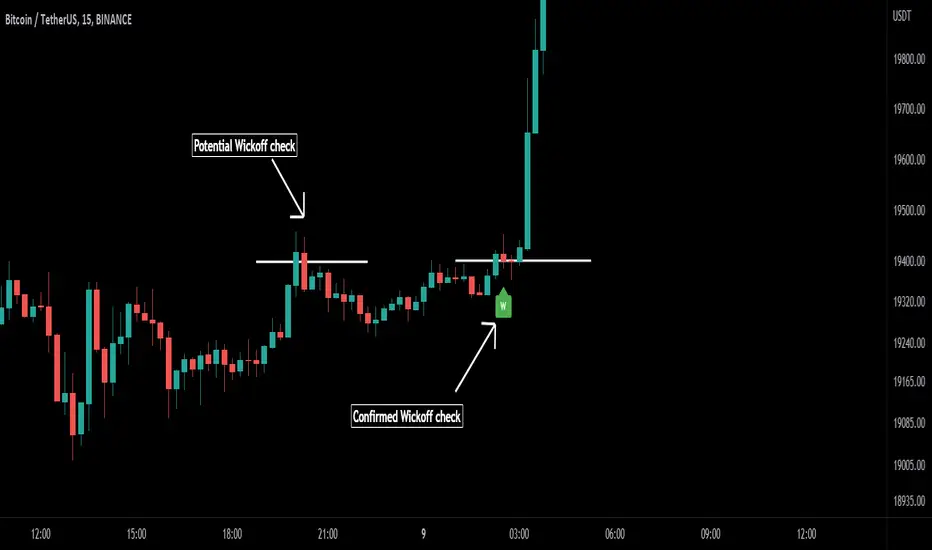
Wick-off Check Pattern [Misu]█ This Indicator shows a wick-off check pattern.
This pattern appears when a candle goes below a level (support or resistance) and closes above it OR when it goes above a level and finishes below it. This causes a wick to go through the level: a wick-off check .
This can confirm a pullback or a breakout.
█ Usages:
This indicator can be used to validate a resistance or support level.
It can also be used to validate breaking levels.
█ Parameters:
Deviation: Parameter used to calculate pivots.
Depth: Parameter used to calculate pivots.
Wickoff Mode: Mode used to detect Wickoff check pattern.
> counter pattern: only shows "pullback" wickoff check.
> breakout pattern: only shows "breakout moves" wickoff check.
> both: shows both.
Lenght Avg Body: Lenght used to calculate the average body size.
First Breakout Factor:
Lenght Avg Wick Validation: This factor multiplied by the "body avg" filters out the non-significant breakout.
Factor Avg Wick Validation: Lenght used to calculate the average wick size.
Max Bars Wickoff: This factor multiplied by the "wick avg", filters out the non-significant wickoff signals.