Range Volatility Oscillator [Session Adjusted]Description
This open-source indicator calculates a volatility oscillator based purely on price range expansion/contraction (High − Low), making it especially suitable for instruments with well-defined trading sessions (FTSEMIB, DAX, ES, NQ, forex majors during London/NY overlap, etc.).
Instead of using price returns or close-based volatility, it compares short-term and long-term simple moving averages of the daily range, then expresses the relative difference as a percentage oscillator — similar in spirit to a MACD-style momentum readout, but applied to volatility itself.
Core Concept
Fast SMA(range, fast × candles_per_session)
Slow SMA(range, slow × candles_per_session)
Oscillator = 100 × (Fast / Slow − 1)
Positive values → recent ranges are expanding compared to the longer-term average (rising volatility / potential trend acceleration or breakout environment).
Negative values → ranges are contracting (falling volatility / potential consolidation or mean-reversion setup).
Zero line acts as the neutral pivot between expanding vs contracting regimes.
Key Features
- Session-aware calculation — user inputs session duration (default 6.5 h) → automatically estimates how many candles = 1 trading day on the current timeframe
- Works on any timeframe (1 min → daily), including irregular ones
- Optional signal line (SMA of the oscillator) for smoother readings and crossover strategies
- Clean, minimalistic plot with customizable colors
- Zero line always visible (dotted)
Typical Usage Ideas
- Rising oscillator + above zero → increasing volatility → favor momentum / breakout / trend-following strategies
- Falling oscillator / below zero → decreasing volatility → consider mean-reversion, tightening stops, or waiting for compression → expansion setups
- Signal line crossovers — fast line crossing above signal = short-term volatility pickup, crossing below = volatility cooling
- Divergences between price and the oscillator can sometimes highlight weakening trends (classic volatility divergence)
Combine with trend filters (EMA, VWAP, SuperTrend), support/resistance or volume for higher-probability setups.
Recommended Starting Settings
Session Duration: 6.5–8.5 hours (adjust to your market — e.g. 8.5 for many European indices, 6.5 for US regular session).
Fast SMA Length: 5 days
Slow SMA Length: 15 days
Signal-line Length: 3 days (if enabled)
Best results usually appear on intraday timeframes (3 min – 30 min) and on instruments with clear session boundaries and meaningful daily ranges.
Notes / Limitations
- Pure range-based → ignores gaps, overnight moves and volume
- Not normalized to ATR or percentage of price → readings are relative within each instrument
- Very low-liquidity / very small-range instruments may produce noisy output
Released under open source — feel free to modify, combine with other logic or use in strategies.
Feedback and improvements are welcome!
تقلب شايكن

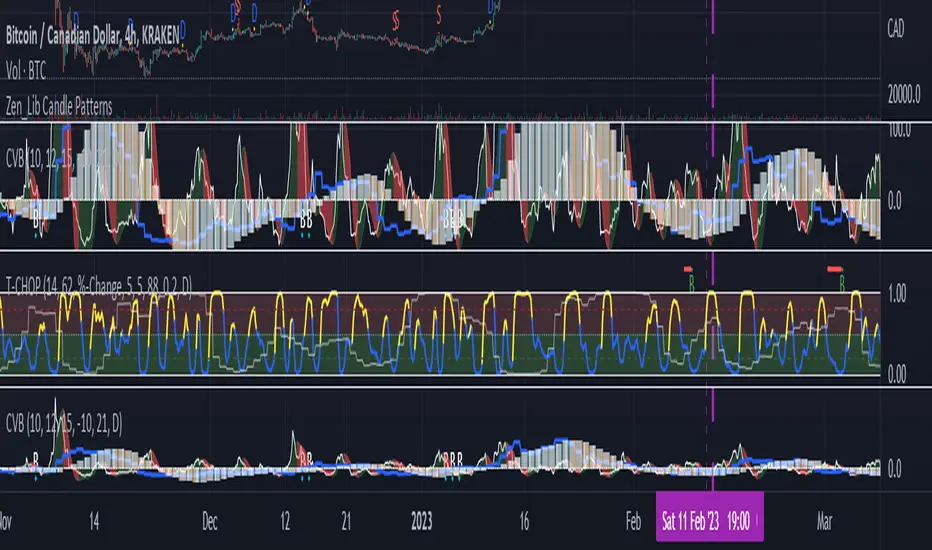
JZ_Chaikin HTF Volatility BreakoutFirst off, all credit to Harry Potter as this is a minor customization of his indicator.
Basic additions:
-- Added a Higher Timeframe that is set to Daily but can be changed. Timeframe does wait until barstate.isconfirmed so won't repaint.
-- Added HMA smoothing line to both Chart and HTF. Can be used as it's own signal, as confirmation or in combination with faster signal line -- Breakout signal & Range Highlight use both.
-- Added optional coloring of HMA based on whether increasing or decreasing.
-- Added a low volatility option that highlights Range/No Trade zones. Defval is off so needs to be selected from inputs.
Breakout Signals are very simple and both take the HTF signal and HMA. When the faster Volatility line rises from below zero and comes within the range of -10 to 0, AND the HMA signals is increasing (and also below zero) for confirmation, generates a breakout signal of an incoming big move. You can alter the breakout threshold to be greater or less than -10, I just found that works best for filtering out the noise and false signals. Won't catch everything, but pretty reliable when it does.
Tested mostly on BTC so can't vouch for other assets and would likely need modification.
I've JUST taught myself coding from scratch (and to say I'm an amateur is an understatement), so apologies in advance if anything is unclear or could be coded better. Open to any suggestions.
Chaikin Volatility Strategy With Negative Trigger AllowedSame like Chaikin Volatility Strategy, but allows negative value of Trigger

Chaikin Volatility Strategy Backtest Chaikin's Volatility indicator compares the spread between a security's
high and low prices. It quantifies volatility as a widening of the range
between the high and the low price.
You can use in the xPrice1 and xPrice2 any series: Open, High, Low, Close, HL2,
HLC3, OHLC4 and ect...
You can change long to short in the Input Settings
Please, use it only for learning or paper trading. Do not for real trading.

Chaikin Volatility StrategyChaikin's Volatility indicator compares the spread between a security's
high and low prices. It quantifies volatility as a widening of the range
between the high and the low price.
You can use in the xPrice1 and xPrice2 any series: Open, High, Low, Close, HL2,
HLC3, OHLC4 and ect...

Chaikin Volatility Chaikin's Volatility indicator compares the spread between a security's
high and low prices. It quantifies volatility as a widening of the range
between the high and the low price.
You can use in the xPrice1 and xPrice2 any series: Open, High, Low, Close, HL2,
HLC3, OHLC4 and ect...
