Double SupertrendThis strategy is based on a custom indicator that was created based on the Supertrend indicator. At its core, there are always 2 super trend indicators with different factors to reduce market noise (false signals).
The strategy/indicator has some parameters to improve the signals and filters.
TECHNICAL ANALYSIS
☑ Show Indicators
This option will enable/disable the Supertrend indicators on the chart.
☑ Length
The length will be used on the Supertrend Indicator to calculate its values.
☑ Dev Fast
The fast deviation or factor from one of the super trend indicators. This will be the leading indicator for entry signals, as well as for the exit signals.
☑ Dev Slow
The slow deviation or factor from one of the super trend indicators. This will be the confirmation indicator for entry and exit signals.
☑ Exit Type
It's possible to select from 4 options for the exit signals. Exit signals always take profit target.
☑ ⥹ Reversals
This option will make the strategy/indicator calculate the exit signals based on the difference between the given period's highest and lowest candle value (see Period on this list). It's displayed on the chart with the cross. As it's possible to verify in the image below, there are multiple exit spots for every entry.
☑ ⥹ ATR
Using ATR as a base indicator for exit signals will make the strategy/indicator place limit/stop orders. Candle High + ATR for longs, Candle Low - ATR for shorts. The strategy will show the ATR level for take profit and stick with it until the next signal. This way, the take profit value remains based on the candle of the entry signal.
☑ ⥹ Fast Supertrend
With this option selected, the exit signals will be based on the Fast Supertsignal value, mirrored to make a profit.
☑ ⥹ Slow Supertrend
With this option selected, the exit signals will be based on the Slow Supertsignal value, which is mirrored to take profit.
☑ Period
This will represent the number of candles used on the exit signals when Reversals is selected as Exit Type. It's also used to calculate the gradient used on the Fills and Supertrend signals.
☑ Multiplier
It's used on the take profit when the ATR option is selected on the Exit Type.
STRATEGY
☑ Use The Strategy
This will enable/disable the strategy to show the trades calculations.
☑ Show Use Long/Short Entries
Option to make the strategy show/use Long or Short signals. Available only if Use The Strategy is enabled
☑ Show Use Exit Long/Short
Option to make the strategy show/use Exit Long or Short signals (valid when Reversals option is selected on the Exit Type). Available only if Use The Strategy is enabled
☑ Show Use Add Long/Short
Option to make the strategy show/use Add Long or Short signals. With this option enabled, the strategy will place multiple trades in the same direction, almost the same concept as a pyramiding parameter. It's based on the Fast Supersignal when the candle fails to cross and reverses. Available only if Use The Strategy is enabled
☑ Trades Date Start/End
The date range that the strategy will check the market data and make the trades
HOW TO USE
It's very straightforward. A long signal will appear as a green arrow with a text Long below it. A short signal will appear as a red arrow with a text Short above it. It's ideal to wait for the candle to finish to validate the signal.
The exit signals are optional but give a good idea of the configuration used when backtesting. Each market and timeframe will have its own configuration for the best results. On average, sticking to ATR as an exit signal will have less risk than the other options.
☑ Entry Signals
Follow the arrows with Long/Short texts on them. Wait for the signal candle to close to validate the entry.
☑ Exit Signals
Use them to close your position or to trail stop your orders and maximize profits. Select the exit type suitable for each timeframe and market
☑ Add Entries
It's possible to increase the position following the add margin/contracts based on the Add signals. Not mandatory, but may work as reentries or late entries using the same signal.
☑ What about Stop Loss?
The stop-loss levels were not included as a separated signal because it's already in the chart. There are some possible ideas for the stop loss:
☑⥹ Candle High/Low (2nd recommend option)
When it's a Long signal from the entry signal candle, the stop loss can be the Low value of the same candle. Very tight stop loss in some cases, depending on the candle range
☑⥹ Local Top/Bottom
Selecting the local top/bottom as stop loss will give the strategy more room for false breakouts or reversals, keeping the trade open and minimizing noises. Increases the risk
☑⥹ Fast Supertrend (1st recommend option)
The fast supertrend can be used as stop-loss as well. making it a moving level and working close to trail stop management
☑⥹ Fixed Percentage
It's possible to use a fixed risk percentage for the trades, making the risk easier to control and project. Since the market volatility is not fixed, this may affect the accuracy of the trades
☑⥹ Based on the ATR (3rd recommend option)
When the exit type option ATR is selected, it will display the take profit level for that entry. Just mirror that value and put it as stop-loss, or multiply that amount by 1.5 to have more room for market noise.
EXAMPLE CONFIGURATIONS
Here are some configuration ideas for some markets (all of them are from crypto, especially futures markets)
BTCUSDT 15min - Default configuration
BTCUSDT 1h - Length 10 | Dev Fast 3 | Dev Slow 4 | Exit Type ATR | Period 50 | Multiplier 1
BTCUSDT 4h - Length 10 | Dev Fast 2 | Dev Slow 4 | Exit Type ATR | Period 50 | Multiplier 1
ETHUSDT 15min - Length 20 | Dev Fast 1 | Dev Slow 3 | Exit Type Fast Supertrend | Period 50 | Multiplier 1
IOTAUSDT 15min - Length 10 | Dev Fast 1 | Dev Slow 2 | Exit Type Slow Supertrend | Period 50 | Multiplier 1
OMGUSDT 15min - Length 10 | Dev Fast 1 | Dev Slow 4 | Exit Type Slow Supertrend | Period 50 | Multiplier 1
VETUSDT 15min - Length 10 | Dev Fast 3 | Dev Slow 4 | Exit Type Slow Supertrend | Period 50 | Multiplier 1
HOW TO FIND OTHER CONFIGURATIONS
Here are some steps to find suitable configurations
select a market and time frame
enable the Use This Strategy option on the strategy
open the strategy tester panel and select the performance summary
open the strategy configuration and go to properties
change the balance to the same price of the symbol (example: BTCUSDT 60.000, use 60.000 as balance)
go back to the inputs tab and keep changing the parameters until you see the net profit be positive and bigger than the absolute value of the drawdown
in case you can't find a suitable configuration, try other timeframes
Since the tester reflects what happened in the past candles, it's not guaranteed to give the same results. However, this indicator/Strategy can be used with other indicators as a leading signal or confirmation signal.
العملات الرقمية

Profit Maxima: a crypto strategyThis strategy is designed for those who are looking for long-term positions with low risk and high profitability.
How does it work?
In short, the basis of this strategy is the frequent modeling of the price using regression equations and the estimation of the range of price movements.
The price modeling process starts from the first bars and will be repeated on each bar. This process is performed in each candle based on the data available up to that candle, and data for subsequent bars is not used.
There is also no fixed price model, but it will change from one candle to the next; Therefore, the more candles there are, the larger the statistical population and therefore the quality of the price model increases.
I have also used the concept of scarcity. Bitcoin is the first scarce digital object in the world. Once something becomes scarce enough, it can be used as money. This scarcity gradually increases and affects the price. The entire crypto market also follows Bitcoin.
However, always remember that past results in no way guarantee future performance.
Why this strategy generates a small number of trades?
Preston Pysh believed Bitcoin cycles happen in three phases: the Bull Run, the Correction, and the Reversion to the Mean. He estimates there are about 200,000 blocks per cycle and there are about 144 blocks per day.
Therefore, each cycle of Bitcoin lasts about four years. The entire crypto market follows bitcoin. On the other hand, cryptocurrency is a new phenomenon. They have a limited price history.
This strategy is designed to open a long position at the lowest possible price. In addition, due to the concept of scarcity and its continued impact on prices, trading in the “short” direction is avoided.
The combination of these factors leads to generate a small number of trades. However, you can test it on several different charts to make sure it works properly.
Default settings
{ default_qty_type } = strategy.percent_of_equity
{ default_qty_value } = 3.3
{ commission_value } = 0.1
{ pyramiding } = 3
{ close_entries_rule } = "ANY"
In a simple word, buy (Entry) and sell (take-profit) orders are each done at three different levels. At each level, 3.3% of equity is used (9.9% in total)
0.1% commission is considered for each transaction.
“close_entries_rule” determines the order in which orders are closed. The default is FIFO (first in, first out), but in this strategy, orders are executed in “first in, last out” order. In this way, the lowest buy (Entry) order corresponds to the lowest sell (take profit) order.
Choose the best chart
Charts have a significant impact on the performance of the strategy. As mentioned, the more historical bars there are, the larger the statistical population and therefore the quality of the price model increases.
You can use the Chart Quality panel to choose the appropriate chart:
The ‘Historical Bars’ field shows the number of candles in the chart. Choose the chart of an exchange that has the most historical bars.
The ‘Recommended Chart’ field shows the suggested chart for some symbols.
The “Predictability” field indicates to what extent price movements can be predicted using the model; the higher the “predictability”, the more credible the results of the strategy. "Predictability" indicates that the results of the strategy are reliable or not.
The image below shows the recommended chart for 20 different symbols:
How to use
You don't need automated trading platforms to use it. It can be used by placing simple buy and sell (take-profit) orders manually.
The green and red lines indicate the 'Entry' and 'Profit' levels respectively. If there is no order (buy / sell) active on one of these levels, it will be displayed in gray. The corresponding values are displayed in the Entry & Profit Limits table.
After choosing the appropriate chart, you can use this table to place your orders manually.
Note that trading in the "short" direction is not recommended at all.
Samples

WaveTecs StrategyWelcome to the Backtesting version of "WaveTecs Strategy", the indicator itself is an invite-only script called "WaveTecs Indicator" on TradingView.
WaveTecs Strategy
WaveTecs is a Strategy that combines Wave Trend Oscillator and verifies wave momentum by using RSI and Stochastic Oscillator Values.
What is Wave Trend?
One of the most effective indicators in identifying swings is the Wave Trend indicator. Wave Trend plots waves using highs and lows between an upper band and a lower band. It looks for the opening and closing of a new wave trend movement as well as overbought and oversold areas.
How does this modified strategy work?
By using RSI and Stochastic values we are able to verify Wave inflection points to determine if there is a suitable amount of momentum to ride the swing and make profitable trades. Positions are taken or closed based on the rising or falling momentum.
Each value input can be adjusted to best suit the type of market you are trading in. By using the strategy we can optimize these value inputs to yield greater net profits. I have found the RSI and Stochastic values hugely impact entries and exits regarding trades.
For Long conditions:
- RSI & Stochastic needs to be increasing and moving out of oversold conditions to show positive momentum.
- Falling momentum results in a sell signal. I have found RSI less than 65 to be sufficient in most markets however this can be adjusted at any time to yield different results depending on your comfort level.
For Short conditions:
- RSI & Stochastic needs to be decreasing and moving out of overbought conditions to show negative momentum.
Generally, Wave Trend Strategies only take trades that are outside of the bands. This strategy allows trades inside and outside of the bands, which can be selected under the input section title "Aggressive Trading". Trading in this mode is more frequent as signals are often. Due to volatility in crypto markets, I have defaulted the source for Wave Trend waves to be Open/High/Low/Close Average which yielded great results. High/Low/Close average works very well for all other securities, and can easily be adjusted through the drop-down menu inside the inputs.
Works for all types of markets. Parameters can be adjusted but not required as indicator values are standard in the industry.
The default parameters are set to those typically used in the markets currently. However, I have found that if you adjust you to adjust the parameters based on your asset and time frame desired you will yield different results.
----------------
For example:
----------------
ETHUSDT - 4 HR, results are shown below
Wave Trend Parameters:
Aggressive Trading: Yes
Channel Length: 12
Average Length: 24
Overbought Top: 90
Overbought Bottom: 75
Oversold Bottom: -90
Oversold Top: -55
Source: hlc3
Strategy Type:
Trade Direction: Long Only
Stochastic Inputs:
Stoch Length: 18
Smoother %K: 5
Moving Average %K: 4
%K Lower Limit: 21
%K Upper Limit: 80
%K Crossunder Sell: 80
Relative Strength Index Inputs:
RSI Lower Limit: 30
RSI Upper Limit: 70
RSI Sell Value: 68
==================
WaveTecs Features
==================
Profitable Trading Strategy;
Aggressive Trading feature for more trades, with earlier entries and exits;
Customizable inputs to fine-tune your trades;
Buy & Sell Alerts (Indicator Only);
Overlay indicator only to show alerts, WaveTecs Strategy needed to see Wave Trend;
Bot Integration through webhooks;
Two different strategy modes: Long Trades Only or Long & Short Trades
Adding new features & updates whenever possible.
Add both WaveTecs Indicator and WaveTecs Strategy to your chart. WaveTecs Indicator only plots Buy & Sell Alerts, whereas WaveTecs Strategy lets you see what the strategy is doing.

[BTCUSD] Folow Trend & Autotrade Binance FutureCommission = 4 USD per order >>> check in the Performance Summary
Slippage = 2 ticks
- I see from Kodify (tradingview.com/pine-wizards)
Risk: 1% per trade >>> check at the "List of trades"
* Auto trade BINANCE FUTURE by Webhook + Pro, Pro+, Premium Tradingview user.
1. H3 timeframe: Supertrend indicator.
- Long when the closes candle is above Green line.
- Short when the closes candle is below Red line.
2. H1 timeframe: Keltner channels indicator.
* Keltner channels setting:
+ Length = 50
+ Multiplier = 1
+ Use Exponential MA: true
+ Band style: Average true range.
- Long when the close candle crossover the Keltner Upper
- Short when the close candle crossunder the Keltner Lower
3. Entry rule:
Open Buy: Supertrend & Keltner channels are Long. Buy when closes candle crossunder Basis line and closed above Lower Keltner
Open Sell: Supertrend & Keltner channels are Short. Sell when closes candle crossover Basis line and closed below Upper Keltner
4. Stoploss is moving the trend.
Stoploss = Height of Keltner * 1.2.
5. Not repainting
6. Overview result backtesting:
a. Longterm: Every 2 years
2018 to 31/12/2020
2017 to 31/12/2019
2016 to 31/12/2018
2015 to 31/12/2017
2014 to 31/12/2016
2013 to 31/12/2015
2012 to 31/12/2014
b. Midterm: every year.
2020-2021
2019-2020
2018-2019
2017-2018
2016-2017
2015-2016
2014-2015
2013-2014
2012-2013
c. Shorterm:
2020 to today 13/11/2021

supertrend strategyHI,
today I have finished to study another strategy, this time I have done a supertrend with a positive backtest untill 2015 in ETH / BTC pair.
It is very simple to understand and there are only 4 parameters:
The first 2 parameters are about supertrend u can change it as u want.
The last 2 parameters are about trailing stop and target profit, personally I use target 9.6% and trail 8%.
That's all, this is a very simple and profittable strategy.
My personal setting are 4,7,8,9.6
For info write me in private
Please press like, comment or follow :)

Cava Signals Backtesting/VisualizerPLEASE READ THE DESCRIPTION CAREFULLY
Trying this again, as it seems I keep violating the rules unintentionally. Moderator, please forgive me as I try to make this right.
This backtesting/visualizer script was created for me to get a visual idea of the Cava Signals indicator throughout its development time and continuous optimization.
This script is to be used on the 30-minute timeframe on supported markets, and whether I can only publish strategies on regular candles, the indicator is meant to trigger on heikin ashi candles.I understand backtesting on non-regular candles produces unrealistic results, but I emphasize that this script is more for visualization purposes rather than accurate $ amounts from the trades. The signals are used along with a dedicated bot configuration, so part of the strategy is not managed by the script, but by the bot's config.
Some behind the scenes on what we are looking at:
a combination of ema and sma crosses on different time frames (5m, 15m, 30m, 60m and 90m) - we call this the wave trend
a combination of stochastic rsi on different time frames (10m, 30m)
a combination of schaff trend cycles on different time frames (5m, 20m and 30m)
a combination of money flow index on different time frames (10m and 30m)
volume information for each supported market/pair
and a couple of other info particular to each pair
With the above combination of data points, we try to optimize our strategy for an entry, for dca'ing down in case the coin goes down as well as dca'ing up to maximize profit when a coin is going up, take profit levels when we recognize a good time to do so, and of course, a closing level. I would like to emphasize the *visualization* purpose of this script in recognizing lows, highs, and market structure to identify the important levels to signal - this script is NOT to be used for accurate backtesting, but for an idea of the overall performance of when signals are triggered.
Let me try to explain the workflow and icons you see on the chart:
The colored circles on the bottom of the chart are all buy signals; each color corresponds to a particular buy signal, we have a combination of 9 possible situations that would trigger a buy signal. Some would trigger a buy signal only in combination with other buy signals or other indicators within the script. we also display a green upwards arrow below bars when a buy signal is triggered.
The colored arrows pointing down on the top of the chart are close signals. We have a combination of 5 closing criteria each color corresponds to one, just like the buy signals do. We only close a trade in profit. If not in profit, we will look to DCA down.
DCA signals are shown by the green flag above bars. they are signals to DCA up or down depending on the trade being negative or positive. DCA'ing up or down is also managed by the bot's configuration for limits on when to accept the signal.
Take Profit levels are shown by the green diamond above bars and work in conjunction with the bot's config on when to take the signal if at all and other take profit levels. Usually, when we hit the first take profit level we move our stop loss to entry via the bot's take profit safety feature. You can see this call with the close entry named TPS .
The black bars you may see on the chart is to illustrate when the market is extended based on a particular strategy. During this period we will not trigger a buy signal unless there is a huge spike in positive volume .
The green number below the bars is the total positive delta volume on the buy candles.
On the table on the right upper corner, we show some information on the market and performance of the backtesting - for visualization purposes only!
Currently, the script is tailored to work with the following markets/pairs:
Binance Spot: ADA, ALGO, ATOM, AVAX, BNB, BTC , DOT, ETH, LINK, LUNA, MATIC, SOL, VET, XRP, XTZ
Binance Futures: BTC , ETH, ADA, ALGO, ATOM, BNB, COMP, DOT, ENJ , LINK, OCEAN, OMG, SOL, VET, XMR, XRP, XTZ, AVAX, AAVE, DOGE, LTC, LUNA, MKR , NEAR, ONT, RUNE, SUSHI, LTC, XLM , COMP, ONT, THETA, FTM , EGLD , WAVES, ONE, HTN , CHZ , HOT, MANA, CRV , RVN, BAT, ANKR, 1INCH, ALICE, ATA , AXS , CHR , COTI, NKN , RAY, REN, SRM , SXP , TLM
ByBit Inverse Perpetual: BTCUSD , ETHUSD
ByBit Futures: AAVE, ADA, ALGO, AVAX, AXS , BNB, BTC , DOT, ETH, LINK, LTC, MATIC, SOL, SUSHI, UNI , XEM, XRP, XTZ
The chosen pairs are subject to change based on the best-performing assets we are constantly analyzing.
I hope this helps to understand the script, its purpose and ideas. I hope this satisfies the community rules - it was not my intention to break them - if there's anything on the above or the script that still violates the guidelines, please let me know and accept my apologies in advance.
If anyone would like to know more, let me know in the comment section.
Thank you!

[Crypto] DinhChienFX [2 orders]1. Supertrend indicator at Daily timeframe:
- Long trend: the close of candle is above the Green line of Supertrend Indicator.
- Short trend: the close of candle is below the Red line of Supertrend Indicator.
2. Keltner Channels:
- Only buy is above Upper Keltner.
- Only sell is below Lower Keltner.
3. ADX indicator:
- BUY when the ADX indicator crosses 46 + Supertrend is GREEN + Candle's close above Upper Keltner.
- SELL when the ADX indicator crosses 46 + Supertrend is RED + Candle's close below Upper Keltner.
4. Order 2: just active when the Order 1 is opening.
- At the fibonacci retracement 63% ~ Risk/reward 1/1.7
5. Not repaint:
6. Stoploss and Take Profit: risk/reward 1/1.05
- Stoploss = The height of Keltner Channels from lower to upper.
- Take profit = The height of Keltner Channels from lower to upper x 1.05
7. Alert for webhook:
* Historical data with 1 Entry.
- 2013 - 2016:
- 2016 - 2019:
- 2019 to 20/10/2021
---------
Every year:
2013-2014:
2014-2015:
2015-2016:
2016-2017:
2017-2018:
2018-2019:
2019-2020:
2020-2021:
2021-20/10/2021:

Six Factors Ichimoku 1.0This strategy has the purpose to help dummies to get experienced when trade with Crypocurrencies, using the Ichimoku indicator
The following script shows an strategy based on Ichimoku indicator. Taking into account the theoretical concepts of the Ichimoku Kinko Hyo, are defined six (6) factors to open position and two (2) factors to close it. According to the author of the book, in which is based the script, it is stablished that the proper combination of the six factors when the timeframe is set in 1D and the assest Cryptocurrencies (not applicable to stable Coins), has demonstrated in the Backtesting good results.
Althoug is not the purpose, the Ichimoku indicator is composed by six components (Tenkan Line, Kijun Line, Senkou Span A, Senkou Span B and Kumo Cloud) and the relative position of the current price of the assest compared with ichimoku components define these factor.
Factors to open position
Factor one. The current price is over the Ichimoku Cloud
Factor two. When Senkou Span A is greater thant Senkou Span B, proyected 22 periods forward.
Factor three. Senkou Span A, has a positive slope, during the previous periods.
Factor four.The Tenkan Line (quick line) is above the Kijun Line (slow line) during the previous periods.
Factor five. The Chikou Span Line is above the Kumo
Factor six. The slope of the sma (200) is positive.
The long entry is recomended when the following expresion is matched
F1 and F2 and F4 and F5 and (F3 or F6)
Factors to close position
Factor one. Tenkan line has a downward trajectory for previous periods. If the price change during this periods the counter reset and start again trying to prevent exit from quick variations.
Factor two. Current price is below Kijun line
The time to close position is recommended when the following expresión occurs
F1 and F2
Some of the features of the script are the following:
Initial amount of investment stablished on 100€, but can be modified by the user.
User can easily modified the period for backtesting purposes.
"Show factors" give the user and easy interface to know the current status of the strategy`s factors. The factors appears color red (false) and color green (true)
It is possible to cancel Factor F5, which is interesting after the assests has dumped strongly. The color black means that F5 is canceled.
Change the output criteria by F1 or F2 (not recommended) but available for learning purposes.
Auxiliary lines that help to idenfify strong resistances that could compromise the strategy
Enjoy it !!!
Miguel A. Calatayud

Bagheri IG Ether v2In this version, the winning ratio has been decreased, but the Risk to Reward Ratio (RRR) has been set to be better than the previous version.
This is a technical trading strategy for Ethereum ( BINANCE:ETHUSDT ). We built and developed it on MetaEditor and optimized it with MetaTrader optimizer.
The main indicators are Donchian Channel, Oscillator of ROC , Bears Power, Balance of Power , and Simple Moving Average ( SMA ). Default values in the input panel are the best combination of these indicators, but you can change any of them and try it for better results.
Please notice that this strategy has been optimized on the 1-minute chart of Ethereum .
For each position, you can see the Take Profit (TP) and Stop Loss (SL) levels. Also, you can find the values of mentioned TP and SL in points from the input panel of the script.
Attention: The price of Ethereum has 2 decimal places.
Therefore, 3000 points for TP means 30 USDT for trading 1 BINANCE:ETHUSDT .

WEEKLY BTC TRADING SCRYPTWeekly BTC Trading Scrypt(WBTS)
This script is only suggested for cryptocurrencies and weekly buying strategy which is long term.Using it in another markets(e.g forex,stock,e.t.c) is not suggested. The thing makes it different than other strategies we try to understand bull and bear seasons and buying selected crypto currency as using formula if weekly closing value crossover eight weeks simple moving avarage buy,else if selected crypto currency's weekly closing value crossunder eight weeks simple avarage sell. Eight week moving avarage is also uses weekly closing prices but for being able to use this strategy ,trading pair must have more than eight candles in weekly chart otherwise the 8 weeks simple moving avarage value cannot be calculated and script does not work.
This script has a chart called WBTS and it has following features:
Strategy group consist of 3 inputs:
1)Source: Close by default. Our whole strategy uses close values. You can change it but not suggested.
2)Loss Ratio: Because of the cases like the circumstances that manipulates market or high volatility , sometimes graphic show wrong buying signals and this ratio saves user from big money looses(Note : This ratio will always work when selling condition occurs to make user take his profit or prevent him to loss more money because of a wrong positive comes from the indicator.)
3)Reward Ratio : When selling condition happens it will exit user with more profit(if price is already higher than buying point) otherwise it will dimunish loss a bit(if user is below of buying point) or prevents looses(if user is in buying point when selling condition happened.
MA group consist of 2 inputs:
COLOR:Specifies color of the moving avarage.It is equal to #FF3232by hex color code by default.
LINE WIDTH: Specifies linewidth of the moving avarage. It is 2 by default.
GRAPHIC group consist of 2 inputs:
COLOR: It specifies the color of the line which consist of weekly closing prices. It is equal to #6666FF hex color code by default.
LINE WIDTH: Specifies linewidth of the line which consist of weekly closing prices. It is 2 by default.
STRATEGY EXECUTION YEAR: It will show the orders,profits and looses done by script after the input year giving in it.It is 2020 by default.
The last feature is strategy equity,it is not in one of these groups. User should click on settings button on the WBTS indicator than chose Style section and there is a deactivated check box near in the plot section if user activate it, the equity line will show in indicator's graph.
Logic of This Strategy:The story of this strategy began when I studied BTC's price movement from 2020 to today with 8 weeks simple moving avarage (it takes weekly closes as source) and weekly clossing values. I understood that there was a perfect interest between bull and bear market and following conditions:
buy_condition=crossover(weekly_closing_values,8_week_simple_moving_avarage)
sell_condition=crossover(weekly_closing_values,8_week_simple_moving_avarage)
and I tried same thing on the same and bigger time frames("for example i studied how the strategy works from the beginning to today with bitcoin and what is our final equity") with bitcoin and other cryptocurrencies and this made me saw better the relation between giving conditions and general market psychology, however I also witnessed some wrong positives coming by script and used a risk reward ratio to save user and set risk reward ratio 1/3 after a research.
For both conditions(buy_condition and sell_condition),when they are realised,script will alert users and an order will be triggered.
Before finishing the description,from settings/properties/ user can set initial capital,base currency,order size and type,but it is 100000 for initial_amount and 1 contract for order size by default.
In backtesting I used the options like the following example :
Initial capital=1000
Base_curreny=USD
Order size=40 USD
Properties place must set different by every single user according to his or her capital and order size must not be higher than his total money because this script is not the best or a good script for derivatives. It is only written for long term-crypto spot trading and I strongly recommend to users that margin may cause bad results and please do not use it with any margin or any market different than crypto market.
Thank you very much for reading)

Traffic Lights Strategy4HS Crypto Market Strategy
This strategy uses 4 ema to get Long or Short Signals
Length are: 4, 9, 18, 100
We take long positions when the order of the emas is the following:
green > yellow > red (As the color of Traffic Lights) and they are above white ema (Used as a filter for long positions)
We take short positions when the order of the emas is the following:
green < yellow < red (As the color of inverse Traffic Lights) and they are below white ema (Used as a filter for short positions)
Enable Long and/or Short Positions in settings
Enable Profit and Stop in strategy settings with different percentage to backtest the strategy. Also if it is better to use a Traditional Stop Loss or a Trailing Stop Loss based on ATR
Change ema filter resolution in settings for better strategy performance
This Strategy was tested on Crypto Market with good results in assets as BTC, ETH, BNB, ADA, LTC, XLM, BCH, among others
Feel free to optimize this strategy, optimizing its parameters. Each asset has its own "personality".

Bagheri IG EtherThis is a technical trading strategy for Ethereum ( BINANCE:ETHUSDT ). We built and developed it on MetaEditor and optimized it with MetaTrader optimizer.
The main indicators are Donchian Channel, Oscillator of ROC, Bears Power, Balance of Power, and Simple Moving Average (SMA). Default values in the input panel are the best combination of these indicators, but you can change any of them and try it for better results.
Please notice that this strategy has been optimized on the 1-minute chart of Ethereum.
For each position, you can see the Take Profit (TP) and Stop Loss (SL) levels. Also, you can find the values of mentioned TP and SL in points from the input panel of the script.
Attention: The price of Ethereum has 2 decimal places.
Therefore, 3000 points for TP means 30 USDT for trading 1 BINANCE:ETHUSDT .

OnePunch Algo Momentum Indicator V1This is another Plugin from One Punch Algo Team. We call it OnePunch Algo Momentum Indicator V1.
Basic Use:
One Punch Algo Momentum Indicator plugin is used for momentum stocks and high volatility crypto. It provide signals based on Simple Moving Average, Volume, Support & Resistance Lines.
SIGNALS/ALERTS
Buy Signal: Purple Color uptrend icon gives you a signal of an up-trending movement or we call it momentum movement. This signal basically happen when a stock land in a high volatility zone. We use in-build systems such as SMA, Support and Resistance and Trends to come up with the Buy Signal.
Sell Signal: Gray Color downtrend icon gives you a signal of a downtrend movement.
Other Lines Shown in the Diagram:
Red Line is the 200 Day Simple Moving Average (SMA)
Green Line is the 50 Day Simple Moving Average (SMA)
Strategy Tester
Always make sure to use the strategy tester to test how historically our Algo has performed in different time frames. One Punch Algo Momentum Indicator provide the ability to backtest based on certain time periods. This allows you to backtest our Algo vs some other Algo to find which performed well for the given time period, you if you want to see buy and hold performance better than the use of an Algo. This is a strong tool to use for your analysis of a stock or crypto.
What are the timeframes where it is most effective?
Different Stocks or Crypto perform differently with One Punch Algo Momentum Indicator. Please make sure to backtest a stock or crypto before you use the strategy.
Short Term/Day Trading Setup
For Short Term or Day Trade: 1min, 5min, 15min & 30min candlesticks works really well.
Also 3min, 5min, 7min and 15min works as well
Mid Term Trading Setup
For Mid-term traders: 30min, 1hr,2hr, and 4hr setup works really well.
For Long Term Trading Setup
For long term traders: 4hr, 1D, 1Week and 1Month Setup works well.
Best used with Heikin Ashi or Candlestick charts.
DISCLAIMER: Stocks and options trading involves substantial RISK of LOSS and is NOT suitable for every investor. The valuation of stocks and options may fluctuate, and, as a result, clients may lose more than their original investment. If the market moves against you, you may sustain a total loss greater than the amount you deposited into your account. You are responsible for all the risks and financial resources you use and for the chosen trading system. You should not engage in trading unless you fully understand the nature of the transactions you are entering into and the extent of your exposure to loss. If you do not fully understand these risks, you must seek independent advice from your financial advisor.
All trading strategies are used at your own risk. And OnePunch ALGO Developer, Youtuber or the channel does NOT take any responsibility for your losses using any of the advice or suggestions or strategies are shown/said in any of OnePunch ALGO Youtuber or the channel videos.
[Joy] Aladdin Long Trading Strategy 1.0.0 AlphaAladdin's Long trading strategy is to test out Aladdin for long trades only
This strategy is mainly used to test whether Aladdin is suitable for a coin/stocks/futures or for any trading. The profitability, average drawdown, average profits, etc are used by me to decide whether to use it for trading.
What is Aladdin and what does it do?
Using the volume and gradual flow of non-interrupted data (wicks and body of the candles), it tries to detect the macro condition of the market so that one may know in which direction the market is flowing.
* Bearish / Sell sign: On the candle's close, I open a short position
* Bullish sign: On the candle's close, I open a long position
* I take at least 50% profit when the indicator indicates to do so. One can configure that value as desired from the configuration depending on one's risk/money management. I might even convert some portion of the position into stable coins.
FAQ
Q: Does it use some EMA /MA/etc.? Does it use any indicator with tweaked settings?
Answer: No.
Q: What does it mostly depend on?
Answer: Volume and gradual flow of non-interrupted data. The logic depends purely on volume , price bars and the wicks.
Q: Does it work with all coins, stocks, futures, instruments?
Answer: I prefer to use the exchange with the best possible data. Then backtest out to find the best possible timeframe, stop loss and target all derived from this script data.
Q: Can you make it free or make it open source?
Answer: There is no free lunch in this world. I will never reveal or share the source code!
Q: Do you provide ongoing support for the indicator?
Answer: Yes, as long as I can, I will continue updating the indicator
Q: Are the bullish /buy & the bearish/sell markers automatic?
Answer: I have no control over the markers. It is driven purely by logic from the script.
Q: Is this financial advice?
Answer: This is not financial advice. I do not guarantee any profit or loss. I am not responsible for any of your losses or profits. My indicators do not assure profit or loss. It also does not auto-open or auto-close a trade.
Assumptions:
Only long trades are opened and closed. No short trades.
Starting Capital: $20,000
Order Size: 20% of Capital
Data used: Whatever data is available from 2011 till today on Trading view
Findings:
INDEX: BTCUSD 83% profitability using 2day tf
54 closed trades
Profit factor: 16
Sortino Ratio: 5.2
Average Winning Trade: 30%
Average Losing Trade: 9.12%
Largest Winning Trade: 1218%
Largest Losing Trade: 20.25%
Below are the profitability rate for the timeframe and the coins listed as found by running the trading strategy over the following as of today (Aug 1st 2021 12:40 pm Sydney Time).
⚜️ INDEX:BTCUSD 83% using 2day tf
⚜️INDEX:ETHUSD 80% using 1day tf
⚜️FTTUSD 81% using 2day tf
⚜️SRMUSD 71% using 1day tf
⚜️ADAUSDT 81% using 2day tf
⚜️ALGOUSD > 90% using 2day tf
⚜️ALTPERP 81% using 2day tf
⚜️AVAXUSDT 75% using 1day tf
⚜️BANDUSD > 90% using 2day tf
⚜️BCHUSD 82% using 2day tf
⚜️BNBUSD 79% using 1day tf
⚜️BNBUSD 85% using 2day tf
⚜️CHZUSD 71% using 1day tf
⚜️COMPUSD 81% using 1day tf
⚜️DOGEUSD 77% using 1day tf
⚜️EXCHPERP 83% using 1day tf
⚜️FILUSD > 90% using 1day tf
⚜️FTMUSD 70% using 2day tf
⚜️HTUSDT 75% using 2day tf
⚜️KINUSD >90% using 2day tf
⚜️LINKPERP 85% using 2day tf
⚜️LTCUSD 80% using 2day tf
⚜️MATICUSD 77% using 2day tf
⚜️NEOUSD 80% using 1day tf
⚜️NEXOUSD > 90% using 1day tf
⚜️OKBUSD 71% using 1day tf
⚜️OMGUSD 75% using 1day tf
⚜️RSRUSD 87% using 1day tf
⚜️RUNEUSD > 90% using 1day tf
⚜️SHITPERP > 90% using 1day tf
⚜️SOLUSD 84% using 1day tf
⚜️SUSHIUSD 71% using 1day tf
⚜️THETAUSD > 90% using 2day tf
⚜️UNIPERP 83% using 1day tf
⚜️VERTPERP > 90% using 1day tf
⚜️XAUUSD 63% using 2day tf
⚜️XTZUSD 83% using 2day tf
⚜️ZECUSD 72% using 2day tf
Disclaimer:
No one knows what will happen in the future. DYOR and decide on your own conditions. Do realize that neither I nor my indicator can guarantee any profit or loss. And there is no assurance that any trade will ever result in any profit. It is not financial advice.

GMMAs v2.0 CRYPTO [badshah_e_alam]Hello Traders ,
The GMMAs v2.0 CRYPTO strategy stands for gap modified moving averages designed for cryptos. This is a non Repainting Indicator.
This strategy version is a advanced and modified to one of my previously published indicator named as "gap modified moving average".
I am using my Modified Moving Average indicator for a while. I always wanted to add some more information to moving
averages and made some modification to Moving averages.
The additional Information I have added to the Moving Average helps it to act more quickly based on the price of that
particular asset.
How is strategy gives signals?
when the GMMA'w cross over or cross under the GMMA'y than a trade is taken depending on the filter status.
Info about the settings :
The default setting is for 11m ETHUSD , it works with other cryptos and other timeframe as well . For other timeframes it need to be fine tuned and need little change.
The first category is for the selection of Moving average to be modified and the source to be used for that moving average .
I have added seven moving averages to choose between. SMA works good for me , you can choose and play with other MAs.
following are the option to choose MAs
1.EMA
2.SMA
3.HMA
4.RMA
5.WMA
6.VWMA
7.SWMA
Next option in setting is GMMA'y and GMMA'w :
these two settings define the length and lookback period of the MA you have choosed above.
The length is similar to the length of the moving average chosen to be modified.
The lookback option will look for that number of bars for the modification.
GMMA'w is more sensitive than the GMMA'y. So make sure that the setting input of the GMMA'y is significantly larger than the
GMMA'w.
FILTER:
I have added TradingView inbuilt SUPERTREND as a filter in the strategy, it works very good in filtering out false trades
you can enable/disable it in the settings.
EXIT strategy:
The exit Strategy is based on ATR, Take profit and SL are decided by the ATR in the SL/TP setting option. You can change the RR ratio in the setting.
The backtest settings are as follow:
Initial capital:10k
Initial Commission = 0.000
Initial Pyramiding = 0
Reference :
Thanks to pinecoders and Tradingview community.
my previous gap modified moving average version is :https://in.tradingview.com/script/e3WestBa-Gap-Modified-Moving-Average/
watermark added from:
color gradient framework picked from :https://in.tradingview.com/script/hqH4YIFa-Color-Gradient-Framework-PineCoders/
DISCLAIMER
Any and all liability for risks resulting from investment transactions or other asset dispositions carried out by the user based on information received or a market analysis is expressly excluded by me.
All the information made available here is generally provided to serve as an example only, without obligation and without specific recommendations for action. It does not constitute and cannot replace investment advice. We therefore recommend that you contact your personal financial advisor before carrying out specific transactions and investments.
Do your own research and Risk management before taking any trade.

Chaikin Money Flow + MACD + ATRHere I present you on of Trade Pro's Trading Idea: Chaikin Money Flow + MACD + ATR.
This strategy is not as profitable as it can be seen in one of his videos. In the forex market, the strategy could reach a maximum of 35% profitability.
I have, as some of my followers have requested, created an overview of the current position, risk and leverage settings in the form of a table.
Furthermore, one can again swap between short and long positions.
It is now possible to select or deselect individual indicators.
I have chosen the ATR alone as a take profit stop loss, as in his strategy.
A position is only triggered as soon as all prerequisites have been fulfilled and a command is executed. This prevents false triggering by bots and repainting.
-----------------------------------------------------------------------------------
How does the strategy work?
ENTRY
Long
The MACD indicator must be above the zero line.
Then the K line must cross the D line.
Finally, when this happens, the Money Flow Index must be above the zero line.
Short
Contrary to the premise of long positions.
EXIT
ATR Exit
The value of ATR at the time of buying is multiplied by the value entered in "Profit factor ATR" and "Stop factor ATR". As soon as the price reaches this value, it is closed.
Important
The script must be optimized for each coin or currency pair.
I will publish a guide to the strategy shortly. There I will explain how the table works and how to set the strategy correctly.
The results of the strategy are without commissions and leverage.
If you have any questions or feedback, please let me know in the comments.

CryptoKillerCryptoKiller is a trend following trading system. It provides entry and exit points, a money management system and a trade management system.
The entry points (fuchsia line) are determined by CryptoKiller Oscillator (see other published script to understand how the oscillator works).
The trade management system provides the exit points in profit and in loss. This script works with multiple take profits (green lines), the initial position is liquidated little by little as the trend reaches the profit targets. Trade management also provides trailing stop exits to save the remaining profits.
Stop loss (red line) take into account the recent past of the chart to be determined, while take profits are fixed and have been calculated based on historical volatility.
The money management system is very simple, it plans to enter a position with a fixed percentage with respect to equity.
CryptoKiller, during an operation, also draws supports and resistances on the chart - determined by the oscillator (orange lines) these supports and resistances are used as a filter to understand where there is the greatest probability of trend development (some entry points provided by the oscillator will therefore not be considered by CryptoKiller as entry points, as in disagreement with the traced supports / resistances).
We know that an error appears in the backtest calculation, where the script is said to suffer from a bias, so the backtest calculation may not be accurate. Actually this happens in high times like H4 or daily, but CryptoKiller is not designed for these timeframes. it is a short-term strategy.
For more information read the author's instructions to contact us, we will send a PDF file with a more complete explanation of the strategy accompanied by screenshots.
Access to this script is granted along with access to CryptoKiller Oscillator.
mark strategy2 divergence bot v0.5 for xbtusdHi first of all thanks for read this.
This is my second strategy for make trading, I optimized it for xbtusd with 30 min charts.
You can personalize some setting for reach a better result then me, these are the setting:
this script is only for long trade, so bearish divergence don't work
1)ema1
U can change this value for use another ema and use a faster or slower trend
2)ema2
U can change this value for use another ema and use a faster or slower trend
3)pivot right
U can change this value for watch a number of bar on your right
4)pivot left
U can change this value for watch a number of bar on your left
5)high range
U can change this value for watch a max number of bar
6)low range
U can change this value for watch a min number of bar
7)bullish
U can change this value for enable signal with bullish divergence
8)hidden bullish
U can change this value for enable signal with hidden bullish divergence
9)bearish
U can change this value for enable signal with bearish divergence
10)hidden bearish
U can change this value for enable signal with hidden bearish divergence
11)profit 1 %
U can change this value for the first take profit target
12)profit 2 %
U can change this value for the second take profit target
13)qty target 1 %
U can change this value for close a % of your trade at target 1
14)loss %
U can change this value for close the trade at a % of loss
Have nice day and send me a message if u will earn with my strategy.
If u want my code send me a message
for info send me a message

Godtrix's Crypto HA+RSI+EMA+ATH+DCA Strategy 3.0New Updates is here! Upgrade from previous version 2.0 (Please avoid using v2.0 as it's outdated.)
Great stability, Repaint bug fixes, and New features!
==================
| Introduction: |
==================
This is a Long Term Strategy, using compounding profit method, it can generate high returns, but it also risk for losses, this can be overcome if you set Stop Loss to over 25% for bitcoin & 60% for Altcoins.
Best profit plan with this strategy is you trade on Future leverage while you hold on to your coin, so that when price goes up, your coin value goes up, and at the same time, you trade with your leverage to earn even more, easily doubling up your total profit.
Benefits:
Fully customizable and you can easily personalized it and FINE TUNE it according to the market or coin you trading on.
The strategy is based on REAL PRACTICAL trading skills, so it works in real-world.
I fixed the "repainting" issue so the backtest it shows you IS ACCURATE when you run for real-time.
We all know one indicator is not going to help you win your trades, so this strategy combines ALL three: EMA for long+short term trend, HA for short term trend, RSI for entry/exit
This strategy is designed for LONG trade (Buy low, Sell high), not for SHORT trade.
This is not day trading, it is more to mid-term trading, where there's only few trades per month
Mainly is coded to work with 3Commas bot auto trading, so you only need to key in your Bot ID & Email Token.
Bot trading NOTE:
- You need to replace the Alert Message with this: {{strategy.order.alert_message}}
- And you'll need the Bot's webhook Url set with the Alert too.
- One Alert will work for both Buy and Sell Order
- If you using other Bot service, you can enter Custom Command in Input Settings too, it works on any bot service.
Lastly,
regarding the setting advice, I would say you try playing with different settings and your objective is to achieve a backtest result that has:
1) Profitable is > 80%
2) Losing trades is nearly 0 or below 25% of your winning trades. Trick is using far stop loss %
3) Net Profit be almost same or more than "Buy & Hold Profit"
==================
| Latest Updates: |
==================
=| Tidy Up Codings |=
- Group input fields so it'll be easier to understand and find the settings
- Upgrade code for obsolete 'transp' options
=| Repaint Issues |=
- Previous v2.0's RSI has repaint issue, creating false result against real-time data. I've fixed this.
- Also done fine-tuning other parts of the codes to prevent possible repaint issues.
=| Bot System |=
- Improved Custom Bot system, so that you're able to set dynamic order size/quantity with my custom keyword: and
Base Order Example:
{ 'message_type': 'bot', 'bot_id': 1234567, 'email_token': 'abcdefgh-1234-1234-1234', 'base_order': , 'delay_seconds': 0, 'pair': 'USDT_BTC'}
=| EMA Downtrend Exit |=
- Added option for you to decide whether to close position when detected EMA Long term downtrend.
=| EMA 2 (short term) is removed |=
- After several test, I've decided to remove this because it doesn't contribute to improving the results.
=| Heikin Ashi System |=
- Improved the chart display, now you'll see the HA candle 'shadowed' behind, so you'll see both actual price candle and HA candle at same time.
- Added the system that detect the HA candle sizes to decide specifically when it's suitable for Entry and Exit.
>> For "Entry/Exit Range"
- This means after HA is valid for Entry or Exit, how many following bars are allowed to stay valid so it will match other requirements to be completely fulfilled for Entry or Exit.
>> For "Crossing Interval"
- This means after detected HA line crossover, how many HA intervals is allow to Entry or Exit
>> For "Reversed Exit"
- This function let's you decide whether to close position if after HA bull (green candle) changed into HA Bear (red candle)
=| RSI A Entry |=
- Added option to avoid Entry during NTZ (No trade Zone)
- Also added the option to avoid next same condition RSI A entry too soon
=| RSI B Entry |=
- This function is for Entry if RSI is going very low, mostly due to bigger price drops in short time, it's good for buying DIP, however we'll never be able to know when a DIP ends, so do more test on this settings before put into real use.
- Added "avoid" options to help avoid getting Entry at "false" DIP, more like a short & fast pullback which causes RSI to drop very low but actually the price is near ATH or Recent High.
- Added option for Entry with Trailing Price Lower Buy combine with a limit order that grabs low price, so whichever it fulfill first.
=| New: Avoid Entry |=
- Well, it's a pain if you bought at the top, so I've added two options that will avoid buying near ATH and Recent High.
=| Time-limit Removed |=
- Sorry that I've missed look on the script policy which I'm not allowed to put a time-limit for public scripts.
=| System Improvements |=
- HA condition detection is optimized and bug fixed
- RSI values now reads accurately on each bar despite using higher timeframe, especially when moving to next interval
=| New: Dollar Cost Averaging (DCA) Orders |=
- Although DCA strategy is not appealing for Long term strategy, but I've added it for your extra options and flexibilities.
- The settings are quite straight-forward and standard, so I won't be explaining here.
=| New: Backtest Start & End Date |=
- This is very good function when you need more accurate result starting at specific date & time.
- Also if you set the date & time for your real trading starts, it'll much result the same as your actual trading records, which helps you to see clearer and make future decisions.
Any found bugs or flaws, please feel free to PM me, I can't get notifications from comments here below, so I'll not able to reply you the soonest possible, still not sure how to turn on notification for comments, anyone who knows can PM and teach me, lol... Thanks in advance!
Well, this is free version, hope it helps! Feedbacks are all welcome :)
(To Moderators: I've fully use the "f_security()" guideline, but instead of creating a separate function, I apply directly on all security() function. Please don't ban my script before fully check if I've truly fixed repaint. Thank you.)
BITSTAMP:BTCUSD COINBASE:BTCUSD COINBASE:ETHUSD BINANCE:BNBUSDT

MACD EMA - TradingRush StrategyHey there!
Today I present you a rather simple, but very profitable MACD strategy. Since I trade it with cryptocurrencies, the settings have been adjusted.
I discovered the strategy on a YouTube channel and tried to transfer it as a strategy into a script.
Tested with the crypto pair ETH/USDT in the 15 minute chart.
There is the possibility to switch between short and long positions.
-----------------------------------------------------------------------------------
How does the strategy work?
ENTRY
The MACD indicator must cross below the histogram. If it crosses when the price is below the EMA, only short positions are traded. Above the EMA - long.
EXIT
The Lowest Low (long) / highest high (short) serves as the stop loss. The TP is formed on the basis of a factor. (SL multiplied by factor 2.1 = TP).
The red lines are used to illustrate the SL. Above for short positions below for long positions.
The results of the strategy are without commissions and levers.
If you have any questions or feedback, please let me know in the comments.
If you need more information about the strategy and want to know exactly how to apply it, check out my profile.
I wish you good luck with the strategy!

EMA RSI ATR Hidden Div Strat - 1 MinHey there!
Hereby I present you the EMA RSI Lowest Low Hidden Divergence strategy, which I discovered on a youtube channel.
He has tested the strategy hundreds of times manually, herewith I try to automate the whole thing.
Since I use the strategy with a bot, it can only enter long positions for now. But in the future I will add the possibility to trade short positions.
The strategy was tested with BTC/ USDT in 1m chart (8 days). The values must be adjusted depending on the timeframe and coin.
-----------------------------------------------------------------------------------
How does the strategy work?
First of all, we need a bullish hidden divergence.
Once this is detected, the following parameters are checked:
The 50 EMA must cross the 250 EMA .
Then, the candle must close above the 50 EMA .
The K line of the RSI STOCH indicator need to crosses the D line.
If the next candle closes above the 50 EMA , a long position is opened.
The stop loss is determined with the "lowest low/highest high lookback".
The profit factor is multiplied by the value of the lowest low/highest high lookback.
The results of the strategy are without commissions and levers.
If you have any questions or feedback, please let me know in the comments.
In the future I will add other types of stop loss / take profits. (ATR; %; eg.)
I wish you good luck with the strategy!

Ichimoku EMA RSI - Crypto only long StrategyHey there!
Here I show you an Ichimoku Cloud Strategy.
I discovered the strategy on a YouTube channel and tried to transfer it as a strategy into a script.
He said in his video that you would make more profit with this strategy than holding the coin.
Tested with the crypto pair ETH/USDT in the four hour chart.
Period: beginning of 2017 until today.
The strategy should also work with foreign exchange. But then the settings have to be adjusted.
There is the possibility to activate two EMA's and a Stochastic RSI .
-----------------------------------------------------------------------------------
How does the strategy work?
ENTRY
The green Ichimoku lead line must above the red Ichimoku lead line - only the two lead lines are activated.
A green candle must closed above the green lead line.
EXIT
A red candle must close below the green Ichimoku lead line.
OPTIONAL ENTRY
EMA
Once you activate the EMA , long positions will only be taken once the EMA1 is above the EMA2.
Thereby I could observe a significant increase of the profit as well as a decrease of the maximum drawdown.
RSI
As soon as you activate the Stochastic RSI , long positions are only taken when the K line is above the D line.
In the future, I may add an oversold - undersold parameter.
The results of the strategy are without commissions and levers.
If you have any questions or feedback, please let me know in the comments.
If you need more information about the strategy and want to know exactly how to apply it, check out my profile.
I wish you good luck with the strategy!

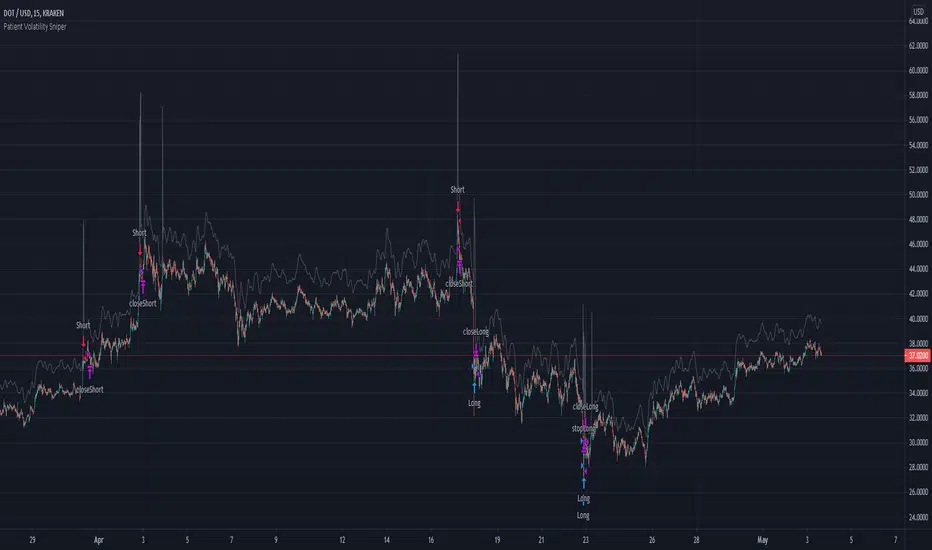
Patient Volatility SniperThis strategy waits for moments of high volatility where an asset is significantly overbought/oversold and makes very short trades.
When the indicator line spikes, it means the script sees a "window of opportunity." However, it will only enter a position if the underlying oscillators are overbought/oversold as determined by the threshold you set.
It does not produce a particularly gaudy net profit compared to many other strategies and can go weeks without making a trade. However, since the win/loss ratio tends to be consistently favorable (based on backtests: see below) it may be useful as a supplement to more "active" trading strategies.
I backtested it over the last year or so with a handful of different altcoins (specifically: ETH, ADA, DOT, XLM, VET, ZEC, and OMG), and it seems fairly robust. Please keep in mind that past results do not guarantee future success. Feel free to confirm the backtesting for yourself, especially as it may change in the future after this was written.
USAGE NOTE: If you have access to custom timeframes on tradingview, I strongly recommend using this strategy on charts in the range of 10m to 12m. In practice, there's not much of a difference, but I did optimize it for those slightly shorter timeframes. There are a handful of tickers for which it does not seem to work very well once you go up to 15m (notably, as of the time of publishing, DOGE).
Commission fee included because not doing so is unrealistic.