Watermark | Bar Time | Average Daily RangeMulti Info Panel & Watermark
Multi Info Panel & Watermark is a utility indicator that displays several pieces of chart information in a single, customizable panel. It is designed to support intraday and swing analysis by making key data—such as symbol details, date, and average daily range—easy to see at a glance, as well as providing simple tools for notes and backtesting.
Features
Watermark / Custom Note
Optional text overlay that can be used as a watermark or personal note.
Can display a strategy name, reminder, or any other user-defined label on the chart.
Ticker Info
Shows information about the currently active symbol on the chart (for example, symbol name and other basic details depending on the inputs).
Helps keep track of which market or pair is being analyzed, especially when using multiple charts.
Current Date
Displays the current date directly on the chart.
Useful for screenshots, journaling, and documenting analysis.
Average Daily Range (ADR)
Calculates the average daily range of the active symbol over a user-defined number of recent days.
Helps visualize how much price typically moves in a day, which can support position sizing, target setting, or volatility awareness within your own trading approach.
Open Bar Time Marker
Marks the open time of a selected bar (for example, a session open or a specific reference bar).
Primarily intended as a visual aid for manual backtesting and reviewing historical price action.
Usage
Use the watermark and ticker info to keep your charts labeled and organized.
Refer to the ADR readout to understand typical daily volatility of the instrument you are studying.
Use the date and open bar time marker when creating screenshots, trade journals, or when replaying historical sessions for review.
This script does not generate trading signals and does not guarantee any performance or results. It is provided solely as an informational and visualization tool. Always combine it with your own analysis, risk management, and decision-making. Nothing in this indicator or description should be considered financial advice.
Dailyrange

MTFX Daily RangeThe MTFX Daily Range plots the Previous Day’s High, Low, Close, and Midpoint directly onto your intraday chart, along with a full suite of fractal extensions above and below the range. All levels print live with price, giving you a real-time road map without lag or repainting.
🔹 Key Features
Core levels: PDH, PDL, PDC, Midpoint, Current Open.
Fractal extensions: ±0.25, ±0.75, ±1.00, ±1.25, ±1.50, ±2.00 — capturing sweeps, expansions, and exhaustion zones.
Customisable styles: Colours, line widths, and visibility can be adjusted.
Toggle control: Levels can be switched on/off to keep charts clean.
Alerts: Wick breaks and candle closes at PD levels for instant structural awareness.
🔹 Why Fractals Matter
Most PD scripts stop at the high and low. This one goes further:
Why Most Traders Struggle With Previous Day Levels
You've seen it happen: price approaches yesterday's high, you take a breakout trade, and it immediately reverses. Or you set support at previous day's low, only to watch price slice through it like butter.
The problem? Most traders only look at PDH and PDL. They're missing the fractal structure that reveals where price actually respects levels.
The Fractal Advantage:
Markets aren't random - they're fractal. The same patterns repeat across different scales. The MTFX Daily Range indicator maps these fractal relationships using the previous day's range as the base measurement.
Contextual precision: Know instantly if price is contained, probing liquidity, or breaking out.
Exit planning: Fractals act as natural TP zones.
🔹 Benefits of Combining Daily Range with MTFX Asia Session Indicator:
Layered conviction: Asia defines the session narrative, PD Range anchors the higher‑timeframe structure.
Sweep logic: Asia sweeps at PDH/PDL are far more meaningful.
Complete narrative: Asia gives timing, PD gives structure — together they keep you out of noise.
Like this indicator? Boost it and follow for updates! 🚀
Published by Mummytrades_FX.

GRG/RGR Signal, MA, Ranges and PivotsThis indicator is a combination of several indicators.
It is a combination of two of my indicators which I solely use for trading
1. EMA 10-20-50-200, Pivots and Previous Day/Week/Month range
2. 3/4-Bar GRG / RGR Pattern (Conditional 4th Candle)
You can use them individually if you already have some of them or just use this one. Belive me when I say, this is all you need, along with market structure knowlege and even if you don’t have that, this indicator has been doing wonders for me. This is all I use. I do not use anything else.
**Note - Do checkout the indicators individually as I have added valuable information in the comment section.
It contains the following,
1. 10 EMA/SMA - configurable
2. 20 EMA/SMA - configurable
3. 50 EMA/SMA - configurable
4. 200 EMA/SMA - configurable
5. Previous Day's Range - configurable
6. Previous Week's Range - configurable
7. Previous Month's Range - configurable
8. Pivots - configurable
9. Buy Sell Signal - configurable
The Moving Averages
It is a very important combination and using it correctly with price action will strengthen your entries and exits.
The ema's or sma's added are the most powerful ones and they do definitely act as support and resistance.
The Daily/Weekly/Monthly Ranges
The Daily/Weekly/Monthly ranges are extremely important for any trader and should be used for targets and reversals.
Pivots
Pivots can provide support and resistance level. R5 and S5 can be used to check for over stretched conditions. You can customise them however you like. It is a full pivot indicator.
It is defaulted to show R5 and S5 only to reduce noise in the chart but it can be customised.
The 3/4 RGR or GRG Signal Generator
Combined with a 3/4 RGR or GRG setup can be all a trader needs.
You don't need complex strategies and SMC concepts to trade. Simple EMAs, ranges and RGR/GRG setup is the most winning combination.
This indicator can be used to identify the Green-Red-Green or Red-Green-Red pattern.
It is a price action indicator where a price action which identifies the defeat of buyers and sellers.
If the buyers comprehensively defeat the sellers then the price moves up and if the sellers defeat the buyers then the price moves down.
In my trading experience this is what defines the price movement.
It is a 3 or 4 candle pattern, beyond that i.e, 5 or more candles could mean a very sideways market and unnecessary signal generation.
How does it work?
Upside/Green signal
1. Say candle 1 is Green, which means buyers stepped in, then candle 2 is Red or a Doji, that means sellers brought the price down. Then if candle 3 is forming to be Green and breaks the closing of the 1st candle and opening of the 2nd candle, then a green arrow will appear and that is the place where you want to take your trade.
2. Here the buyers defeated the sellers.
3. Sometimes candle 3 falls short but candle 4 breaks candle 1's closing and candle 2's opening price. We can enter on candle 4.
4. Important - We need to enter the trade as soon as the price moves above the candle 1 and 2's body and should not wait for the 3rd or 4th candle to close. Ignore wicks.
5. But for a more optimised entry I have added an option to use candle’s highs and lows instead of open and close. This reduces lot of noise and provides us with more precise entry. This setting is turned on by default.
6. I have restricted it to 4 candles and that is all that is needed. More than that is a longer sideways market.
7. I call it the +-+ or GRG pattern or Green-Red-Green or Buyer-Seller-Buyer or Seller defeated or just Buyer pattern.
8. Stop loss can be candle 2's mid for safe traders (that includes me) or candle 2's body low for risky traders.
9. Back testing suggests that body low will be useless and result in more points in loss because for the bigger move this point will not be touched, so why not get out faster.
Downside/Red signal
1. Say candle 1 is Red, which means sellers stepped in, then candle 2 is Green or a Doji, that means buyers took the price up. Then if candle 3 is forming to be Red and breaks the closing of the 1st candle and opening of the 2nd candle then a Red arrow will appear and that is the place where you want to take your trade.
2. Sometimes candle 3 falls short but candle 4 breaks candle 1's closing and candle 2's opening price. We can enter on candle 4.
3. We need to enter the trade as soon as the price moves below the candle 1 and 2's body and should not wait for the 3rd or 4th candle to close.
4. But for a more optimised entry I have added an option to use candle’s highs and lows instead of open and close. This reduces lot of noise and provides us with more precise entry. This setting is turned on by default.
5. I have restricted it to 4 candles and that is all that is needed. More than that is a longer sideways market.
6. I call it the -+- or RGR pattern or Red-Green-Red or Seller-Buyer-Seller or Buyer defeated or just Seller pattern.
7. Stop loss can be candle 2's mid for safe traders ( that includes me) or candle 2's body high for risky traders.
8. Back testing suggests that body high will be useless and result in more points in loss because for the bigger move this point will not be touched, so why not get out faster.
Combining Indicators and Signal
Combining these indicators with GRG/RGR signal can be very powerful and can provide big moves.
1. MA crossover and Signal - This is very powerful and provides a very big move. Trades can be held for longer. If after taking the trade we notice that the MA crossover has happened then trades can be held for higher targets.
2. Pivots and Signal - Pivots and add a support or resistance point. Take profits on these points. R5/S5 are over streched conditions so we can start looking for reversal signals and ignore other signals
3. Intraday Range - first 1, 5, 15 min of the day - Sideways days is when price will stay in these ranges. You can take profits at these ranges or if the range is broken and we get a signal, then it can mean that the direction will be sustained.
4. Previous Day/Week/Month Ranges - These can be used as Take Profit points if the price is moving towards them after getting the signal. If the range is broken and we get a signal then it can be a strong signal. They can also be used as reversal points if a strong signal is generated.
Important Settings
1. Include 4th Candle Confirmation - You can enable or disable the 4th candle signal to avoid the noise, but at times I have noticed that the 4th candle gives a very strong signal or I can say that the strong signal falls on the 4th candle. This is mostly a coincidence.
2. Bars to check (default 10) - You can also configure how many previous bars should the signal be generated for. 10 to 30 is good enough. To backtest increase it to 2000 or 5000 for example.
3. Use Candle High/Low for confirmation instead of Candle Open/Close - More optimized entry and noise reduction. This option is now defaulted to false.
4. Show Green-Red-Green (bull) signals - Show only bull entries. Useful when I have a predefined view i.e, I know market is going to go up today.
5. Show Red-Green-Red (bear) signals - Show only bear entries. Useful when I have a predefined view i.e, I know market is going to go down today.
6. 3rd candle should be a Strong candle before considering 4th candle - This will enforce additional logic in 4 candle setup that the 3rd candle is the candle in our direction of breakout. This means something like GRGG is mandatory, which is still the default behaviour. If disabled, the 3rd candle can be any candle and 4th candle will act as our breakout candle. This behaviour has led to breakouts and breakdowns as times, hence I added this as a separate feature. Vice-versa for a RGGR.
For a 4 candle setup till now we were expecting GRGG or RGRR but we can let the system ignore the 3rd candle completely if needed.
This will result in additional signals.
7. Three intraday ranges added for index and stock traders - 1 min, 5 min and 15 min ranges will be displayed. These are disabled by default except 15 min. These are very important ranges and in sideways days the price will usually move within the 15 min. A breakout of this range and a positive signal can be a very powerful setup.
Safe traders can avoid taking a trade in this range as it can lead to fakeouts.
The line style, width, color and opacity are configurable.
Pointers/Golden Rules
1. If after taking the trade, the next candle moves in your direction and closes strong bullish or bearish, then move SL to break even and after that you can trail it.
2. If a upside trade hits SL and immediately a down side trade signal is generated on the next candle then take it. Vice versa is true.
3. Trades need to be taken on previous 2 candle's body high or low combined and not the wicks.
4. The most losses a trader takes is on a sideways day and because in our strategy the stop loss is so small that even on a sideways day we'll get out with a little profit or worst break even.
5. Hold trades for longer targets and don't panic.
6. If last 3-4 days have been sideways then there is a good probability that today will be trending so we can hold our trade for longer targets. Inverse is true when the market has been trending for 2-3 days then volatility followed by sideways is coming (DOW theory). Target to hold the trade for whole day and not exit till the day closes.
7. In general avoid trading in the middle of the day for index and stocks. Divide the day into 3 parts and avoid the middle.
8. Use Support/Resistance, 10, 20, 50, 200 EMA/SMA, Gaps, Whole/Round numbers(very imp) for identifying targets.
9. Trail your SL.
10. For indexes I would use 5 min and 15 min timeframe and at times 10 mins.
11. For commodities and crypto we can use higher timeframe as well. Look for signals during volatile time durations and avoid trading the whole day. Signal usually gives good targets on those times.
12. If a GRG or RGR pattern appears on a daily timeframe then this is our time to go big.
13. Minimum Risk to Reward should be 1:2 and for longer targets can be 1:4 to 1:10.
14. Trade with small lot size. Money management will happen automatically.
15. With small lot size and correct Risk-Reward we can be very profitable. Don't trade with big lot size.
16. Stay in the market for longer and collect points not money.
17. Very imp - Watch market and learn to generate a market view.
18. Very imp - Only 3 type of candles are needed in trading -
Strong Bullish (Big Green candle), Strong Bearish (Big Red candle),
Hammer (it is Strong Bullish), Inverse Hammer (it is Strong Bearish)
and Doji (indecision or confusion).
If on daily timeframe I see Strong Bullish candle previous day then I am biased to the upside the next day, if I see Strong Bearish candle the previous day then I am biased to the downside the next day, if I see Doji on the previous day then I am cautious the next day, if there are back to back Dojis forming in daily or weekly then I am preparing for big move so time to go big once I get the signal.
19. Most Important Candlestick pattern - Bullish and Bearish Engulfing
20. The only Chart patterns I need -
a) Falling Wedge/Channel Bullish Pattern Uptrend or Bull Flag - Buying - Forming over a couple days for intraday and forming over a couple of weeks for swing
b) Falling Wedge/Channel Bullish Pattern Downtrend or Falling Channel - Buying
c) Rising Wedge Bearish Pattern Uptrend or Rising Channel - Selling
d) Rising Wedge Bearish Pattern Downtrend or Bear flag - Selling
e) Head and Shoulder - Over a longer period not for intraday. In 15 min takes few days and for swing 1hr or 4h or daily can take few days
f) M and W pattern - Reversal Patterns - They form within the above 4 patterns, usually resulting in the break of trend line
21. How Gaps work -
a) Small Gap up in Uptrend - Market can fill the gap and reverse. The perception is that people are buying. If previous day candle was Strong Bullish then market view is up.
b) Big Gap up in Uptrend - Not news driven - Profit booking will come but may not fill the entire gap
c) Big Gap up in Uptrend - News driven, war related, tax, interest rate - Market can keep going up without stopping.
c) Flat opening in Uptrend - Big chance of market going up. If previous day candle was Strong Bullish then view is upwards, if it was Doji then still upwards.
d) Gap down in Uptrend - Market is surprised. After going down initially it can go up
e) Small Gap down in Downtrend - Market can fill the gap and keep moving down. If previous day candle was Strong Bearish then view is still down.
f) Flat opening in Downtrend - View is down, short today.
g) Big Gap down in Downtrend - Profit booking and foolish buying will come but market view is still down.
h) Gap down with News - Volatility, sideways then down.
i) Gap Up in Downtrend - Can move up - Price can move up during 2/3rd of the day and End of the day revert and close in red.
22. Go big on bearish days for option traders. Puts are better bought and Calls are better sold.
23. Cluster of green signals can lead to bigger move on the upside and vice versa for red signals.
24. Most of this is what I learned from successful traders (from the top 2%) only the indicator is mine.

DEE's Indicator v2 — Daily Range, Averages & Previous High/Low🇺🇸 English
This indicator is designed to help traders analyze market volatility and daily price ranges.
It includes the following features:
• 5-bar analysis: Shows high-low ranges and percentage changes of the last 5 bars.
• Daily Average Range: Calculates daily average ranges based on the last 5 bars.
• Daily AVG Lines: Plots expected top and bottom range levels based on the daily average.
• Previous Day High/Low: Automatically draws lines from the previous day's high and low.
• Timeframe Separators: Adds visual separators between days, months, and years.
• Optional arrows: Displays arrow markers for the last detected bars used in the calculation.
Use cases:
● Intraday traders can quickly measure daily progress compared to the average daily range.
● Swing traders can identify support/resistance levels from previous daily highs and lows.
● Risk managers can monitor when current volatility deviates significantly from the average.
⚠️ Notes:
The script does not generate buy/sell signals; it provides analytical tools only.
All displayed information is for visual/educational purposes and should be combined with your own trading strategy.
👉 Don’t forget to adjust the settings to suit your needs.
If you are using a multi-chart layout with different timeframes and apply this indicator to each chart, the 5-bar data will be calculated separately based on each chart’s TF. However, the “Daily AVG” section will always show the same value for the 1D timeframe.
🇺🇿 O‘zbekcha
Ushbu indikator treyderlarga bozor volatilligi va kundalik narx diapazonlarini tahlil qilishda yordam berish uchun mo‘ljallangan.
Unda quyidagi funksiyalar mavjud:
• 5-bar tahlili: So‘nggi 5 ta bar diapazoni (high–low) va foiz o‘zgarishini ko‘rsatadi.
• Kundalik o‘rtacha diapazon: So‘nggi 5 ta bar asosida o‘rtacha kundalik diapazonni hisoblaydi.
• AVG Lines: Daily AVGning yuqori va pastki diapazon darajalarini chizadi.
• Oldingi kunning High/Low darajalari: Avtomatik ravishda oldingi kunning high va low darajalarini chizadi.
• Vaqt ajratgichlari: Kunlar, oylar va yillar orasiga vizual ajratgich qo‘shadi.
• Ixtiyoriy strelkalar: Hisoblash uchun foydalanilgan so‘nggi barlarda strelka belgilarini ko‘rsatadi.
Qo‘llanilishi:
● Intraday treyderlar kundalik natijani o‘rtacha kundalik diapazon bilan tezda solishtira olishadi.
● Swing treyderlar oldingi kunning high va low darajalaridan qo‘llab-quvvatlash/qarshilik darajalarini aniqlashlari mumkin.
● Risk-menejerlar hozirgi volatillik o‘rtachadan sezilarli darajada og‘ib ketganini kuzatishlari mumkin.
⚠️ Eslatma:
Ushbu indikator sotib olish/sotish signallarini bermaydi; u faqat tahliliy vosita sifatida ishlatiladi.
Ko‘rsatilgan barcha ma’lumotlar vizual/ta’limiy maqsadlarda mo‘ljallangan bo‘lib, o‘z strategiyangiz bilan birgalikda qo‘llanilishi lozim.
👉 Sozlamalarni ehtiyojlaringizga qarab moslashtirishni unutmang.
Agar siz multi-chart rejimida turli timeframelar bilan ishlasangiz va ushbu indikatorni har bir grafikda qo‘llasangiz, 5 ta bar haqidagi ma’lumotlar har bir grafikning o‘z TFiga qarab hisoblanadi. Ammo “Daily AVG” bo‘limida esa faqat 1D timeframe uchun bir xil qiymat ko‘rsatiladi.
🇷🇺 Русский
Этот индикатор предназначен для помощи трейдерам в анализе волатильности рынка и дневных ценовых диапазонов.
Он включает в себя следующие функции:
• Анализ 5 свечей: Показывает диапазон high–low и процентные изменения последних 5 свечей.
• Средний дневной диапазон: Рассчитывает средний дневной диапазон на основе последних 5 свечей.
• Линии среднего диапазона (AVG Lines): Строит ожидаемые верхние и нижние уровни диапазона на основе среднего дневного значения.
• Максимум/минимум предыдущего дня: Автоматически наносит линии с уровнями high и low предыдущего дня.
• Разделители временных интервалов: Добавляет визуальные разделители между днями, месяцами и годами.
• Опциональные стрелки: Показывает стрелки на последних свечах, использованных в расчётах.
Применение:
● Интрадей-трейдеры могут быстро измерять дневное движение по сравнению со средним дневным диапазоном.
● Свинг-трейдеры могут определять уровни поддержки/сопротивления по максимумам и минимумам предыдущего дня.
● Риск-менеджеры могут контролировать ситуации, когда текущая волатильность значительно отклоняется от среднего.
⚠️ Примечания:
Этот индикатор не генерирует сигналы на покупку/продажу; он предоставляет только аналитические инструменты.
Вся отображаемая информация предназначена для визуальных/образовательных целей и должна использоваться совместно с вашей торговой стратегией.
👉 Не забудьте настроить параметры под свои нужды.
Если вы работаете в режиме мульти-графика с разными таймфреймами и применяете этот индикатор на каждом графике, данные по 5 барам будут рассчитываться отдельно для каждого ТФ. Однако в разделе “Daily AVG” всегда отображается одно и то же значение для таймфрейма 1D.
© Dilshod Nurmatov Shuhratovich | deetradesonline | 2025

Haven Average Daily RangeOverview
This indicator is an enhanced version of the traditional ADR tool that adapts to intraday price movements. Unlike static ADR levels, this indicator dynamically adjusts its range boundaries based on real-time price action while maintaining the original ADR calculation framework.
Key Features
ADR calculation based on multiple periods (5, 10, and 20 days)
ADR levels displayed with automatic style changes upon range reach
Customizable display settings (color, line style)
Price labels for better visualization
The indicator helps traders assess the instrument's volatility, identify potential reversal zones, and plan daily trading targets.
Suitable for all timeframes up to D1 and any trading instrument.
How It Works
Session Start (UTC+0): Calculates ADR based on historical data and sets initial High/Low levels
Dynamic Phase: Monitors price action and adjusts the opposite boundary (ADR Low or High) when new extremes are reached.
When price creates new Day high price above the opening price, the ADR Low level moves upward proportionally.
When price creates new Day low price below the opening price, the ADR High level moves downward proportionally.
Completion Phase: Stops adjustments and highlights breach when price reaches either boundary
Trading Application
Entry and Exit Signals
The ADR boundaries serve as key decision points for trade execution. When price approaches the upper ADR boundary, it often signals a potential selling zone, particularly when confluence exists with other overbought indicators such as RSI divergence or resistance levels. Conversely, price reaching the lower ADR boundary frequently indicates potential buying opportunities, especially when supported by oversold conditions or support confluences.
Trend Continuation Assessment
One of the most valuable applications is gauging the probability of continued directional movement. When the current session's price action has not yet reached either ADR boundary, statistical probability favors trend continuation in the established direction. This information helps traders stay with profitable positions longer rather than exiting prematurely.
Reversal and Consolidation Zones
The visual color change to orange when ADR boundaries are reached provides immediate feedback that the normal daily range has been exhausted. At this point, the probability of trend reversal or sideways consolidation increases significantly. This signal helps traders prepare for potential position adjustments or new counter-trend opportunities.

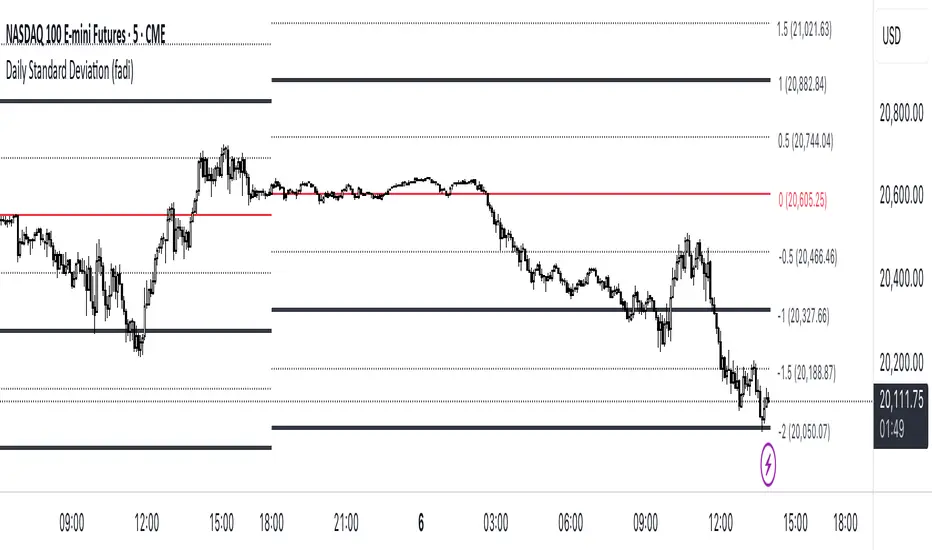
Daily Standard Deviation (fadi)The Daily Standard Deviation indicator uses standard deviation to map out daily price movements. Standard deviation measures how much prices stray from their average—small values mean steady trends, large ones mean wild swings. Drawing from up to 20 years of data, it plots key levels using customizable Fibonacci lines tied to that standard deviation, giving traders a snapshot of typical price behavior.
These levels align with a bell curve: about 68% of price moves stay within 1 standard deviation, 95% within roughly 2, and 99.7% within roughly 3. When prices break past the 1 StDev line, they’re outliers—only 32% of moves go that far. Prices often snap back to these lines or the average, though the reversal might not happen the same day.
How Traders Use It
If prices surge past the 1 StDev line, traders might wait for momentum to fade, then trade the pullback to that line or the average, setting a target and stop.
If prices dip below, they might buy, anticipating a bounce—sometimes a day or two later. It’s a tool to spot overstretched prices likely to revert and/or measure the odds of continuation.
Settings
Open Hour: Sets the trading day’s start (default: 18:00 EST).
Show Levels for the Last X Days: Displays levels for the specified number of days.
Based on X Period: Number of days to calculate standard deviation (e.g., 20 years ≈ 5,040 days). Larger periods smooth out daily level changes.
Mirror Levels on the Other Side: Plots symmetric positive and negative levels around the average.
Fibonacci Levels Settings: Defines which levels and line styles to show. With mirroring, negative values aren’t needed.
Overrides: Lets advanced users input custom standard deviations for specific tickers (e.g., NQ1! at 0.01296).
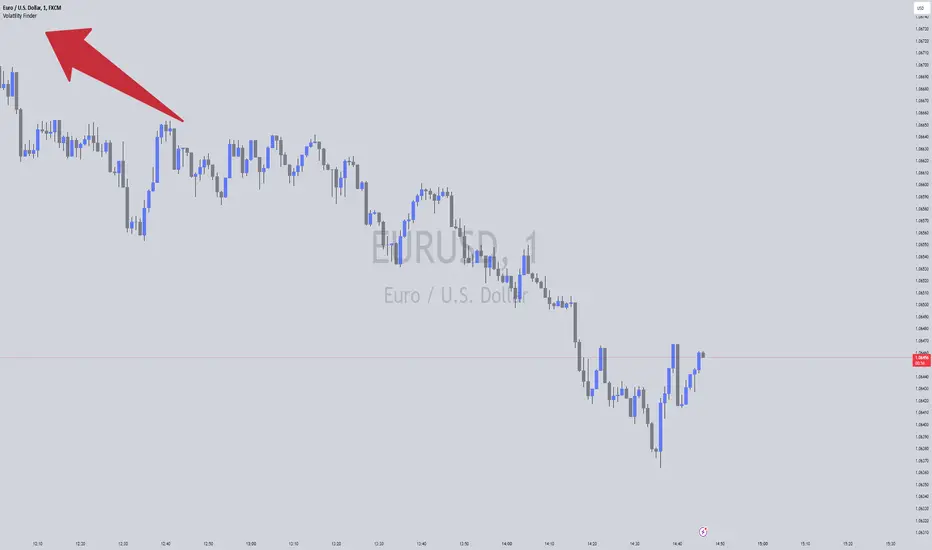
Volatility FinderVolatility Finder / Daily Range.
This indicator will measure the Average amount of Pips/Points movement of price, over an X amount of time.
This is often referred to as "Forex Volatility" Most pairs have different amounts of volatility. Exotics pairs are considered very volatile, Forex Majors is less volatile.
So this Indicator, will measure the amount of ADR/Average Daily Range.
Average amount of Pips/Points of movement, within a specific period of time, and tell you that.
- In the settings, you can choose how many days you want the indicator to measure from, and it will tell you the average amount of pips, based on the average movement on those days.
The Default setting is set to 90 days/3 months.
IMPORTANT:
To see the number the indicator tells you, you have to RIGHT-click up in the Left-side corner, where you see the Pair you have open on your Chart. And make sure to Enable "INDICATOR VALUES". Then if you However over the Indicator area, where the indicators you have open. You will see the number that the indicator has found. Based on the Settings you have set in the Settings Menu.
* One applicable way to use this information is if you are inside a trade, and price has moved past the Daily Range. It could be less probable it will continue in the same direction when it has Met the Daily Range.
* Another is to use this, to find pairs that you might want to trade. If the Average Price movement over the time you input, is High, you can use this information to help you decide if this pair is to Volatile for you to consider trading, or if it moving to slow for you.
It's very accurate, if you want to compare, you can go to 3rd party websites like
Mataf / mataf.net/en/forex/tools/volatility
Investing.com / investing.com/tools/forex-volatility-calculator
Range Based Signals and AlertsThis script produces a compiled version of rule based signals that is meant to be used mainly on 5 Min timeframe based on daily(as default) Highs and Lows on average and the main purpose is to give user settings to change and adapt based on their needs and make it as adjustable as possible. This entry strategy idea does not belong to me but for TV's in-house rule reasons i can't disclose whose idea it is but i think people that will use this indicator will know who the original idea belongs to.
Rules used for signal production:
- Daily(As default) High-Low points
- Moving Average for detecting reversing of price
- MTF MACD (Daily as default) for detecting overall trend
Signals produced based on extensions of price out of daily zones and when they drop or rise back into moving average. A conditional checker is used for reducing repeated unnecessary signals and alerts.
Happy trading.

Daily Range Support & Resistance Levels [QuantVue]The Daily Range Support & Resistance Levels is an advanced analytical tool designed to assess daily price movements and provide potential support and resistance levels.
This tool examines the average daily price fluctuations over the past 150 trading days, and creates support and resistance levels based on the opening price.
The indicator also considers a standard deviation multiplier.
This enables traders and investors to identify potential price zones.
The support and resistance levels are dynamically updated every day.
Users can also choose to view previous daily levels as well.
Customizable settings for this tool include:
-Averaging Period: Adjust the number of days to calculate the average daily range.
-Standard Deviation Multiplier: Modify the standard deviation multiplier to fine-tune the sensitivity of the support and resistance levels. A higher multiplier will result in wider levels, accommodating higher price fluctuations.
-Toggle Support & Resistance Prices: Easily switch on or off the display of support and resistance price levels.
-Show Daily Open Line: Display the daily opening price as a reference point on the chart.
-Show Previous Levels: Choose whether to display past daily support and resistance levels.
Note: this indicator works best on 5 or 15 minute charts.
Give this indicator a BOOST and COMMENT your thoughts!
We hope you enjoy.
Cheers.

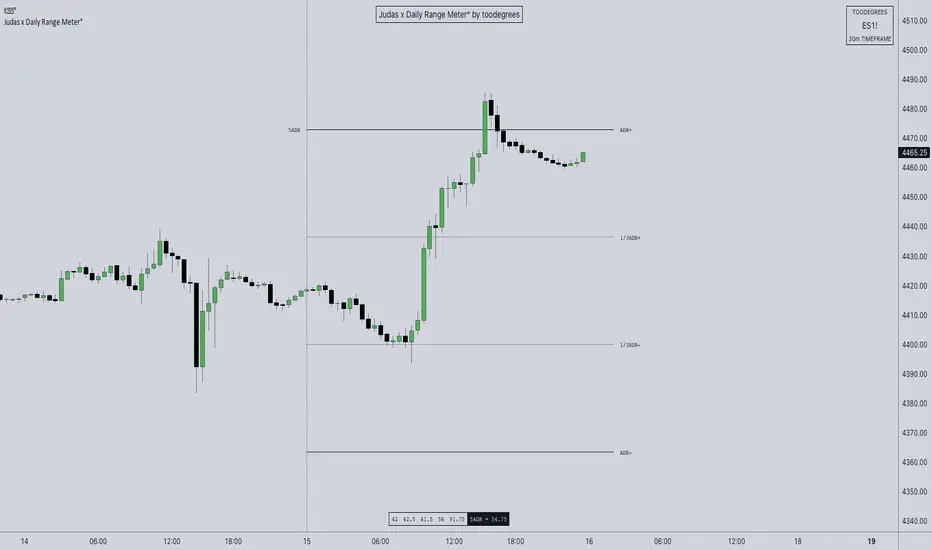
ICT ADR Levels - Judas x Daily Range Meter°The Average Daily Range (ADR) is a common metric used to measure volatility in an asset. It calculates the average difference between the highest and lowest price over a time interval – normally five days.
The Inner Circle Trader teaches the importance of this metric from an algorithmic point of view; in particular the 1/3ADR price level is deemed to be a threshold used to determine the area at which a Judas Swing – false move to trick market participants, protraction, manipulation – might exhaust. Another key difference in the ICT-use of this metric compared to the classic approach is that the average range is calculated from New York midnight Time, rather than the daily candle's open .
It is crucial to remember that the elements of Time are key when it comes to interpreting how price action will, or won't, react to this level: what Time of the day is it? what day of the week? what week of the month?
Let's consider the Time of the day. If one thinks about the Power of Three of the daily candle (Accumulation, Manipulation Distribution), it is highly unlikely that a Manipulation event will happen later in the day – whereas seeing the 1/3ADR hold in London session or New York open gives undeniable edge to an Analyst.
Apart from the 1/3ADR level seen from a Judas perspective, the opposing 1/3 level, and the full ADR projections, are excellent algorithmic levels at which we will see orderflow or reactions worth studying. These can be take profit targets, reversal opportunities, pyramid entries, ... Study them, and find what works for you!
Features:
Display a table with the previous N days' ranges and the current ADR value
Decide whether to consider daily candles, or New York (00:00 to 00:00 NY Time) for the basis of the calculation
See the ADR Range, the ADR price levels and 1/3ADR price levels by hovering over the text labels
Plot the ADR levels from the Midnight Anchor, or as offset markers on the side for a cleaner look
Show/Hide all elements individually
Examples:
– CBOT_MINI:YM1! at Equity Open
– INDEX:BTCUSD Perfect Buy Day Signature
– FX:EURUSD Clean Break = No Judas
– TSX:GC Repeated Attempts = Liquidity Engineering
Nick_OS RangesUNDERSTANDING THE SCRIPT:
TIMEFRAME RESOLUTION:
* You have the option to choose Daily , Weekly , or Monthly
LOOKBACK WINDOW:
* This number represents how far back you want the data to pull from
- Example: "250" would represent the past 250 Days, Weeks, or Months depending on what is selected in the Timeframe Resolution
RANGE 1 nth (Gray lines):
* This number represents the range of the nth biggest day, week, or month in the Lookback Window
- Example: "30" would represent the range of the 30th biggest day in the past 250 days. (If the Lookback Window is "250")
RANGE 2 nth (Blue lines):
* This number represents the range of the nth biggest day, week, or month in the Lookback Window
- Example: "10" would represent the range of the 10th biggest day in the past 250 days. (If the Lookback Window is "250")
RANGE 3 nth (Pink lines):
* This number represents the range of the nth biggest day, week, or month in the Lookback Window
- Example: "3" would represent the range of the 3rd biggest day in the past 250 days. (If the Lookback Window is "250")
YELLOW LINES:
* The yellow lines are the average percentage move of the inputted number in the Lookback Window
SUGGESTED INPUTS:
FOR DAILY:
Lookback Window: 250
Range 1 nth: 30
Range 2 nth: 10
Range 3 nth: 3
FOR WEEKLY:
Lookback Window: 50
Range 1 nth: 10
Range 2 nth: 5
Range 3 nth: 2
FOR MONTHLY:
Lookback Window: 12
Range 1 nth: 3
Range 2 nth: 2
Range 3 nth: 1
TIMEFRAMES TO USE (If You Have TradingView Premium):
Daily: 5 minute timeframe and higher (15 minute timeframe and higher for Futures)
Weekly: 15 minute timeframe and higher
Monthly: Daily timeframe and higher (Monthly still has issues)
TIMEFRAMES TO USE (If You DO NOT Have TradingView Premium):
Daily: 15 minute timeframe and higher
Weekly: 30 minute timeframe and higher
Monthly: Daily timeframe and higher (Monthly still has issues)
IMPORTANT RELATED NOTE:
If you decide to use a higher Lookback Window, the ranges might be off and the timeframes listed above might not apply
ISSUES THAT MIGHT BE RESOLVED IN THE FUTURE
1. If it is a shortened week (No Monday or Friday), then the Weekly Ranges will show the same ranges as last week
2. Monthly ranges will change based on any timeframe used

Average Daily Range% for DaytradingThis indicator shows how many Average Daily Ranges was covered in today's move.
Average Daily Range is always calculated based on the last 5 previous days (before current day).
Tables show:
► How many % of days exceed their ADR.
► How many days in a row did the range remain lower than 5 Day ADR
► How much is already covered by today's move.
It is designed for Daily chart, don't try to use it elsewhere.

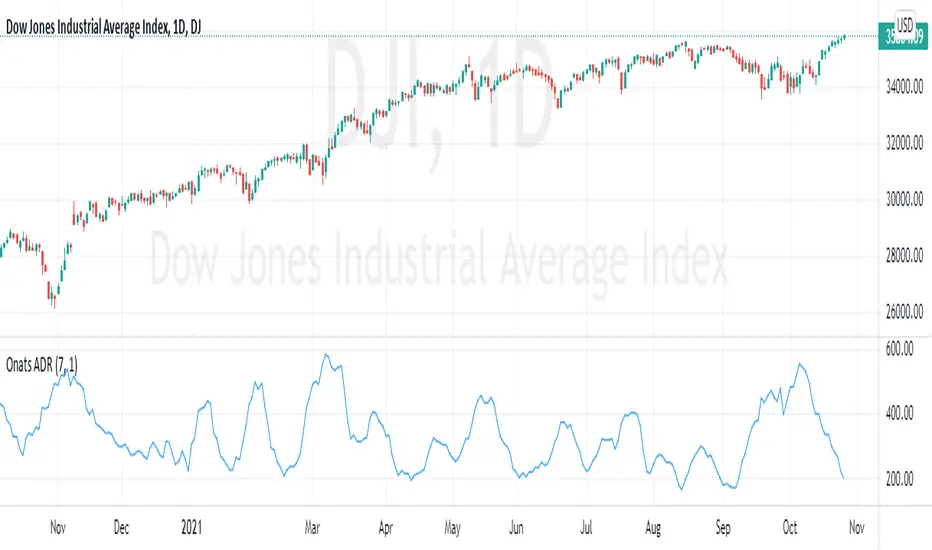
ADR - Average Daily Range With ForecastI always liked the MT4 ADR indicator that was going around but never found a decent port of it in tradingview. I also noticed that the way most people were doing the ADR calculation using SMA was not always accurate and that bothered me so I decided to write one from scratch which gave a very specific ADR calculation.
On the MT4 version it would project ADR targets on the high and low side. While I liked that I thought it could be improved upon by determining orderflow and anchoring to the perceived low of day to give you a more realistic target.
I also included a percentage of current ADR as well as changed the color to red once ADR was hit.
Configuring is very simple:
Max Timeframe To Display: you can set what timeframes to show adr (I know tradeingview lets you set this now but I still like it here)
Display Average Range As FOREX pips: Some Instruments use whole numbers so you can toggle if you need too
ADR Length Parameter: Sets Number of Days Lookback to Calculate ADR
I hope you enjoy it.

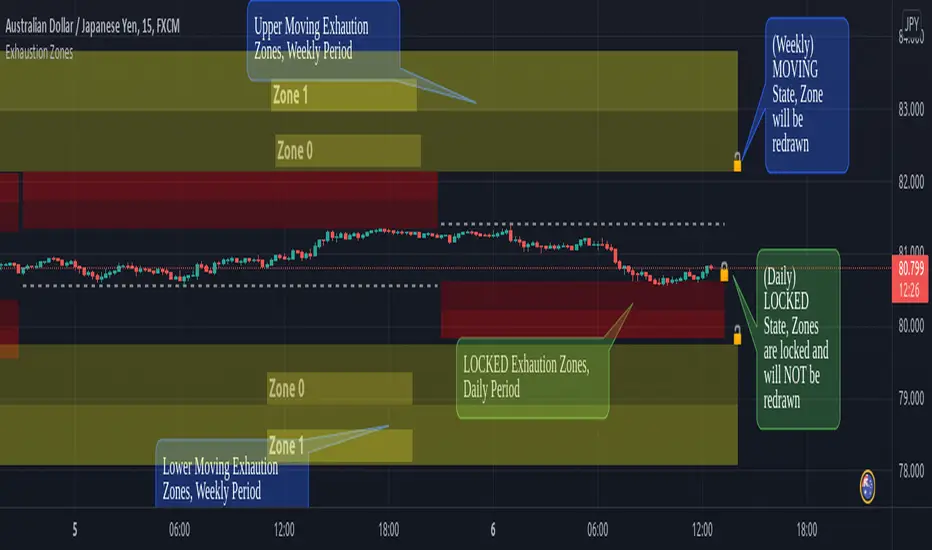
Exhaustion ZonesOur Indicator “Exhaustion Zones” offers an insight into the expected Volatility of any given Instrument applied to. Understanding Volatility is essential for using this Indicator. If you are familiar with the concept, then you will most likely find this indicator useful in your trading. If you are unfamiliar with the concept and are interested in this topic, then continue reading a “Brief Concept of Volatility” at the end of the description, where we will provide some informational Links.
This description will provide a High Level description of how our Indicator identifies and visualizes Exhaustion Zones, followed by how to use the Indicator in your trading. At the end we would like to introduce our team and experience.
High Level Description of “Exhaustion Zones”:
Our indicator is predicting the expected market volatility for a predefined period based on recent historical Volatility, which will be referred to as “Period Volatility” from now on. Currently there are two Predefined Periods…
...a daily period, which starts from 21 UTC for the next 24 hours.
...a weekly period, which starts from Sunday 21 UTC for the next 7 days.
Our indicator calculates an expected volatility for the respective period and informes you, the trader, how large the price range could be. The indicator calculates “Exhaustion Zones” using the Period Volatility, which is a multiple (1x, 2x and 3x) of the Period Volatility, based on the Period High/Low. Basically, adding the multiple of the Period Volatility to the Period Low would equate to the “Upper Exhaustion Zones”, and subtracting the multiple of the Period Volatility from the Period High would equate to the “Lower Exhaustion Zones”.
Visualisation:
Our indicator needs to display 2 states …
…price range is SMALLER than predicted Period Volatility. An example would be, a daily period has just begun, and the Daily range is small, hence the Daily range is smaller than the predicted Period Volatility. This state will be referred to as “Moving Exhaustion Zones”
...price range is GREATER than predicted Period Volatility. An example would be, a market has experienced a shock leading to a huge price change and exceeding the Period Volatility. This state will be referred to as “Locked Exhaustion Zones”
What do the Boxes mean:
Our Indicator displays 2 different Periods - Daily and Weekly. The Daily period is displayed with a red accent color, whereas a weekly Period has a yellow accent.
The Boxes themself display the “Exhaustion Zones”. Each period displays upto 4 Exhaustion Zones - 2 Upper Exhaustion Zones, 2 Lower Exhaustion Zones, each having a “Zone 0” and “Zone 1”.
Moving Exhaustion Zones
Moving Exhaustion Zones displays 4 Exhaustion Zones. These Zones are based on the Period High/Low and are NOT locked, and can still be redrawn. As prices make new Period Highes and Lows, exhaustion Zones will be adjusted. This state is visualized by the Open Lock on the right side of the current Exhaustion Zone.
Locked Exhaustion Zones
Locked Exhaustion Zones display 2 Exhaustion Zones and a dashed Line. Price has made its move and has exceeded predicted Period Volatility. Exhaustion Zones are locked and will NOT be repainted from now on. This state is visualized by the closed Lock on the right side of the current Exhaustion Zone.
How to use it:
The Exhaustion Zones indicator is a mean reverting Indicator. That being said, when Price approaches/enters a Zone, the assumption is that Price will either slow down, or reverse.
The Exhaustion Zone is displayed as 2 Sub-Zones: Zone 0 and Zone 1. As Price continues through the Zones without a reversal, the potential for a reversal increases.
We recommend using this Indicator with a reversal Trading Strategy familiar to you.
Furthermore, this Indicator is well suited as a Target. You can use the Exhaustion Zones to define your Target or where you would like to remove partial Profits.
Important
Please note, that the indicator itself just presents price areas where there is a potential for a price reversal, and that these Zones should not be traded blindly
Time frame:
This indicator is programmed to be used on all Timeframes lower than Weekly Timeframes.
Instruments:
This indicator aims to visualize areas of where Market price has the potential to reverse, hence making this a mean reverting Indicator.
Taking this statement to account, it is recommended to apply this Indicator to Instruments with a mean reverting character.
Examples of mean reverting markets could be for example …
...all FOREX instruments, as FOREX is considered a mean reverting Market.
...an instrument that is in a consolidation, or which you are expecting to enter a period of consolidation.
Indicator settings and configuration:
The Indicator has no functional parameters, to reduce User error, and only has visual parameters. The color of the Zones can be tailored to your liking.
Furthermore you have decided what you would like to display on your chart:
… Display Weekly Zones
...Display Daily Zones
...Show History
...Show Zone States.
Brief concept of Volatility:
Volatility is a concept that has been around for a very long time. Following links are helpful to get a grasp of the concept:
en.wikipedia.org(finance)
www.investopedia.com
Our Team:
We are a team of 3 Traders with a co mbined experience of 40 years. We are using our experiences from the market to create Indicators to Visualize the most relevant Patterns to us in our trading today. Our goal is to reconstruct these patterns to match our understanding of the market and to simplify the process of creating reproducible trading Strategies.
Multi Range VWAP PivotsMulti Range VWAP Pivots turned out to be one of my most accurate pivot indicators to date!
Multi Range VWAP Pivots works by recognizing the high and low of the timeframe selected (D, W, M, 6M, and 12M) and plotting range high to VWAP averages and range low to VWAP averages.
After further examination of each completed range, I came to the conclusion that due to the nature of averages, high and low respectively would need to be completed within the current range, for the averages to actually display pivots correctly. This means that if all averages appear to be "pivoting" correctly after or during a break lower of higher, then we can only assume the most recent break higher or lower could be exhaustion and price will be reverted to the mean (VWAP). OR, this could be the most accurate hindsight indicator on the planet.
*DISCLAIMER*: This indicator repaints. DO NOT backtest or set alerts with this indicator.

High/Low Anchored VWAPHigh/Low Anchored VWAP simply plots an Anchored VWAP at High and Low, within a set range (D,W,M) , with a central "Basis" plot of the High and Low anchored VWAPs
*DISCLAMER* This indicator repaints. DO NOT set alerts or backtest using this indicator.


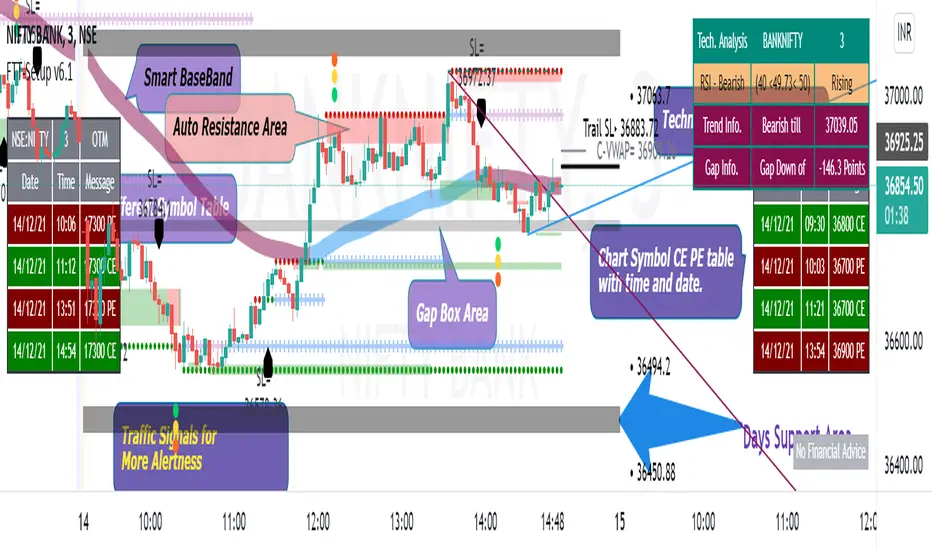
Fishing The Trend - SetupFishing The Trend - Setup
HOW Does it work ?
The name itself says we must have a trading setup for ease of trading for getting the most from the market.
i.e. Combining the most useful indicator under one roof...
Fishing The Trend - Setup have following ::-
1) IntraDay Range.
2) Four Friends.
3) Fishing The Trend.
4) Multi Time Frame - Custom VWAP.
5) RSI based SMA.
1) Intraday Range
HOW Does it work ?
For calculating the average most probable range for any plotted security, it plots 2 bands higher band and a lower band for a particular range using the default ADR. This indicator is on - as default.
# Upper and Lower band act as support and resistance , user may see a reversal in trend from these bands
# If the price breaks these bands, don't take a trade expecting a reversal
# These bands are calculated by averaging the previous x number of days' highs and lows of the security.
2) Four Friends
HOW Does it work ?
Plotting different EMA for finding the direction of Trend / Market, There are actually 5 EMAs- F1 = 20 EMA, F2 = 50 EMA, F3 = 100EMA, F4= 150, and Trend = 200-EMA. Usually 200 EMA is used to find the trend of market whether bearish / bullish, if market is above 200 ema than we may say its bullish and below 200 ema its bearish. The 50 EMA and 100 EMA works as best pullbacks in the trending market, user can configure as per his trading style and method. This indicator can be changed to multi timeframe as required. User can plot lower time frame data onto higher time or vice-versa for finding better opportunities for early trend detection, also the user have the option to use feature of non-repainting or vice versa. The default Color MA option is un=ticked, means plotting 5 different color EMAs, If the user ticks this feature, the whole 5 EMA color will change into red or orange as per direction of closing candle, user can change color as per his / her color combination. Default plotting time is of 1 min. This second indicator is off by default - user have to tick-it to activate it
3) Fishing The Trend
HOW Does it work ?
The code uses dynamic current levels to identify trend, This indicator is using SuperTrend, ATR and relatively Smoothened ATR for
early trend reversal detection to determine the trend and direction so that a fruitful decision can be made.
To Indicate the strength of the trendline, The standard calculations of SuperTrend, along with multiple smoothen ATR results are clubbed determine the direction, a step ahead. However, the indicator is not appropriate for all the situations. It works when the market is trending. Hence it is best to use for short-term technical analysis . SuperTrend uses only the two parameters of ATR and multiplier which are not sufficient under certain conditions to predict the accurate direction of the market. Here in this indicator ATR value is not editable and after long backtests the best ATR value is kept that helps the indicator working very well.
The default setting is best for use, but user can customize the Multiplier for his own fine tunings, So once the Levels are matched, a Long / Short suggestion is plotted. Best Time Frames to use : starting from 1, 3, 5, 15, 30 Mins and so on... to determine Trend.
Long = L and Short = S.
Where and how to use?
The main use of this indicator is quick scalping and Intra-day trading. The Indicator shows the option to show Long/Short Signals which the use can be turned on or off. The indicator shows a very useful option for early detection of the ongoing trend whether there will be reversal of trend or not ?
Stop Loss - That should be done by following ones risk appetite, Ideally the High of the Previous Candle should be the stop loss for
the Long / Short but everyone has their own Risk Management Strategies based on the capital deployed.
by default this comes on..
4) Multi Time Frame - Custom VWAP.
HOW Does it work ?
VWAP = The volume weighted average price (VWAP) is a trading benchmark used by traders that gives the average price a
security has traded at throughout the day, based on both volume and price. It is important because it provides traders with insight into both the trend and value of a security.
This indicator is programmed for using vwap for spot indices / securities not having volume calculations but have futures, specially banknifty and nifty of Indian markets. User has option to change the plotting timeframe as per his requirements for checking the trend under vwap or over vwap. The user have to type the equivalent script symbol in the space provided to calculate the vwap of that particular security and plot on the non-volume script. Seems confusing !!!! have a look
at example..
eg. - if you have chart of banknifty spot and u want to place vwap on in then just write security name in the blank field banknifty future of continuous contract running month " BANKNIFTY1! " Futures Chart... that's it and u will have futures vwap plotting on spot chart... this can give user a definite idea about the vwap line. User have option to change color of bar and change color of the
vwap line which is plotted.
By default this comes off..
Note = This indicator changes bar color
5) RSI based SMA
HOW Does it work ?
# This indicator is for user using RSI, The twist is that not only it uses RSI but also simple moving average, So this makes the user more safe as it is a combination of RSI and SMA.
# Multi-colored ----> Green/Red/Yellow user can change ..moving average of choice
# user can change overbought / over sold values of RSI as required. The time frame here is fixed.
* There is an On/Off Option for each Indicator.
Disclaimer : There could be scenarios when the candle is shown as a long or short and then the candle turns into opposite direction red/green. In such scenarios , Please refer to the just preceding candle and the early detection signal and if this candle is moving into positive direction only then go for long, Similarly opposite for Short, the value of multiplier 1.0 is determined using series of back test across various assets with different time frames.
User Options : Choice of turning on / off the Long / Short Labels and early detection/StopLoss Option can also be activated or deactivated.
Visual Checks - The user could manually validate the back test results on various assets they would like to use this strategy on before putting it live.
Usage/Markets : Index Trading / Equities and also well with Commodities and Currencies
How to get access
Please click on the link / email available in the signature or send me a private message to get access.
Feedback
Please click on the link/email in the signature or send me a private message for suggestions/feedbacks.
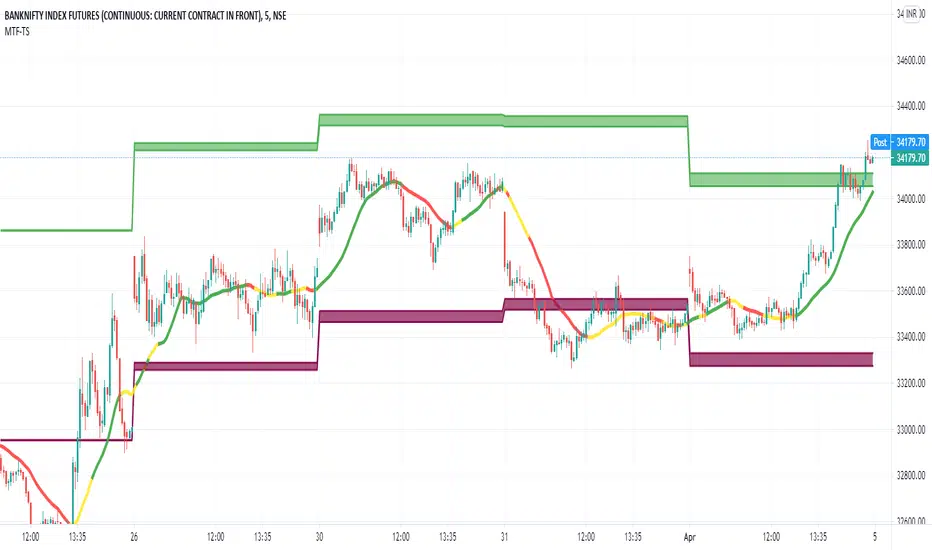
Multi Time Frame - Trade SetupsMuti Time Frame - Trade Setups
How does it work ? Price movements over range of period is used to compute the range moving forward.
As the option for wider time periods are selected more candles are selected for calculation
The Trend Line is the supporting factor to this logic and SMA20 is used as the basis of the trend line.
To Indicate the strength of the trend line , RSI is computed over multiple timeframes and then used to colour the trend line to show its strength
Once the Range is identified it can be considered as the Breakout/Breakdown zones or as the Potential Reversal Zones (PRZ)
How to Deploy / Use
As part of the Indicator there are four Choices that the user can opt for
Show Intraday Trades - This works for Intraday Trades - when the resolution is kept to less than 1 hour ( Say 3 , 5 , 10 , 15 Mins)
Show Short Term Trades - This works well when the resolution is kept to 1 Day - Good for Swing Trades spanning over a few days
Show Long Term Trades - This works well when the resolution is kept to 1 Day or Week - Good for Investments
Show Trend Line - Will show the user the Simple Moving Average 20 based on the resolution selected , The Trend Line Is a repainted based on the hybrid RSI Logic
The Trend Line would show in three colours
Green : T he Setup is in Up Trend- Try to take the trade as closer to the band as possible and when it continues to be in green ( and recommended when it would have just crossed from Red/Yellow to Green )
Red : The Setup is in Down Trend - Try to take the trade as closer to the band as possible and when it continues to be in red ( and recommended when it would have just crossed from Green/Yellow to Red )
Yellow : The Setup in sideways Trend ( a new trade isnt recommend in this band
Visual Checks - It is always recommended to enter/exit the trade it it touches crosses over the Trend Line from one side to the other
When closer to the support resistance bands , wait for a confirmation candle to determine if you are getting resistance breakout / support or breakdown
Stop Loss - That should be done by following ones risk appetite , Ideally the open/close of the previous candle should be the stop loss for the buy/sell
but everyone has their own Risk Management Strategies based on the capital deployed.
Usage/Markets : Index Trading / Equities and on proper analysis you may use it for Option Trading also. - Doesnt work that well with Commodities and Currencies
Disclaimer : There could be scenarios when the breakout/breakdown candle is rejected , especially when it is long one
so it is always recommended to have a confirmation candle that open-closes above the breakout candle / open-closes below the breakdown candle
If you like it and find it useful or if you find a defect or bug , Please let us know in the comments .. that would encouraging !! for us to develop it further
Thank you and have a beautiful and Profitable trading session !
How to get access
Please click on the link / email in the signature or send me a private message to get access
Feedback
Please click on the link/email in the signature or send me a private message for suggestions/feedbacks
Developing Range v1.0Developing Range v1.0
----------------------------
Azimuth Dynamics
Scalping tool for help finding potentially high probability reactive levels. I suggest using on a 5min chart.
GRAY BAND: yesterday's High-Low range
BLUE BAND: today's Developing Range. Mean of today's High-Low range so far and yesterday's High-Low range, this is calculated for each of today's bars
THIN BLUE LINE: the mean of today's range median and yesterday's range median.
Note: we do not use the DAILY bar via 'security()' to obtain today's high and low. This would essentially be forward looking, instead we use iteration to check from the current bar back to midnight, bar by bar. This then allows a developing range to be established as the day prints new highs and lows.
Inspired by volatility trading textbook.

Daily RangeHey traders,
at first thanks to the one and only Master Educator Stefan Kassing for sharing his legendary system with us!
And also credit to Mortdiggiddy , RootDuk and PineCoders for helping me with the script =)
This script is calculating the daily range (in pips) of the current market you are in, in relation to the last 70 days (10 weeks) .
It is used for a possible Take Profit in Stefan Kassing's System .
How to add the script to your chart:
1. Click " Add to Favorite Scripts "
-> i.imgur.com
2. Go in the Chart & click the little arrow in the upper bar and then click " Daily Range ", then the Daily Range appears in the top left corner
-> i.imgur.com
To avoid errors make sure to right-click the Y-Axis on the right side of the chart and then left-click "Scale Price Chart Only" .
-> i.imgur.com
Also be aware that the daily range is only showing up , if you are in the daily time interval or below and you are not hovering with the cursor over the past candles respectively above or below them .
If you are using this script in exotic currencypairs or uncommon other markets , the daily range can be incorrect or not showing up .
So don't hesitate contacting me , then I will try to add the markets that you want to.
To change the color or the decimal places of the number, you can click the gear in the upper left corner.
-> i.imgur.com
Happy Pips
