Volatility State Index [Interakktive]The Volatility State Index (VSI) classifies market volatility into three behavioral states: Expansion, Decay, and Transition. It answers one question visually: Is volatility supporting price movement, withdrawing, or unstable?
Unlike traditional volatility indicators that show levels or bands, VSI diagnoses the current volatility regime so traders can adapt their approach accordingly.
█ WHAT IT DOES
• Classifies volatility into three states: Expansion (teal), Decay (grey), Transition (amber)
• Measures volatility momentum as a percentage rate-of-change
• Applies stability filtering to detect unstable/choppy conditions
• Uses persistence logic to prevent state flickering
• Exports state data for use in alerts and strategies
█ WHAT IT DOES NOT DO
• NO buy/sell signals
• NO entry/exit recommendations
• NO alerts (v1 is diagnostic only)
• NO performance claims
This is a volatility diagnostic tool, not a trading system.
█ HOW IT WORKS
The VSI processes volatility through a five-stage pipeline:
STAGE 1 — Base Volatility
Calculates ATR as the foundation for volatility measurement.
STAGE 2 — Smoothing
Applies EMA smoothing to reduce noise in the volatility series.
STAGE 3 — Volatility Momentum
Computes the percentage rate-of-change of smoothed volatility:
Volatility Momentum (%) = ((Current ATR - Previous ATR) / Previous ATR) × 100
Positive values indicate expanding volatility; negative values indicate contracting volatility.
STAGE 4 — Stability Filter
Tracks how frequently volatility momentum changes direction. Frequent sign changes indicate unstable, choppy conditions.
Stability Score = 1 - (Average Flip Rate)
Low stability forces the Transition state regardless of momentum level.
STAGE 5 — State Classification
Combines momentum thresholds and stability to determine the final state:
• Expansion: Momentum ≥ +5% (default threshold)
• Decay: Momentum ≤ -5% (default threshold)
• Transition: Between thresholds OR low stability
A persistence filter requires states to hold for multiple bars before confirming, preventing visual noise.
█ INTERPRETATION
EXPANSION (Teal)
Volatility is increasing in a sustained way. Price moves are becoming larger.
What it suggests:
• Breakouts are more likely to follow through
• Stops may need wider placement
• Trend-following approaches tend to work better
• Mean-reversion weakens
DECAY (Grey)
Volatility is decreasing. Price is compressing into tighter ranges.
What it suggests:
• Breakouts are more likely to fail
• Ranges tend to hold
• Trend-following underperforms
• Mean-reversion strengthens
TRANSITION (Amber)
Volatility behavior is unclear or unstable. This is NOT neutral — it is uncertainty.
What it suggests:
• Mixed signals — one bar huge, next bar dead
• Higher whipsaw risk
• Reduced conviction in either direction
• Consider waiting for clarity
The key insight: Amber is a warning, not a middle ground. It appears when volatility cannot decide what it wants to do.
█ VISUAL DESIGN
The indicator uses a state-first histogram design:
• Histogram height shows volatility momentum percentage
• Histogram color shows the classified state
• Zero line provides visual anchor
• Optional momentum line for confirmation
• Optional background tint (default OFF for clean charts)
The visual hierarchy prioritizes instant state recognition. A trader should understand the volatility environment in under one second without reading numbers.
█ INPUTS
Core Settings
• ATR Length: Base volatility measurement period (default: 14)
• Smoothing Length: EMA smoothing applied to ATR (default: 10)
• Momentum Length: Rate-of-change lookback (default: 10)
State Classification
• Expansion Threshold (%): Momentum above this = Expansion (default: 5.0)
• Decay Threshold (%): Momentum below this = Decay (default: -5.0)
• Persistence Bars: Bars required to confirm state change (default: 3)
• Stability Lookback: Window for stability calculation (default: 20)
• Stability Threshold: Below this = forced Transition (default: 0.5)
Visual Settings
• Show State Histogram: Toggle main display (default: ON)
• Show Momentum Line: Thin confirmation line (default: OFF)
• Show Zero Line: Baseline reference (default: ON)
• Show Background Tint: Subtle state coloring (default: OFF)
█ DATA WINDOW EXPORTS
When enabled, the following values are exported:
• ATR (Raw)
• ATR (Smoothed)
• Volatility Momentum (%)
• Stability Score (0-1)
• State (-1/0/1): Decay = -1, Transition = 0, Expansion = 1
• Is Expansion (0/1)
• Is Decay (0/1)
• Is Transition (0/1)
These exports allow VSI to be used as a filter in Pine Script strategies or alert conditions.
█ ORIGINALITY
While ATR and volatility indicators are common, VSI is original because it:
1. Classifies volatility into behavioral states rather than showing raw levels
2. Applies momentum analysis to volatility itself (rate-of-change of ATR)
3. Uses stability filtering to detect genuinely unstable conditions
4. Implements persistence logic to prevent state flickering
5. Provides a state-first visual design optimized for instant recognition
VSI is state-first: it classifies volatility regimes (Expansion/Decay/Transition) rather than plotting volatility level alone, using momentum and stability to reduce false regime reads.
This is not a modified ATR or Bollinger Band — it is a volatility regime classifier.
█ SUITABLE MARKETS
Works on: Stocks, Futures, Forex, Crypto
Timeframes: All timeframes — state classification adapts accordingly
Best on: Instruments with consistent volatility patterns
█ RELATED
• Market Efficiency Ratio — measures price path efficiency
• Effort-Result Divergence — compares volume effort to price result
█ DISCLAIMER
This indicator is for educational purposes only. It does not constitute financial advice. Past performance does not guarantee future results. Always conduct your own analysis before making trading decisions.
Decay

ChartRage - ELMAELMA - Exponential Logarithmic Moving Average
This is a new kind of moving average that is using exponential normalization of a logarithmic formula. The exponential function is used to average the weight on the moving average while the logarithmic function is used to calculate the overall price effect.
Features and Settings:
◻️ Following rate of change instead of absolute levels
◻️ Choose input source of the data
◻️ Real time signals through price interaction
◻️ Change ELMA length
◻️ Change the exponential decay rate
◻️ Customize base color and signal color
Equation of the ELMA:
This formula calculates a weighted average of the logarithm of prices, where more recent prices have a higher weight. The result is then exponentiated to return the ELMA value. This approach emphasizes the relative changes in price, making the ELMA sensitive to the % rate of change rather than absolute price levels. The decay rate can be adjusted in the settings.
Comparison EMA vs ELMA:
In this image we see the differences to the Exponential Moving Average.
Price Interaction and earlier Signals:
In this image we have added the bars, so we can see that the ELMA provides different signals of resistance and support zones and highlights them, by changing to the color yellow, when prices interact with the ELMA.
Strategy by trading Support and Resistance Zones:
The ELMA helps to evaluate trends and find entry points in bullish market conditions, and exit points in bearish conditions. When prices drop below the ELMA in a bull market, it is considered a buying signal. Conversely, in a bear market, it serves as an exit signal when prices trade above the ELMA.
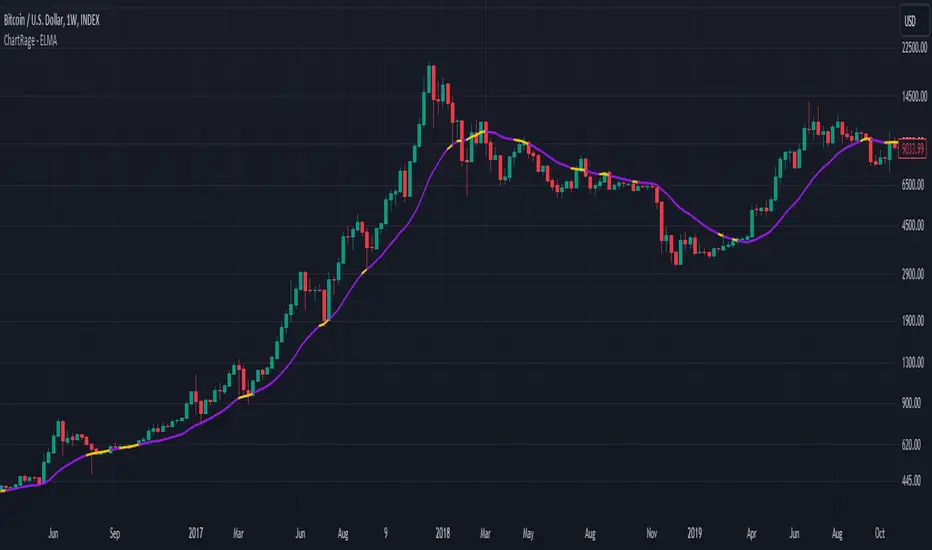
Volatile Markets:
The ELMA works on all timeframes and markets. In this example we used the default value for Bitcoin. The ELMA clearly shows support and resistance zones. Depending on the asset, the length and the decay rate should be adjusted to provide the best results.
Real Time Signals:
Signals occur not after a candle closes but when price interacts with the ELMA level, providing real time signals by shifting color. (default = yellow)
Disclaimer* All analyses, charts, scripts, strategies, ideas, or indicators developed by us are provided for informational and educational purposes only. We do not guarantee any future results based on the use of these tools or past data. Users should trade at their own risk.
This work is licensed under Attribution-NonCommercial-ShareAlike 4.0 International
creativecommons.org
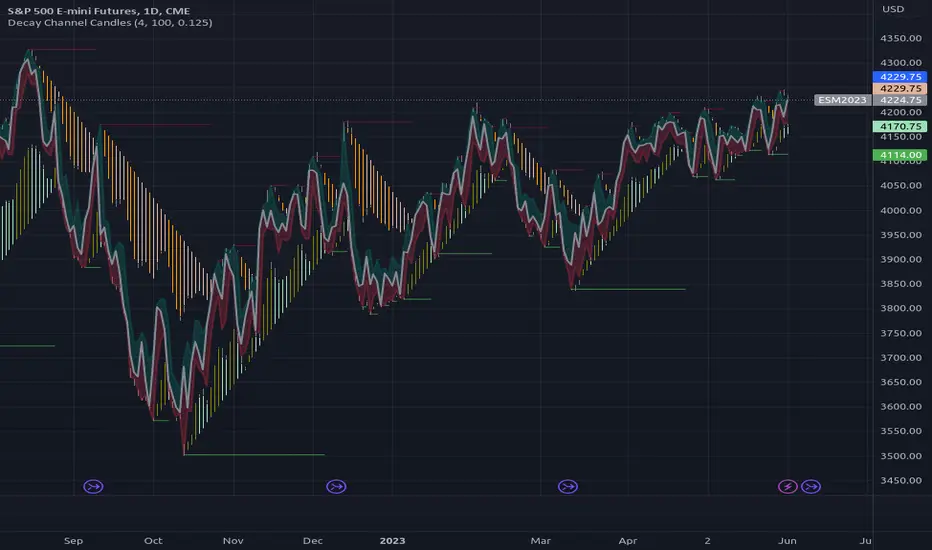
Vector Flow ChannelA decay channel that allows multi stage setup for timed events.
update to V5:
and

MidlinesA sibling indicator of "Midline Oscillator".
Historical high/low/midlines overlay price action, showing how the "Midline Oscillator" works.
See the comments at the beginning of the script for a complete description.
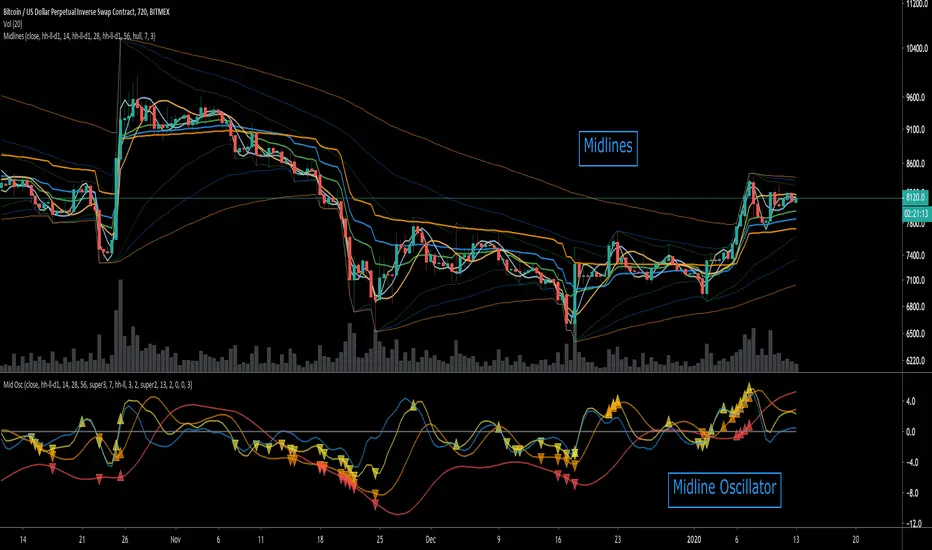
Midline OscillatorA centered oscillator that rethinks the Stocastic Oscillator (and others).
The midline of historical price is used to calculate the percentage of the current price relative to the midline.
See the comments at the beginning of the script for a complete description.

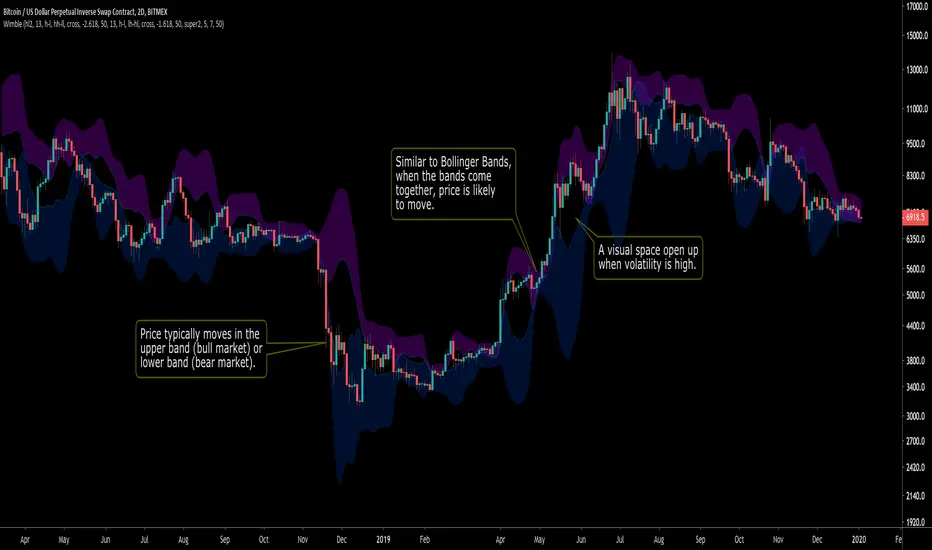
WimbleA standard deviation toolbox. Highly configurable.
Inspired by Bollinger Bands, Wimble creates two bands (from standard deviation) for visually clarity of price movement.
See the comments at the beginning of the script for a complete description.
Function Linear Decay V2EXPERIMENTAL:
improved range detection (it now locks range when its last formed on the appropriate side improving readability as it doesnt auto adjust when opposite extreme moves)

[RS]Decay Channel Candles V0EXPERIMENTAL: Experiment using Linear Regression based on %atr for decay(decay option is a mutiplier for the atr).