Liquitive Buy/Sell Dollar AveragerLiquitive Buy/Sell Dollar Averager Indicator
The "Liquitive Buy/Sell Dollar Averager" is a versatile trading tool designed for intraday and multi-timeframe analysis, combining advanced range-bound calculations, RSI normalization, volume spikes, and candle pattern recognition to identify optimal buy and sell conditions. This indicator is particularly suitable for traders employing strategies that focus on dollar-cost averaging, position scaling, and systematic buy/sell decision-making.
Key Features:
Adaptive RSI-Based Levels:
Dynamically calculates inner bounds (IB) and outer bounds (OB) using RSI and price ranges, helping to identify overbought and oversold conditions relative to the price action.
Normalizes RSI values to the price range for seamless visualization overlaid on the chart.
Volume and Candle Analysis:
Detects significant volume spikes relative to a moving average, signaling increased market activity.
Identifies spiking green/red candles to capture momentum-driven price movements.
Dynamic Support and Resistance:
Calculates and plots support and resistance levels based on recent swing highs and lows.
Median and boundary lines help visualize key price levels for decision-making.
Profitability Check:
Buy and Sell Signals:
Checks profitability thresholds based on percentage gains/losses.
Incorporates logic for "time to buy" and "time to sell" using target profit margins.
Implements average move percentage to define realistic thresholds for buy/sell actions.
Time-Based Trading Restrictions:
Configures trading logic to disallow trades after a specific time (e.g., 3:40 PM for intraday sessions).
Ensures logical entry and exit decisions are only made within active trading hours.
Color-Coded Visualization:
Background colors dynamically shift between green (bullish), red (bearish), and neutral, depending on RSI and price position relative to the inner bounds.
Opacity of the background adjusts based on normalized RSI differences to provide a visual cue of market strength.
Customizable Parameters:
Allows user input for key settings like lookback periods, RSI length, percent ranges, volume thresholds, and transparency levels, enabling flexible configuration tailored to individual strategies.
Actionable Alerts and Signals:
Plots "Open Position", "Add to Position", and "Close Position" markers directly on the chart, making it easy to follow systematic trading rules.
How It Works:
Buy Signals:
Triggered when price conditions, volume spikes, and RSI-based thresholds align with profitability metrics.
Designed for dollar-cost averaging, identifying opportunities to add to long positions or open new positions.
Sell Signals:
Evaluates profitability conditions to identify when to close or scale out of positions.
Incorporates real-time evaluation of market momentum and profitability.
E-DOLLAR

Average purchase price 0.1 [PATREND]
Average purchase price
This tool calculates the average purchase and sell price and the profit/loss ratio for the selected symbol based on the user's inputs for the purchase and sell prices and the entry and exit amounts.
Using Average purchase price with DCA strategy
This tool can be used to track the performance of your dollar cost averaging (DCA) investment strategy.
This tool allows you to enter information about your purchase and sell transactions, such as the purchase and sell price and the entry and exit amount, and it calculates the average purchase and sell price and the profit/loss ratio based on this information.
When using a DCA strategy, you can enter information about your regular purchase and sell transactions and the tool will calculate the average purchase and sell price for you.
You can use this information to determine if your strategy is working well and make the necessary adjustments.
In addition, this tool can help you determine when you should increase or decrease the regular investment amounts that you make as part of your DCA strategy.
It can also show you the profit/loss ratio for each sell transaction that you made.
_________________________________
We hope you find it useful.
Don't hesitate to try this tool and customize its settings to meet your trading needs.
We look forward to seeing your opinions and comments.
______________________________________________________________________________________________________
Average purchase price
هذه الأداة تحسب متوسط سعر الشراء والبيع ونسبة الربح / الخسارة للرمز المحدد بناءً على إدخالات المستخدم لأسعار الشراء والبيع ومبالغ الدخول والخروج.
استخدام Average purchase price مع استراتيجية DCA
يمكن استخدام هذه الأداة لتتبع أداء استراتيجية الاستثمار المتوسط التكلفة الدولارية (DCA) الخاصة بك.
تتيح لك هذه الأداة إدخال معلومات عن عمليات الشراء والبيع الخاصة بك، مثل سعر الشراء والبيع وكمية الدخول والخروج، ويقوم بحساب متوسط سعر الشراء والبيع ونسبة الربح / الخسارة بناءً على هذه المعلومات.
عند استخدام استراتيجية DCA، يمكنك إدخال معلومات عن عمليات الشراء والبيع المنتظمة التي تقوم بها وستقوم الأداة بحساب متوسط سعر الشراء والبيع لك. يمكنك استخدام هذه المعلومات لتحديد ما إذا كانت استراتيجيتك تعمل بشكل جيد وإجراء التعديلات اللازمة.
بالإضافة إلى ذلك
يمكن لهذه الأداة مساعدتك في تحديد متى يجب عليك زيادة أو تقليل مبالغ الاستثمار المنتظمة التي تقوم بها كجزء من استراتيجية DCA. كما يمكنها أن تظهر لك نسبة الربح / الخسارة في كل عملية بيع قمت بها.
تصرف كخبير ترجمه مختص باسواق المال وترجم هذا النص للغه الانكليزيه بشكل دقيق
_________________________________
نأمل أن تجدوه مفيدًا لكم .
لا تترددوا في تجربة هذه الأداة وتخصيص إعداداتها لتلبية احتياجاتكم التداولية.
نتطلع إلى رؤية آرائكم وتعليقاتكم .

Fiat Currency and Gold Indices (FGXY) CandlesA modification of my previous indicator "Crypto Index (DXY) Candles". The idea was to create a similar currency basket to the standard DXY, but from the perspective of other currencies. Still using the standard DXY weights, this indicator allows you to create a tailored index for other currencies, provided that a currency pair exists for each of the 6 components. This means that even currencies that aren't included should work in theory; just find the 3 character currency prefix used by tradingview and give it a shot! This indicator is useful for gauging how well countries/currencies are holding up and when paired with the standard DXY may help see potential inflection points. For use on longer time frames (~1h-~3d) as some of the data being pulled seems to have issues on lower timeframes.
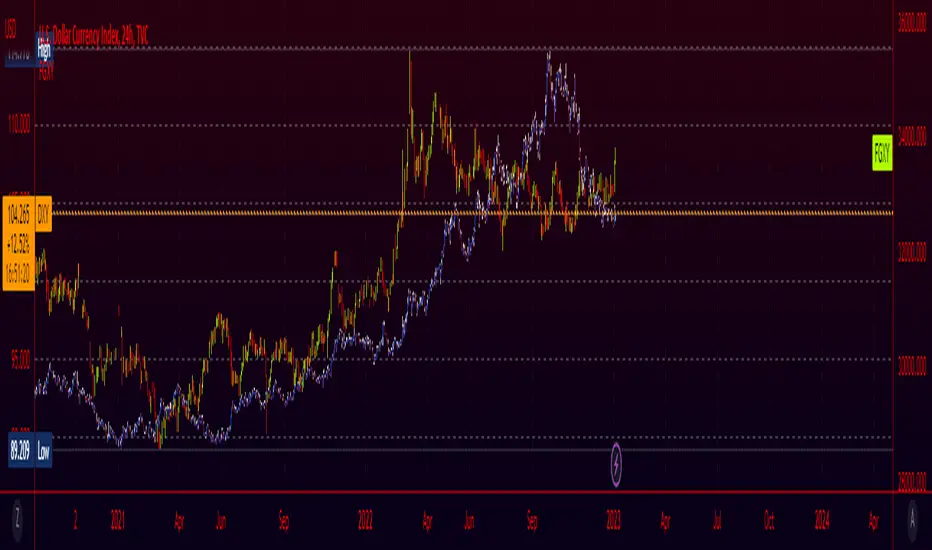
[RS]Dollar Composite IndexExperimental:
a composite of the dollar index with equal weights.
this is a repost of:
www.tradingview.com
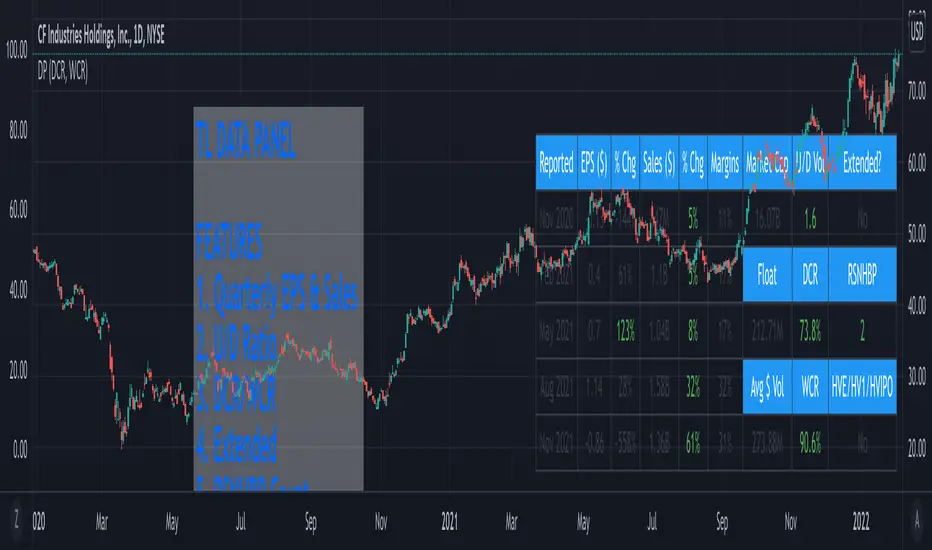
TL Data PanelIntroducing the TraderLion Data Panel
Features
1. Plot Quarterly EPS & Sales in a table. Disclaimer | TradingView data for EPS & Sales can be highly inaccurate in some cases.
2. U/D Ratio - Calculates the Up/Down Volume Ratio on a 50 Day Average or 20 Day Average. A number above 1.5 will show in green.
3. DCR - Calculates the Daily Closing Range for the stock. It's green when the DCR is greater than your benchmark (set in indicator settings) and greater than 50%.
4. WCR - Calculates the Weekly Closing Range for the stock. It's green when the DCR is greater than your benchmark (set in indicator settings) and greater than 50%.
5. Extended - Calculates if the stock is extended vs the 10DMA and 10WMA. The output will be Yes or No.
6. RSNHBP Count - Counts the number of RSNHBP in the past 30 sessions. Higher the count the better the odds of a stock performing well in the markets.
7. HV Stats - This shows if a stock meets the HVE/HV1/HVIPO criteria. HVE - Highest Volume Ever. HV1 - Highest Volume in One Year. HVIPO - Highest Volume Since IPO.
Customizations
Up Down Volume Length - Toggle between 50 Day or 20 Day.
Average $ Volume Length - Toggle between 50 Day or 20 Day.
Closing Range Benchmark - Set your benchmark vs any index.
RS Benchmark - Calculate RSNHBP benchmark vs any index.
Table Size - Tweak table size on personal preference.
Table Position - Tweak table position to top right, bottom left, bottom right, or top left.
Margins vs ROE - Toggle this setting to display Margins or ROE.
Color Theme - Toggle between Light or Dark Theme.
If you have any questions, please post them in the comments below!
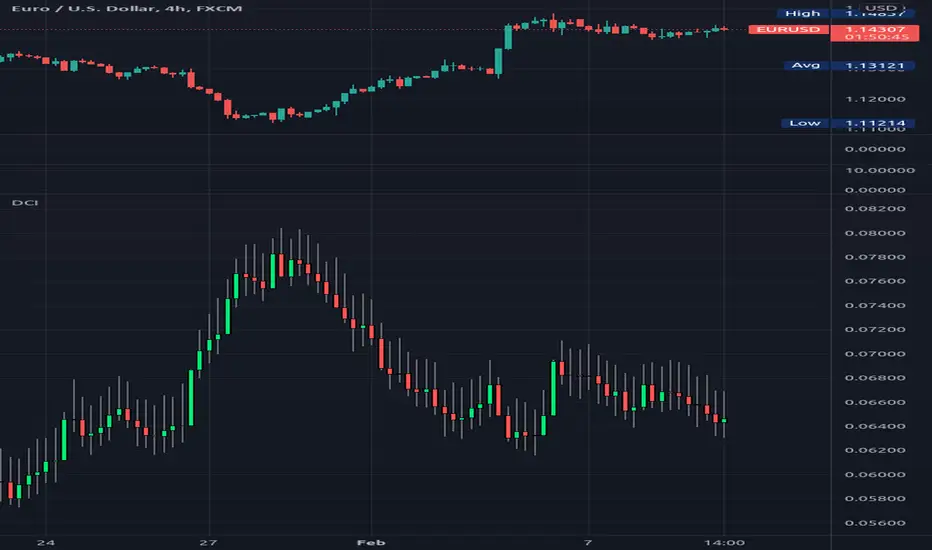
DCA Bot IndicatorName: DCA Bot Indicator
Category: Dollar Cost Average.
Operating mode: Alerts at a specific time, day of the week and day of the month.
Trades duration: N/A.
Timeframe: 1H
Suggested usage: long-term investing DCA strategies.
Entry: Only indicates the time and then the day of the week or the day of the month to buy.
Exit: As per long-term Investor’s strategy.
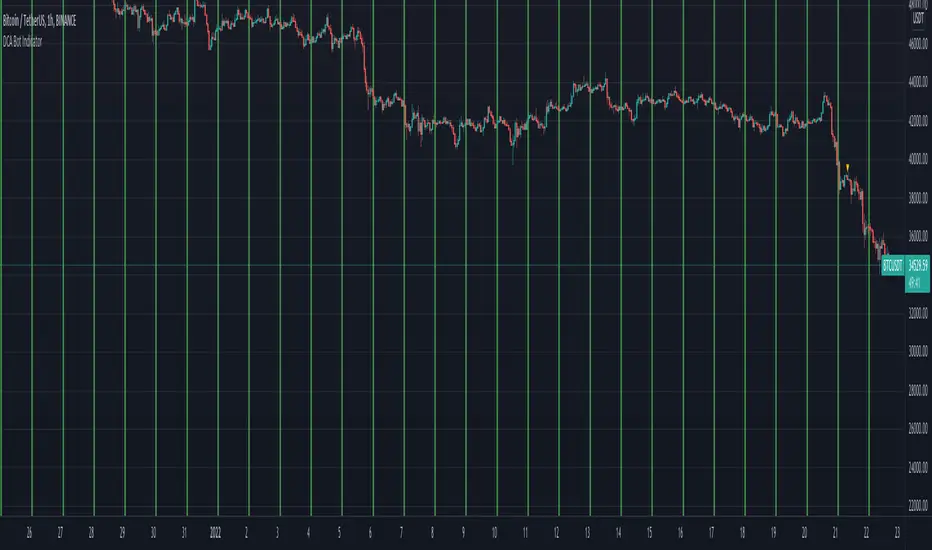
Usage: If you want to perform a Dollar Cost Averaging approach with:
- Daily purchases (at a specific time)
- Weekly purchases (at a specific time and day of the week)
- Monthly purchases (at a specific time and day of the month)
It is then possible to set the alert text with a preferred message or for use with trade automation systems. The green background identify the specific time chosen.
It is possible to identify through the Bias Analyzer the best time for the daily purchase.
Configuration:
- Buy Time: hour you would like to buy, please consider that the script is executed at the end of the defined time, so if you would like to buy at 2, have to put 1.
- Buy only Days of the Week: you can select the day you want.
- Buy only on Day of Month, you can specify a specific day.
Credits:
- dsteaves for inspiration
{Gunzo} Stock to Flow (Gold, Silver, Dollar, Bitcoin)This indicator displays the Stock to Flow (S2F) ratio for popular commodities (Gold, Silver, Dollar, Euro, Bitcoin, Ethereum) in order to
compare them and determine which ones could be a good Store of Value (SoV).
OVERVIEW :
Stock to Flow is a popular indicator used to predict commodities scarcity. It evaluates the total stock of a commodity against the total amount that can be produced during a year. This model supposes that if scarcity is increasing, the price is going to increase.
This model has been used over the last years on Bitcoin to determine if the asset was undervalued or overvalued, and even make prediction models on the future price.
This script is going to focus on the Stock to Flow ratio (total stock/amount produced) to compare the following assets over time :
Mining resources (mined) for Gold and Silver
Cryptos assets (mined) for Bitcoin and Ethereum
FIAT currencies (banknotes printed) for Dollar and Euro
CALCULATION :
The calculation of the Stock to Flow ratio evaluates the total stock of a commodity produced against the production made for a specific year. The data is calculated on a yearly basis, then interpolated to get monthly or daily values.
DATA ORIGIN :
The main information needed to calculate the Stock to Flow ratio is the "yearly production" of a commodity. I tried to retrieve that information from the most reliable sources :
for Gold from research on www.gold.org
for Silver from research on www.silverinstitute.org
for Ethereum from research on etherscan.io
for Bitcoin from data source "QUANDL:BCHAIN/TOTBC" from www.quandl.com
for Dollar from research on www.federalreserve.gov
for Euro from research on www.ecb.europa.eu
SETTINGS :
Smoothing for interpolated data : Smoothing factor for assets that are calculated yearly and then interpolated (Gold, Silver, Dollar, Euro, and Ethereum)
Smoothing for non interpolated data : Smoothing factor for assets that are calculated daily and not interpolated (Bitcoin)
Display asset names : Display assets names in a colored rectangle on the right side of the chart
Display asset values : Display assets Stock to Flow ratio in a colored rectangle on the right side of the chart
Display key events for assets : Display important events for the assets at the bottom of the chart using the same color as the assets lines (for example Orange diamond is a Bitcoin halving). Please refer to the script code for the details of all events.
USAGE :
This script can be used on any asset available on TradingView as the data used is either static or external.
However I recommend using it the Gold asset from currency.com as the depth of the chart will be bigger (since 1980s).
It is recommended to used this script on the monthly timeframe as the chart data is calculated yearly and then interpolated.

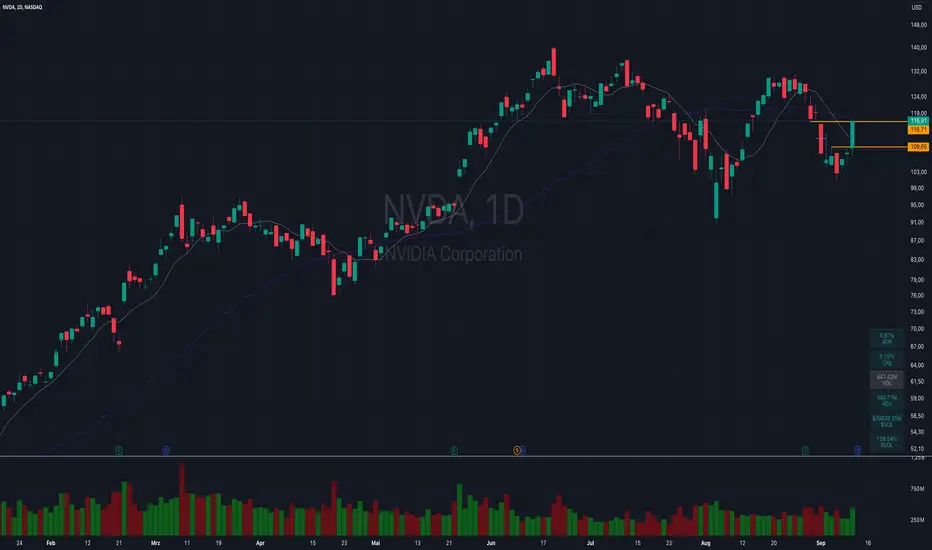
Ticker Dashboard For Better Stock SelectionHey, this indicator will help you with your stock selection. The goal is to focus on stocks that move (higher ADR) and provide enough liquidity which means less risk.
ADR - Average Daily Range in % (measured from High to Low - does not include gaps like ATR does / Threshold color can be adjusted from input)
%Change - Current % change from prior close price
Vol- Todays Volume in MIO
ADV- Average Daily Volume in MIO - default set to 1 month (20 days, can be changed from input - Colored red if < 1 MIO)
$VOL- Dollar Volume - Average Daily Volume multiplied with the last daily close price. Important for liquidity issues.

XU030 USD Purchasing Power ~ Sarp GokdagWhere & How-To Use This Indicator?
This indicator is respectively composed for BIST:XU030 .
In matter, the user decides to use this indicator other than BIST:XU030 , the output of the indicator could be shown wrong.
What is it about?
It shows the purchasing power of BIST:XU030 against United States Dollar.
Although BIST:XU030 have tested new high's repeatedly since 2013, BIST:XU030 's returns on USD have been weakening since then.

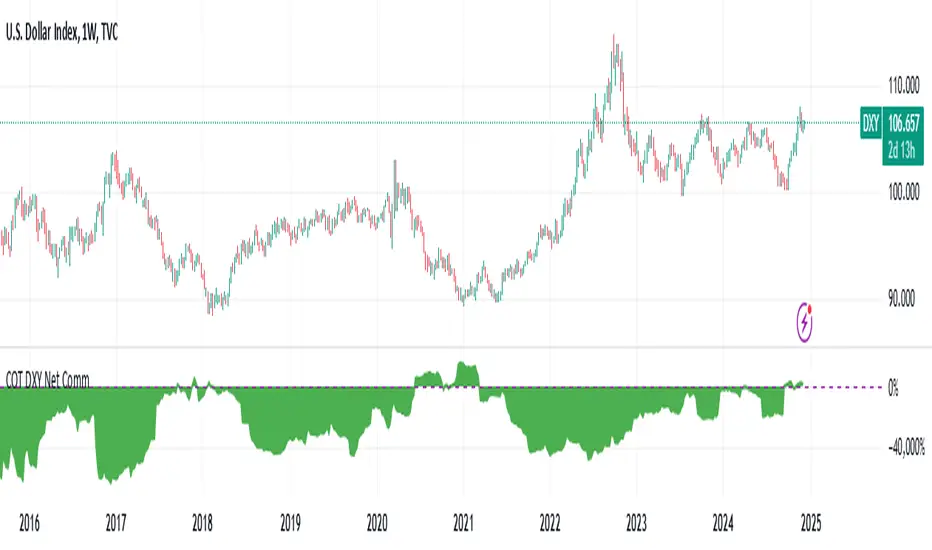
DXY COT Commercial Net PositionsThis script was created due to the lack of position of US Dollar Index Futures (DXY).
It is designed to perform a much more liquid and inclusive position analysis.
As the exponential ratios do not mean anything to positions, weights are used as multipliers instead of exponential functions.
Swedish Krona (SEK) Futures are not directly quoted in Quandl, therefore weighted in Euro / dollar parity.
By perceiving these positions as inverse correlations, you can also identify where the world economy is doing well.
COT Commercial Net Positions are calculated as (Short - Long) because of Commercials act according to the reverse of the market.
In this way, you can follow up normally instead of reverse correlation.
Because except in extreme cases, in which case capitals usually shift to Gold.
This is not the case, since there is no capital inflow to other currencies, it is not a strong sell position to the dollar index.
When there is a shift in bonds, we see the effect of the dollar in general.
I created for the Dollar Index in order not to deviate from the concept.
I wanted to share it with everyone as I thought that you have important clues about how investors take positions.
Modified currency weights :
Euro : % 61.8
Japanese Yen : % 13.6
British Pound : %11.9
Canadian Dollar : % 9.1
Swiss Franc : % 3.6
NOTE : You can use it for all instruments except crypto coins, especially US Dollar Index (DXY).
Since the COT data is taken, it will not repaint in 1 week (1W) timeframe.
The log can also be repaint according to the time of data publication.
It will repaint in lower time frames.
I hope it will help your analysis and your scripts,regards.
Volume & Dollar BarsThis scriptlet is a part of an ongoing project and attempts at volume and dollar bar identification. The original idea is taken from excellent books 'Hands-On Machine Learning for Algorithmic Trading' (2019) by Stefan Jansen and 'Advances in Financial Machine Learning' (2018) by Marcos Lopez de Prado.
Statement of Purpose
I am an advocate of Open source and against those who publish their code with a lock icon. My code and ideas are aimed at people with critical thinking, who are able to take an informative and responsible decision when it comes to investing their funds. I do not guarantee that all of my ideas will perform well. As usual, they require a certain degree of your sound judgment. My final aim is to provide you with coding techniques that you could use in your own scripts and strategies.

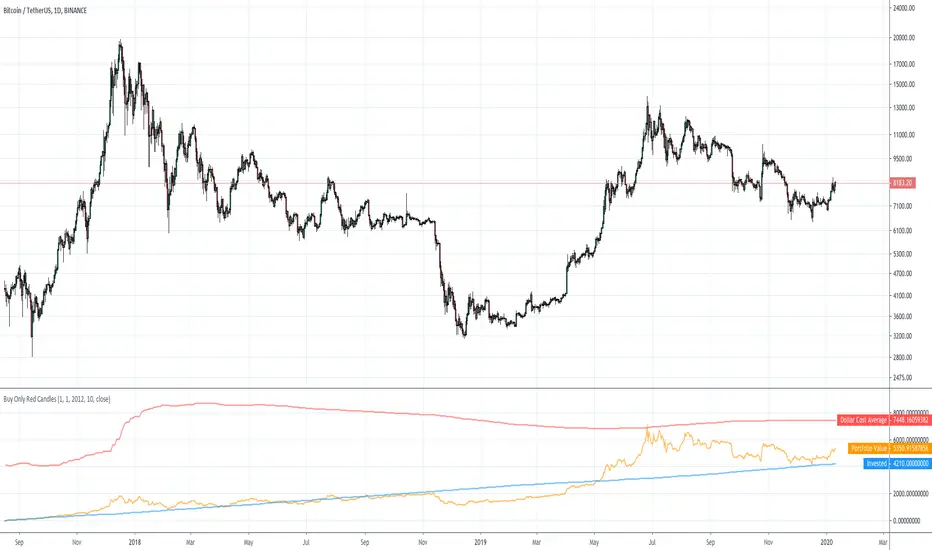
Dollar Cost Averaging Only Red CandlesThis just shows you the results if, for example, you bought the closing price each day that formed a red candle.
Works on other timeframes than daily.
In the options you can set your own start date, as well as the dollar amount to spend on each buy.
Displays your dollar cost average, total invested, and total portfolio value over time.
Bitmex Dollar Value CalculatorWith this indicator you can easily calculate either the bitcoin value of a certain amount of dollars or the dollar value of your bitcoin (particularly helpful when trading on bitmex)
Tipjar : 38uGQJDDZDL6wX48x4gYTccPeQ3ZHVYmY4 (btc)

BTC Dollar VolumeVolume conversion indicator for coins traded to USD value. Does not work on exchanges with dollar volume already displayed. Will be updated with new features.

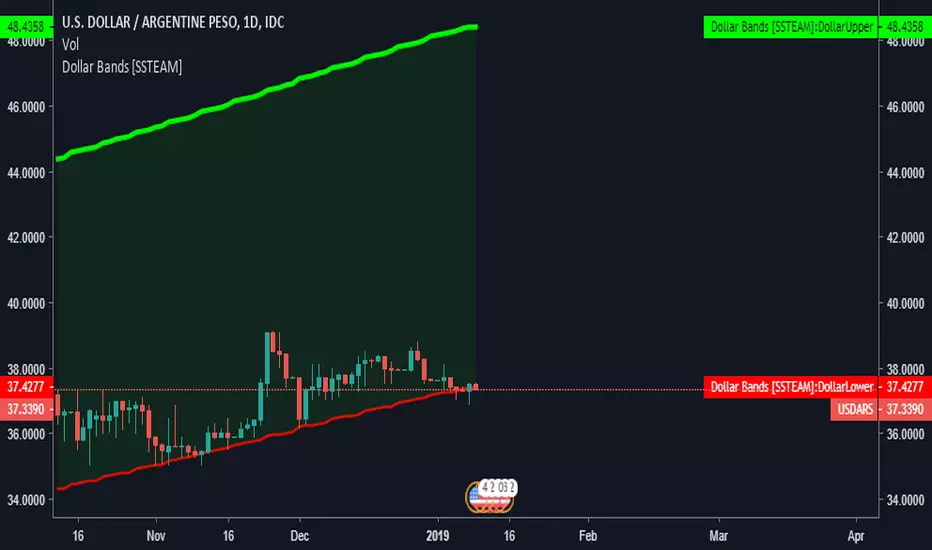
Bandas Dolar [SSTEAM]Channel for the Argentine dollar defined by the president of the BCRA Guido Sandleris.
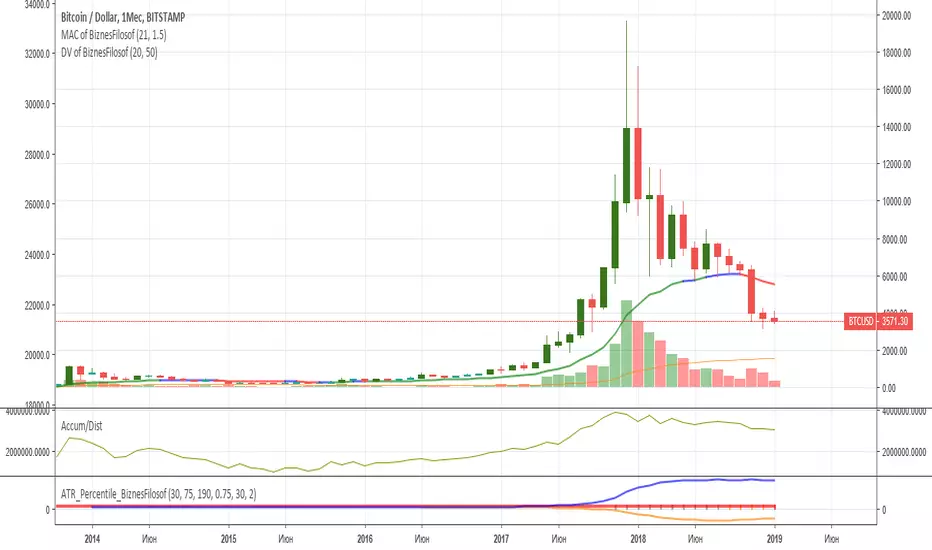
Dollar Volume of BiznesFilosofI am infuriated with the wrong volumes. Because I decided to make my indicator with the true volume in dollars. I will tell about it in more detail on my channel in YouTube.
===
Меня бесят неправильные объемы. Потому, я решил сделать свой индикатор с истинным объемом в долларах. Подробней о нём расскажу на своём канале в Ютуб.
OJLJ Sintetic USD IndexThis script uses information of the principal USD pairs to create an Index:
(A). USDCAD chart is going up very fast, but If we see the USD INDEX we can see that the dollar is not doing the same.
(X). While USDCAD chart goes up with problems making investors to be afraid of a change the USD INDEX shows a normal and very stable increase
(Y). The USDCAD chart shows an importante decrease but after some time it goes to the initial position, the USD INDEX dont go down because the dollar force is the same, this means that the canadian dollar force has increase too
The mathematic methodology is private, but it uses percentile changes to be calculated and I have made some tests to make sure that results work perfectly fine, If you want to know more about the calculation or the test I have made, please send me a message
This indexes offer a way to:
+ Measure changes in an economy without being compared with another as the Forex pairs do
+ Analyze macroeconomic variables in the exchange rate of a determinate economy
+ Use candles instead of lines
+ The script have an input option were you can decide if use wicks or not (Not recomendable)
+ White color means it goes up while red means it goes down
+ The script works perfectly with all the time frames
+ Itcan be used with all the Forex pairs that include USD
Because of all the data used to be calculated this script normally compile after 10-20 seconds
I thought a lot about it and I did a lot of tests, Technical Indicators don’t work the same way that Forex, this index were created and published principaly for users who have more interest in the Fundamental analysis but It can be useful for everyone
Do you like this Index or have any Ideas ? Please let me know with a comment :)

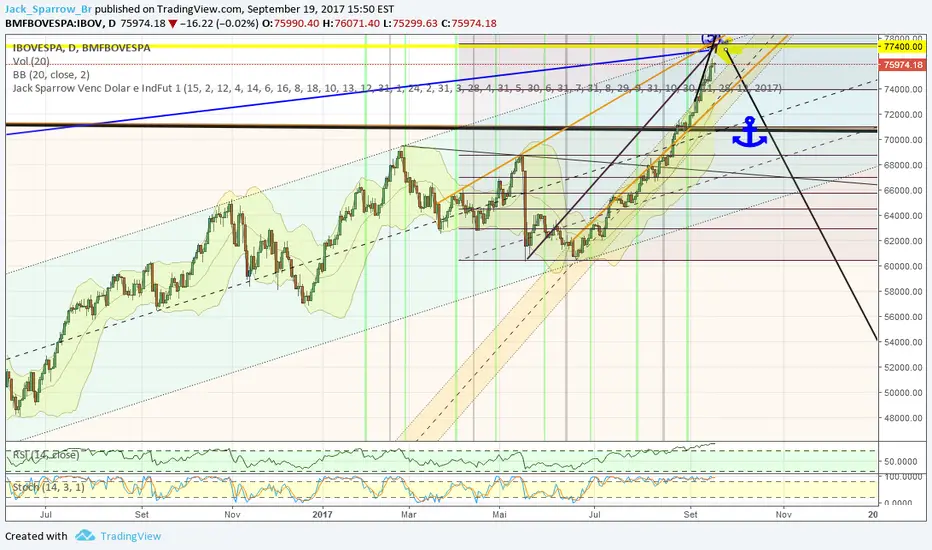
Jack Sparrow Venc Dolar e IndFut 2017Script que marca os Vencimentos de Dólar e Índice Futuro do Ibovespa.
Em Verde são os vercimentos do Dólar , uma por mês totalizando 12.
Já em Cinza os vencimentos do Índice Futuro , são 6 datas ao longo do ano.
Caso tenha algum valor incorreto, favor comunicar.
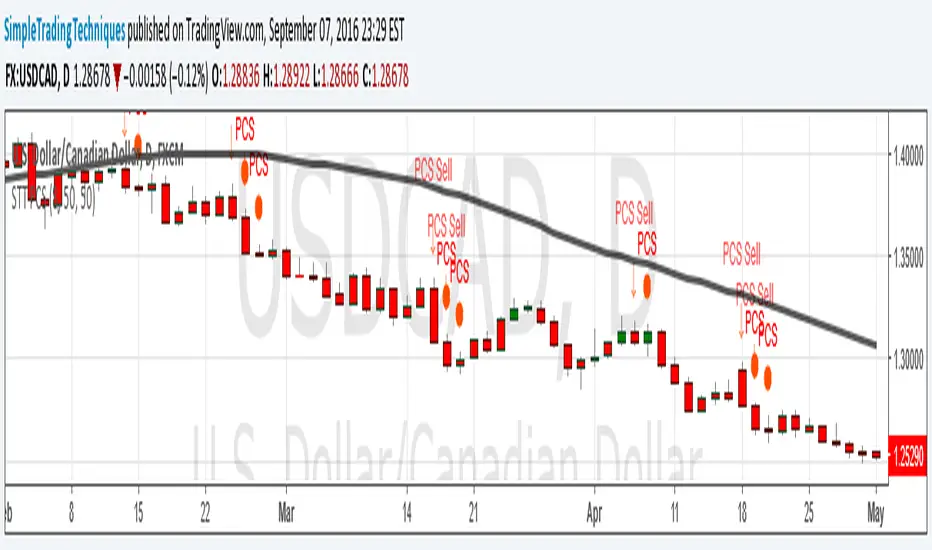
PULLBACK CANDLESTICK STRATEGY BY SIMPLE TRADING TECHNIQUESArrow represent trade setup
Circle represent triggering of the trade
--------------------------------------------------------------------
1. Where to place stop loss?
2. Where to exit the trade?
3. How to protect gains in your trade?
4. How to apply money management rule?
5. How to trade gap opening?


Dollar normalized volumeAn indicator that multiply the closing price with the current volume. (close X volume)
This will show the relative interest in the underlying asset regardless of the price change over time. For the case of FXCM, when the price fell from $16 to $1, its volume spiked 16x at the same time given the fact that 16x more shares can now be purchased with the same amount of dollar.
Enjoy! and remember to give a thumbs up.
