Ace Pro Short Indicator - 1 Minute ETHUSD Ethereum ChartThe Ace Pro Short - 1 Minute ETHUSD calculates overbought and oversold conditions.
It focuses on momentum to identify whether the market is overbought or oversold.
If it detects that the market is overbought, it gives an alert of “Short Entry”
If it detects that the market is oversold, it gives an alert of “Short Exit"
Users are also able to set notifications on Tradingview with this version of the indicator.
To set an alert, after adding the indicator, at the top left of the chart where the indicator is listed, click on the "more" option (three dots), and then select "Add alert."
PLEASE NOTE THE FOLLOWING:
THE ACE PRO SHORT - 1 MINUTE ETHUSD INDICATOR IS DESIGNED ONLY FOR USE ON THE 1 MINUTE BITSTAMP ETHUSD CHART.
It is only to be used for opening and closing short positions.
It is not recommended for use with long positions.
It is not recommended for use with time frames other than the 1 minute.
In a sideways market, or during a violent move, it is likely to produce false signals.
Traders must use confluence from their technical analysis to enter trades.
Traders must use confluence from their technical analysis to enter trades.
The Ace Pro Short ETHUSD 1 minute has been designed to prioritize successful trades over number of trades.
E-signal

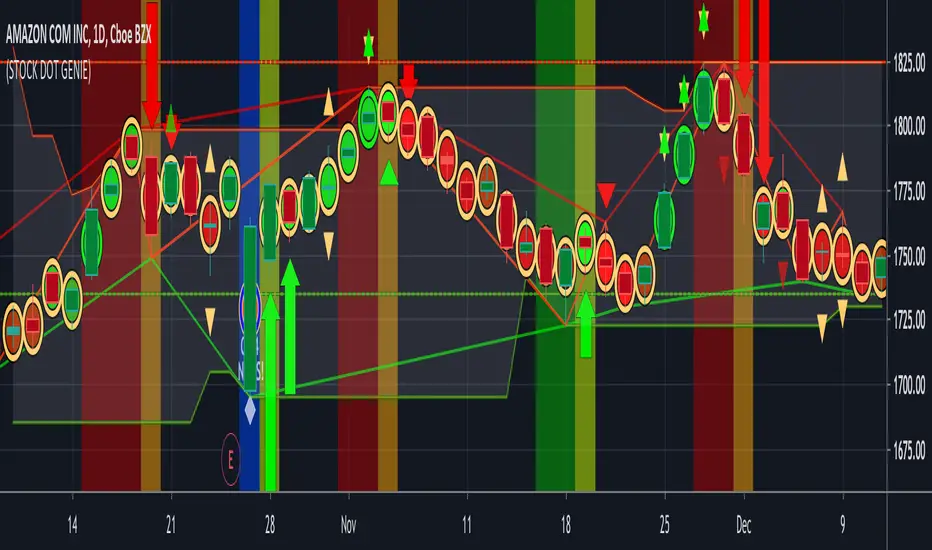
(6) Stock Dot Genie VS-369StockDotGenie (SDG) provides to new, novice and experienced traders, a Graphical User Interface that could have been the basis for a modern video game. This was intentional to provide clear and unambiguous signals that are always easy to understand and act upon. The primary goal of SDG is to distill complex Technical Analysis concepts into quickly recognizable, easy to understand icons and flags. Each of these icons is indicating an important change or status in this stocks technical picture with the computer, not you, doing the analysis. Think of it as a Technical Analysis Autopilot. The pilot is still required to be in control, but the autopilot is handling all of the background calculations freeing the pilot to concentrate on what is going on outside of the window or what we like to call situational awareness. The image displayed below has every signal and background flag turned on. You can and should selectively reduce this to the core indicators that complement our trading style. A complete overview is provided on our site. You can find the link at the bottom of this posting.
StockDotGenie enables new and novice traders to jumpstart their trading expertise by utilizing a simple to use Technical Analysis system. SDG distills that information into a single DOT allowing you to quickly and easily determine, through simple visual cues, what your stock's short term price trend is likely to be. SDG excels at determining and flagging turning points as prices approach support or resistance. These are the areas where stocks make dramatic advancements or change directions. This makes SDG a valuable trading tool for every trader, in every timeframe.
STOCK DOT GENIE takes a different approach to technical analysis. Todays markets are much more volatile. There are many reasons for this, but the primary ones are: 1) the instantaneous availability of information over the internet, 2) Traders instantaneous ability to execute trades, again because of the internet, 3) Institutional Flash trading automatically executing thousands of micro trades per second based on algorithms, 4) Market manipulation by institutions (No I am not paranoid, it’s real). This makes the most recent days price and volume action, the most critical to making accurate short and medium term trading decisions.
Trading decisions have a much higher probability of being correct when made at support and resistance levels. When your equity is approaching or at one of these levels a background flag is activated. The DOT in Stock Dot Genie is a simple and intuitive indicator. The primary calculation is produced by determining the relative position of the center point of the last two trading days. The is a very short term, weighted center of gravity calculation. If todays dot calculation has a higher value than the calculation of the prior dot's weighted data, the current dot is painted green. If it has a smaller value it is painted red. Green indicates buy or remain in a trade. Red indicates sell or remain short in a trade. The indicator is simple, but hundreds of lines of code are utilized producing the initial indicator and a large number of exception test that override the primary indicator. These exception indicators can all be turned on or off in the input options form of the program. They are designed to reintroduce the advantages of moving averages by keeping you in a trade when the primary indicator may be telling to exit.
The benefits: All Moving Average Cross Over Indicators have a little to a lot of lag or signal delay. This lag plays an important role in keeping you in trades that have some level of volatility or the days price action moving against the controlling trend. This advantage of moving averages is also a detriment to your overall profits because this same lag delays your entry and exit signals by one to three days causing a dramatic reduction in the profit potential of moving average cross-over trading systems, no matter how sophisticated the moving average filter calculation may be. STOCK DOT GENIE gets you into a trade on the day the trend has changed. Just a important, when down days occur within an uptrend, SDG will analyze all of the relevant data to the current situation and assist you in the decision to stay in the trade or exit it.
Access this Genie indicator for your Tradingview account, through our web site. (Links Below) This will provide you with additional educational information and reference articles, videos, input and setting options and trading strategies this indicator excels in.

Mirror TSI-MACD by Trader JayI was playing around with the TSI-MACD and surprisingly it works quite well as a mirror.
There are 2 ways this can be used
1. Enter long when Blue line crosses up the Red
2. Exit long when Green line crosses the blue
or
1. Enter long when Blue line crosses up the Red
2. Exit long when Blue line crosses back down below the Red

Red and Green Ignored Bar by Oliver VelezOn this occasion I present a script that detects Ignored Red Candles and Ignored Green Candles, basically it is a Price Action event that indicates a possible continuation of the current trend and gives the opportunity to climb it with a Very tight risk, before delving into detail I would like to leave this note:
Note: the detection of this event does not guarantee that the signal will be good, the trader must have the ability to determine its quality based on aspects such as trend, maturity, support / resistance levels, expansion / contraction of the market, risk / benefit, etc, if you do not have knowledge about this you should not use this indicator since using it without a robust trading plan and experience could cause you to partially or totally lose your money, if this is your case you should train before If you try to extract money from the market, this script was created to be another tool in your trading plan in order to configure the rules at your discretion, execute them consistently and have AUTOMATIC ALERTS when the event occurs, which is where I find more value because you can have many instruments waiting for the event to be generated, in the time frame you want and without having to observe the mer When the alert is generated, the Trader should evaluate the quality of the alert and define whether or not to execute it (higher timeframes, they can give you more time to execute the operation correctly).
Let's continue….
This event was created by Oliver Velez recognized trader / mentor of price action, the event has a very interesting particularity since it allows to take a position with a very limited risk in trend movements, this achieves favorable operations of good ratio and small losses when taking An adjusted risk, if the trade works, a good ratio is quickly achieved and we agree with a key point in the “Keep small losses and big profits” trading, this makes it easier to have a positive mathematical hope when your level of Success is not very high, so leave you in the field of profitability.
THE EVENT:
The event has a bullish configuration (Ignored Red Candle) and a bearish configuration (Ignored Green Candle), below I detail the “Hard” rules (later I explain why “Hard”):
1- Last 3 bars have to be GREEN-RED-GREEN (possible bullish configuration) or RED-GREEN-RED (possible bearish configuration), the first bar is called Control Bar, the second is called Ignored Bar and the third Signal Bar as shown in the following image:
2- Be in a trend determined by simple moving averages (Slow of 20 periods and Fast of 8 periods), as a general rule you can take the direction of MA20 but the Trader has to determine if there is a trend movement or not.
3- Control bar of good range, little tail and with a body greater than 55%.
4- Ignored bar preferably narrow range, little tail and that is located in the upper 1/3 of the control bar.
5- Signal bar cannot override the minimum of the ignored bar.
6- Activation / Confirmation of event by means of signal bar in overcoming the body of the ignored bar.
Some examples of ignored bars (with “Hard” and “Flexible” rules):
Features and configuration of the indicator:
To access the indicator settings, press the wheel next to the indicator name VVI_VRI "Configuration options".
- Operation mode (Filtering Type):
• Filtering Complete: all filters activated according to the configuration below.
• Without Filtering: all filters deactivated, all VRI / VVI are displayed without any selection criteria.
• Trend Filter only: shows only VRI / VVI that are in accordance with what is set in “Trend Settings”
- Configuration Moving Averages:
• See Slow Media: slow moving average display with direction detection and color change.
• See Fast Media: display of fast moving average with direction detection and color change.
• Type: possibility to choose the type of media: DEMA, EMA, HullMA, SMA, SSMA, SSMA, TEMA, TMA, VWMA, WMA, ZEMA)
• Period: number of previous bars.
• Source: possibility to choose the type of source, open, close, high, low, hl2 hlc3, ohlc4.
• Reaction: this configuration affects the color change before a change of direction, 1 being an immediate reaction and higher values, a more delayed reaction obtaining les false "changes of direction", a value of 3 filters the direction quite well.
- Trend Configuration
• Uptrend Condition P / VRI: possibility to select any of these conditions:
o Bullish MA direction
o Quick bullish MA direction
o Slow and fast bullish MA direction
o Price higher than slow MA
o Price higher than fast MA
o Price higher than slow and fast MA
o Price higher than slow MA and bullish direction
o Price higher than fast MA and bullish direction
o Price higher than slow, fast MA and bullish direction
o No condition
• Condition P / VVI bear trend: possibility of selecting any of these conditions:
o Slow bearish MA direction
o Fast bearish MA direction
o Slow and fast bearish MA direction
o Price less than slow MA
o Price less than fast MA
o Price less than slow and fast MA
o Price lower than slow MA and bearish direction
o Price less than fast MA and bearish direction
o Price less than slow, fast MA and bearish direction
o No condition
- Control bar configuration
• Minimum body percentage%: possibility to select what body percentage the bar must have.
• Paint control bar: when selected, paint the control bar.
• See control bar label: when selected, a label with the legend BC is plotted.
- Configuration bar ignored
• Above X% of the control bar: possibility to select above what percentage of the control bar the ignored bar must be located.
• Paint ignored bar: when selected, paint the ignored bar.
- Signal bar configuration
• You cannot override the minimum of the ignored bar: when selected, the condition is added that the signal bar cannot override the minimum of the ignored bar.
• Paint signal bar: when selected, paint the signal bar.
• See arrow: when selected it shows the direction arrow of the possible movement.
• See bear and arrow: when selected it shows bear and arrow label
• See bull and arrow: when selected it shows bull and arrow label
The following image shows the ignored bar and painted signal:
- Take profit / loss
The profit / loss taking varies depending on the trader and its risk / monetary plan, the proposal is a recommendation based on the nature of the event that is to have a small risk unit (stop below the minimum of the ignored bar), look for objectives in ratios greater than 2: 1 and eliminate the risk in 1: 1 by taking the stop to BE, all parameters are configurable and are the following:
• See recommended stop loss and take profit: trace the levels of Stop, BE, TP1 and TP2, as well as their prices to know them quickly based on the assumed risk
• To: select which event you want to draw the SL and TP (VRI, VVI)
• Extend stop loss line x bars: allows extending the stop line by x number of bars
• Extend take profit line x bars: allows extending the stop line by x number of bars
• Ratio to move to break even: allows you to select the minimum ratio to move stop to break even (default 1: 1)
• Take profit 1 ratio: allows you to select the ratio for take profit 1 (default 2: 1)
• Take profit 2 ratio: allows you to select the ratio for take profit 2 (default 4: 1)
- Alerts
• It is possible to configure the following alerts:
-VRI DETECTED
-VVI DETECTED
-VRI / VVI DETECTED
Final Notes:
- The term hard rules refers to the fact that an event is sought with the rules detailed above to obtain a high quality event but this brings 2 situations to consider, less
number of events and events that are generated in a strong impulse may be leaked, a very large control bar followed by an ignored narrow body away from moving averages, despite having a good chance of continuing, taking a stop very tight in a strong impulse you can touch it by the simple fact of the own volatility at that time.
- The setting of the parameters “Minimum body percentage% (control bar)”, “Above x% of the control bar (bar ignored)” and “Cannot override the minimum of the ignored bar” can bring large Benefits in terms of number of events and that can also be of high quality, feel free to find the best configuration for your instrument to operate.
- It is recommended to look for trending events, near moving averages and at an early stage of it.
- The display of several nearby VRIs or VVIs in an advanced trend may indicate a depletion of it.
- The alerts can be worked in 2 ways: at the closing of the candle (confirms event but the risk unit may be larger or smaller) or immediately the body of the ignored bar is exceeded, in case you are operating from the mobile and miss many events because of the short time I recommend that you operate in a superior time frame to have more time.
- The indicator is configured with “flexible” rules to have more events, but without any important criteria, each trader has to look for the best configuration that suits his instrument.
- It is recommended to partially close the operation based on the ratio and always keep a part of the position to apply manual trailing stop and try to maximize profits.
The code is open feel free to use and modify it, a mention in credits is appreciated.
If you liked this SCRIPT THUMB UP!
Greetings to all, I wish you much green!

Keltner Channel with signals [ChuckBanger]This is Keltner Channel where I added Bull and Bear signals. It has a lot of settings to play around with. Have fun...
For more information on Keltner Channel: www.investopedia.com

Market Thrust IndicatorThe Market Thrust indicator is a powerful measure of the stock market's internal strength or weakness. There are four components to this indicator:
1-Advancing Issues on the New York Stock Exchange (NYSE) – $ADV
2-Advancing Volume on the NYSE – $UVOL
3-Declining Issues on the NYSE – $DECL
4-Declining Volume on the NYSE – $DVOL
The formula for Market Thrust is given below:
($ADV x $UVOL)-($DECL x $DVOL)
When used for day-trading, the trend of the Market Thrust indicator is what is most important.
Rising Market Thrust Indicator: Considered a bullish sign; can act as a confirmation signal when combined with a rising stock, index ETF, or stock index future's price.
Falling Market Thrust Indicator: Considered a bearish sign; can act as a confirmation signal of a decreasing market price.
The Market Thrust indicator could be used for detecting divergences in trends. Divergences occur when:
- Price is trending higher, but the Market Thrust indicator is not moving higher or is even going down.
- Price is trending lower, however, the Market Thrust technical analysis tool is not trending lower, it is either not trending or is trending higher.
Add a fully configurable trend line over MTI.
Read more at: commodity.com

Leledc Exhaustion Bar V4 PLUSLeledc Exhaustion Bar indicator created by glaz converted to Pine 4, plotshape was added.


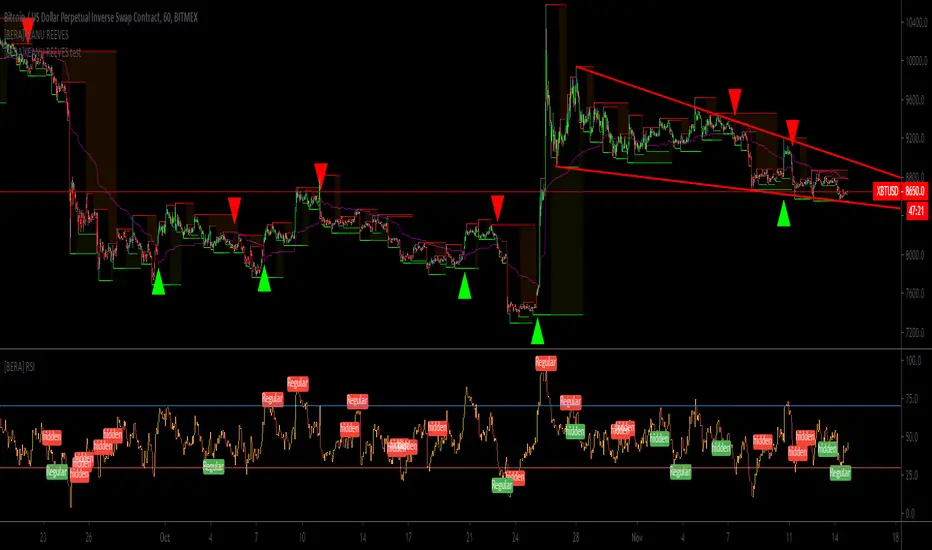
[BERA]KEANU REEVESThis is BUY/SELL indicator integrated with support and resistance (HIGH AND LOW).
THIS IS ONLY FOR TESTING PURPOSES(SOME PEOPLE ASKED ME A TRY), I WILL REMOVE IT.
Indicator based on Average true range .
LIME ARROW = LONG
RED ARROW = SHORT
LIME COLOR BARS IF GREEN ARROW CONDITION VALID.
RED COLOR BARS IF RED ARROW CONDITION VALID.
>CURRENT SETUP OF METRICS IS IDEAL FOR BTC H1 CHART, FOR ALTCOINS YOU SHOULD USE DIFFERENT METRICS,
RSI with an Opinion (UO)This RSI has a very clear idea about when to buy and sell. It plots buy and sell signals. It is an expert system. Yes, of course, it can make some errors. You should have used stop-loss

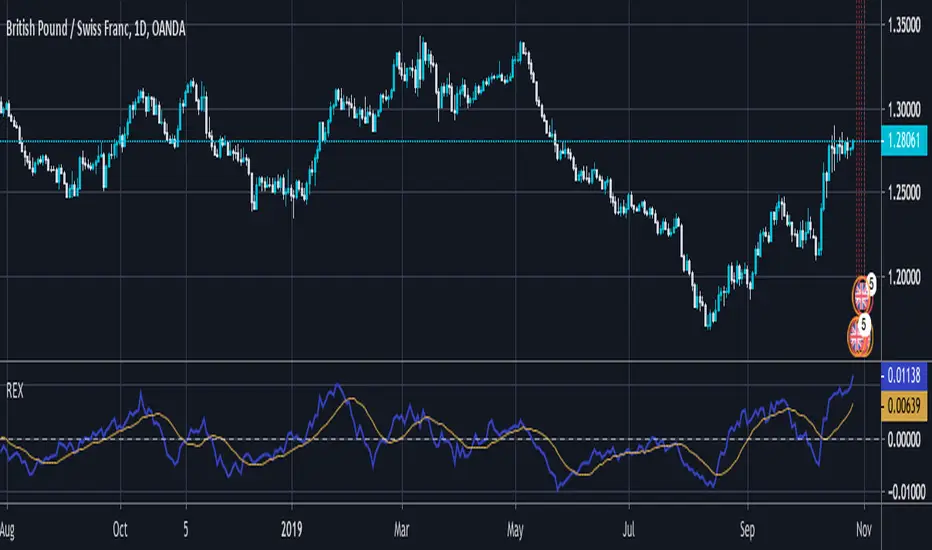
REX by vitelot// Best used as an exit indicator at default settings.
// Also doing well in entering positions by using TEMA(14) for REX and SMA(14) as signal.
// You need to tune it yourself according to your trading style.
// Use at your own risk.
//
// Vitelot/Yanez/Vts Oct 2019
//
Stochastic RSIStochastic RSI
It is generally used to generate signals when crossings are made in overbought or oversold areas,
but it is important to take advantage of these signals according to the general trend, in this way we avoid false signals.
Overbought doesn't necessarily mean the price will reverse lower, just like oversold doesn't mean the price will reverse higher.
Rather the overbought and oversold conditions simply alert traders that the RSI is near the extremes of its recent readings.
So the main idea will be to use the signals as long as we are trending in the same direction,
the other crosses will be used as signals to take profits or as warning signs to check our trades.
Extra functions in this indicator:
- Trend background.
- Long and Short Labels base on trend and take profit warnings.
- Alerts for long and short entries and take profit warnings.
Take Profit / Warning Labels enable (Orange)

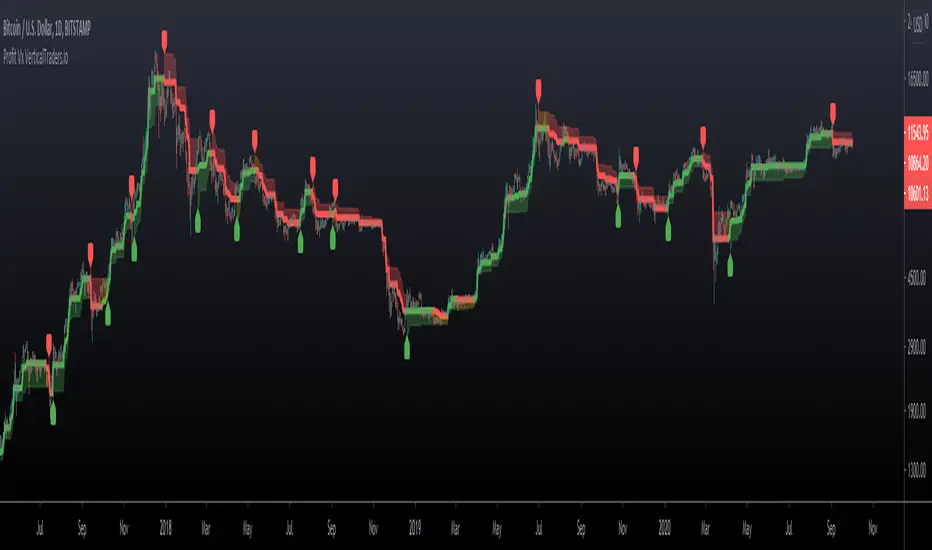
Profit VxProfit Vx
- Labels for Long and Short entries
- Take Profit point base on %
- Candlestick color, orange is warning or not trending zone
Scalping BerkinAlex 1
--------Inglés---------
Updated to Pine Script v4. 👌
Added labels (indicators) of Purchase and Sale according to moving averages for scalping and intraday. 🤑
Fusion of the "Scalping BerkinAlex 3" indicator with the "Scalping BerkinAlex 1", so as not to occupy a slot of indicators unnecessarily if you have a free account. 😜
Alert system designed, now you can create an alert in free mode according to the possibility of buying or selling an asset.🔔
Errors found fixed.💪
---------Español---------
Actualizado a Pine Script v4. 👌
Añadidas etiquetas (indicadores) de Compra y Venta según medias móviles para scalping e intradía. 🤑
Fusión del indicador "Scalping BerkinAlex 3" con el "Scalping BerkinAlex 1", para así no ocupar un slot de indicadores innecesariamente en caso de disponer cuenta gratuita. 😜
Sistema de alertas diseñado, ahora podrás crear una alerta en modo gratuito según exista la posibilidad de comprar o vender un activo.🔔
Errores encontrados solucionados.💪

Signal To Noise Ratio IndicatorThis is a trend indicator at its core so combine with rsi or a moving average of your choice to see which direction the stock is trending in.
Only enter a position (long or short) when signal to noise ratio is above the signal line
This is one of my first indicators posted on here so be sure to leave me feedback


Modified Signal to Noise Ratio (SNR) - EhlersThis is my "Modified Signal to Noise Ratio" (SNR) indicator using Pine Script version 4.0, freely available to ALL! While creating my "Enhanced Instantaneous Cycle Period" detector, within the same document entitled "SIGNAL ANALYSIS CONCEPTS" written by Dr. John Ehlers, there was code for a signal to noise indicator. So, I adapted it to Pine Script v4.0.
Notice: Consider this to be experimental, but it may come in handy for a few traders who figure out how to use it.
Overviewing it's display on multiple assets with the "Original" formulation, I noticed the "Signal to Noise Ratio" looked commonly hunky-dory all too often except for on a few occasions. You will see that displayed above in the upper indicator and notice how smooth it is. Hmm... The original formulation utilizes three EMAs, and I pondered if that was providing too much smoothing and additional lag. I figured I would try another filter in it's place that may be favorable, and the results seemed more likely as I originally expected, for the most part.
Displayed above, the second indicator from the top, is the "Modified Formulation" that is selectable in the indicator "Settings". You will notice on the left, the highlighting is revealing itself while encountering volatile areas of the assets price. When I encounter this, I switch to a lower time frame to see in more detail what is transpiring. The signal to noise ratio may have a better appearance after doing so. On the 1 second time frame, many assets look like a trading nightmare and that is reflected in the SNR indicator. While on the 30 second time frame, many price fluctuations often look reasonable, but this depends always on the asset too. The point is, if there is an abundance of yellow and/or especially red across the indicator, it may be a good time to consider switching time frames. Some assets are just highly volatile and that's just the way it is. I provided a range smoothing control for ONLY the modified formulation in the indicator "Settings" to attempt to mitigate a choppy SNR signal, but that typically has minimal effect. Setting it too low just makes the SNR worse.
How is the highlighting set up? Yellow is cautionary and red is worst case signal to noise. Keep in mind the scale is ranged in decibels. Anything below 6 decibels in red, below the red dotted line, is an indication of high noise detection. Below the yellow line of 10dB is definitely a cautionary zone down to 6dB. Ideally, above 12dB is ordinarily a signal that may be worth analyzing. The red and yellow dotted lines are adjustable in "Settings" too, and I provided three types of highlighting selectable in the indicator "Settings".
I sourced my "Simple Sine Wave Generator" to the signal to noise indicator, and the signal to noise ratio is upwards towards an astounding 90dB signal to noise on both SNR formulations. 90dB is a SUPERB signal level to pump through a loudspeaker without any audible "noise" to hear, FYI. If only the stock market gave signals like my "Simple Sine Wave Generator"...
I hope that explains how this indicator may be used with the potential to assist you with finding a suitable time frame for trading on certain assets.
Features List Includes:
I.P.O.C.S.(Initial Public Offering Clean Start) Technology
Enable/disable dark background for enhanced visibility
"Source" selection with multiple time frame adjustments
"SNR Formulation" adjustment
"Smooth Range" tweak
Threshold adjustments
"Highlighting Methods" selection
The comments section below is solely just for commenting and other remarks, ideas, compliments, etc... regarding only this indicator, not others. If you do have any general questions or comments regarding this indicator, I will consider your inquiries, thoughts, and ideas presented below in the comments section, when time provides it. As always, "Like" it if you simply just like it with a proper thumbs up, and also return to my scripts list occasionally for additional postings. Have a profitable future everyone!

Smart Labelling - Range FilterThis is a labelling module based on a range filter . Notice that the trick here is to use fibonachi numbers . Use smaller range multiplier for higher TFs. This module may serve as a signal generator to be passed through a signal filter.
Quote from the original author:
This is an experimental study designed to filter out minor price action for a clearer view of trends. Inspired by the QQE's volatility filter, this filter applies the process directly to price rather than to a smoothed RSI. First, a smooth average price range is calculated for the basis of the filter and multiplied by a specified amount. Next, the filter is calculated by gating price movements that do not exceed the specified range. Lastly the target ranges are plotted to display the prices that will trigger filter movement.

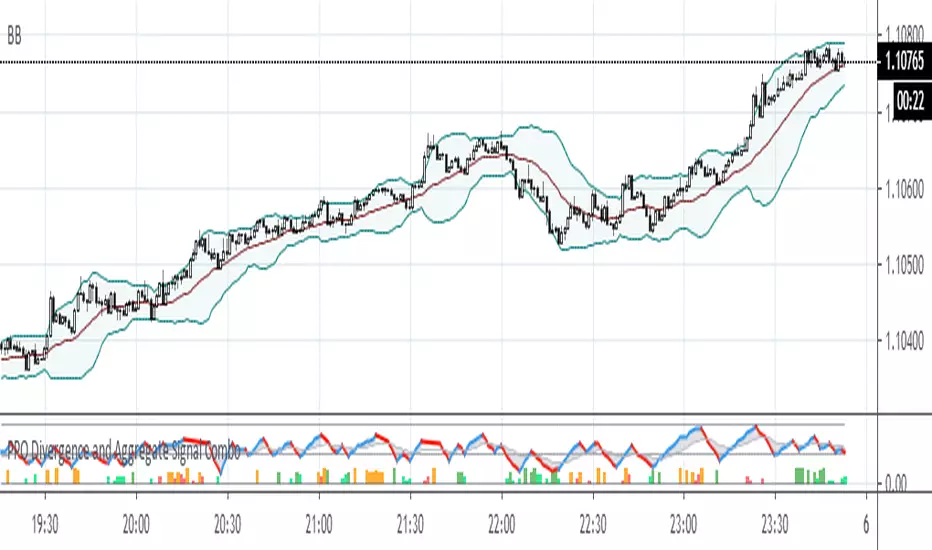
PPO Divergence and Aggregate Signal ComboThis is a further development of the last two posts on aggregated signal generation. It shows how to implement the idea in conjunction with another indicator. In this case general rule for long and short entry: the aggregated curve (gray) must cross the mid-line. Colored columns serve as an early warning. Settings were tested with EURUSD in 5m, 30m and 1H TFs.
Algorithm Builder (Signal version)Gentlemen traders
As promised, here's the Algorithm Builder (Signal Version) that is an alternative version of that previous indicator : Strategy-Builder-Crypto-Single-Trend-Plots/
This one was quite successful and already 11 person bought for me which is unbelievable. Thank you so much guys for your appreciation of my work
The script of this present post is still invite-only because it required years in the making (it's the fruit of all my errors and trials while trading for the past 7 years and when developing trading bots for traders professionally)
What's the Algorithm Builder?
Simply put, the indicator will detect the confluence/convergence of multiple unrelated indicators and alert you when the ones YOU selected will be in the same direction. (if you didn't understand this it's because I'm french)
For example, let's say you select a MM cross and MACD, whenever the MM cross will be green/bullish AND MACD green/bullish also, you'll get a nice .... wait for it..... green/bullish /diamond. Starting to see what I meant before now :)
Not sure if I should go as far as introducing the other example but let's go for it. Still, in the same spirit, a confluence of red/bearish MM cross and red/bearish MACD will give .... (finish the sentence and you'll get my appreciation. hint: the color of the diamond will be red)
So what's cool about it now ... or I should say even cooler... even more awesome (Barney Stinson, please hive five me for this tool...) is that it can be plugged in a single click to a complete Backtest engine
I inspired myself greatly from the Pinescripters Backtesting-Trading-Engine-PineCoders/ but had to make changes to adapt it to my tool.
It took me a few days of work and I'll share it also tomorrow so please stay tuned and give me a follow so that you'll be updated
In the Backtester itself, I added some features like :
- Stop-loss based on supertrend
- Hard Exit based on indicators used by the Algorithm Builder
I just made it more relevant for my indicator
Performance sir?
The period selected for the screenshot below is the last 3 months
Here's a preview of what you should expect tomorrow as well imgur.com
There isn't a BEST configuration for the tool. I made one that matches my psychology and capital. You'll have to find yours by playing with it or asking me for a bit of help if you're lost
Will require a bit of work but could be very worth it in the end :)
What's next sir?
I'm perfectly aware that the indicator doesn't give a lot of signals and that's because it's an entry-level version of all the Algorithm Builders I'm selling now and will be available on my website by end of August (along with the website itself)
More advanced versions already made allow to :
- get more entries
that one is the best addition, in my opinion, it multiplies the gains (and losses :P) as it allows some orders pyramiding and to reinforce a position if the trend is very strong. You won't have to do anything, just to wait for the alerts by email/sms from TradingView
- multiple take profit levels
- connected to systems like Autoview/ProfitView to automatize even more your trading and send those signals to your broker directly (I will strongly advise starting with a demo account for 1 week or 2 here, I don't want you to burn your capital if any unexpected bad event will happen)
- screener
If you're interested please message me. I can develop your custom indicator/strategy/backtest/automatic system or if you're ready the take the leap of faith and try this indicator or the more advanced versions
And before I get asked, yes this is the tool I use for my own trading as initially, I made it for me. Now sharing a bit of my work (and too much of my life) with the community
PS
____________________________________________________________
Feel free to hit the thumbs up as it shows me that I'm not doing this for nothing and will motivate to deliver more quality content in the future.
- I'm an officially approved PineEditor/LUA/MT4 approved mentor on codementor. You can request a coaching with me if you want and I'll teach you how to build kick-ass indicators and strategies
Jump on a 1 to 1 coaching with me
- You can also hire for a custom dev of your indicator/strategy/bot/chrome extension/python
- if you like my work and wants to buy me some coffee :
- BTC TipJar: 3MKDve7stWTe1io99oFxeQXvP8XB4zCQ8m
- LTC TipJar: MC5oeBAhw9BLqyi65TR3J1Lid8io9uHADw

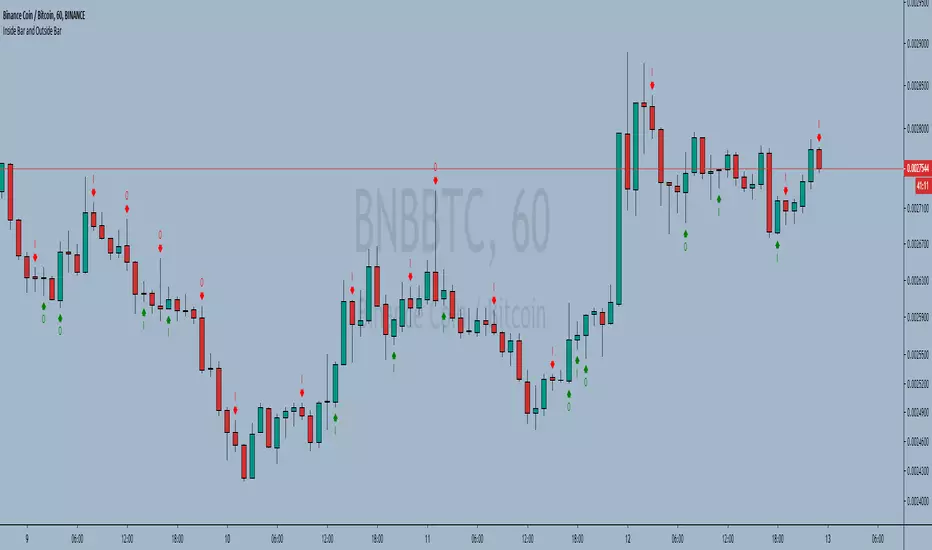
Inside Bar and Outside Bar Simple indicator, to show outside bars and inside bars
inside sellbar = "I" in red color
inside buybar = "I" in green color
Outside sellbar = "O" in red color
Outside buybar = "O" in green color
----------//---------------
PT-BR
Indicador simples, para mostrar outside bars e inside bars
inside sellbar = "I" na cor vermelha
inside buybar = "I" na cor verde
Outside sellbar = "O" na cor vermelha
Outside buybar = "O" na cor verde